Namibia Edible Flakes Market (2024-2030) | Share, Trends, Size, Analysis, Outlook, Companies, Value, Revenue, Forecast, Industry, Growth & Segmentation
Market Forecast By Product (Corn flakes, Wheat flakes, Rice flakes, Flakey oats, Others), By Distribution Channel (Supermarkets & hypermarkets, Convenience stores, Online retailers) And Competitive Landscape
| Product Code: ETC4845132 | Publication Date: Nov 2023 | Updated Date: Apr 2025 | Product Type: Market Research Report | |
| Publisher: 6Wresearch | Author: Shubham Padhi | No. of Pages: 60 | No. of Figures: 30 | No. of Tables: 5 |
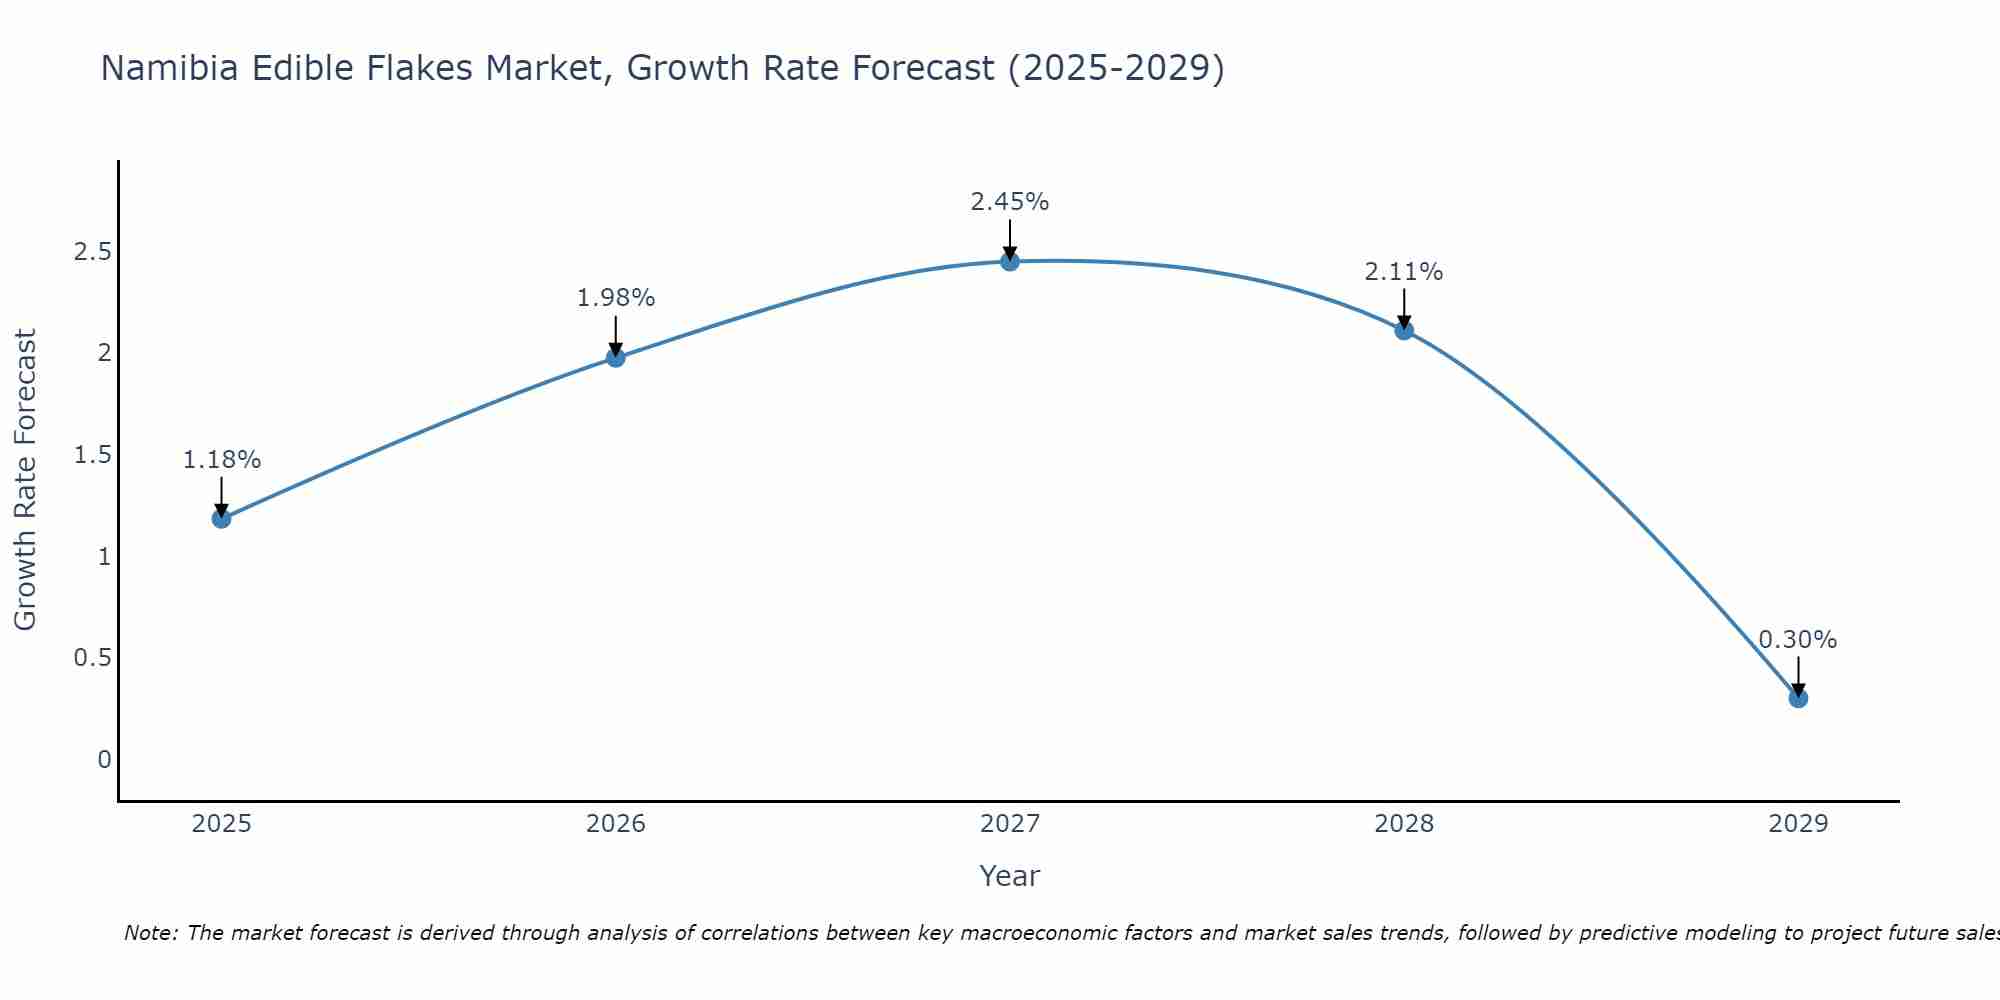
Namibia Edible Flakes Market Size Growth Rate
The Namibia Edible Flakes Market is projected to witness mixed growth rate patterns during 2025 to 2029. Growth accelerates to 2.45% in 2027, following an initial rate of 1.18%, before easing to 0.30% at the end of the period.
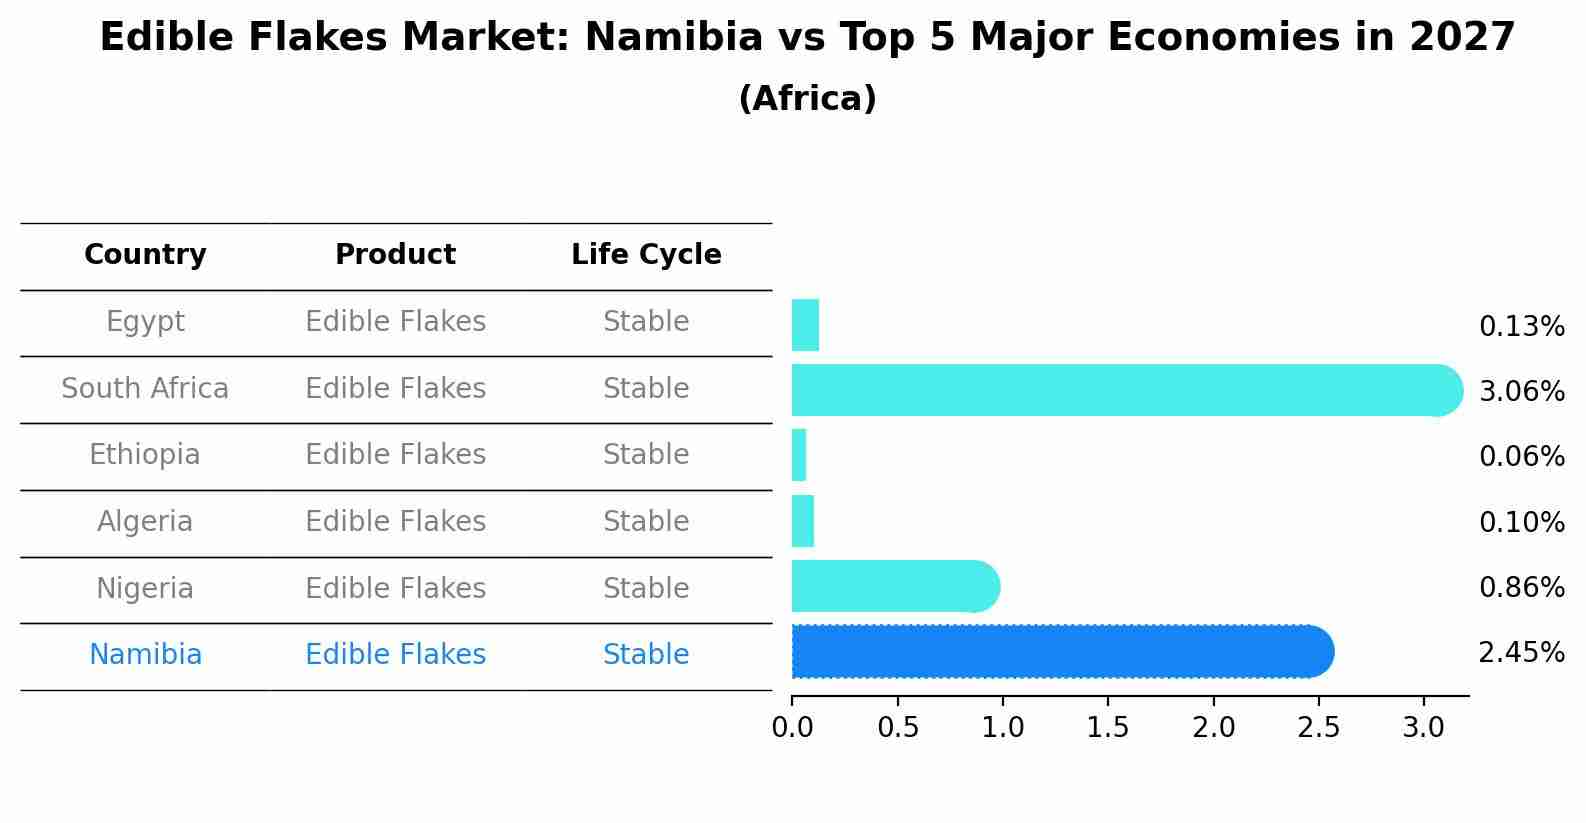
Edible Flakes Market: Namibia vs Top 5 Major Economies in 2027 (Africa)
The Edible Flakes market in Namibia is projected to grow at a stable growth rate of 2.45% by 2027, within the Africa region led by Egypt, along with other countries like South Africa, Ethiopia, Algeria and Nigeria, collectively shaping a dynamic and evolving market environment driven by innovation and increasing adoption of emerging technologies.
Namibia Edible Flakes Market Competition 2023
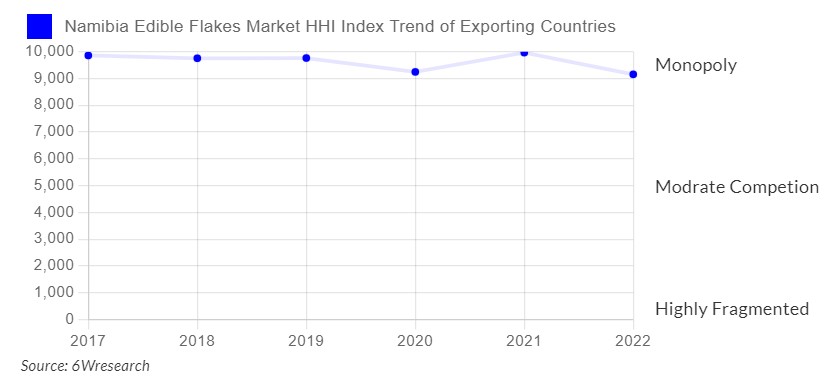
Note: The HHI Index which is also known as the Herfindahl–Hirschman index measures the competition in the country. HHI which is lower than 1500 signifies high competitiveness, 1500-2500 shows moderate competition and 2500-6000 means concentrated and more than 6000 means highly concentrated.
Namibia's Edible Flakes market, in 2023, witnessed an HHI of 9156, which has declined substantially in comparison to the HHI of 9861 in 2017. The market is moving towards highly concentrated. The Herfindahl index measures the competitiveness of exporting countries. The range lies from 0 to 10000, where a lower index number represents a larger number of players or exporting countries in the market while a large index number means fewer numbers of players or countries exporting in the market.
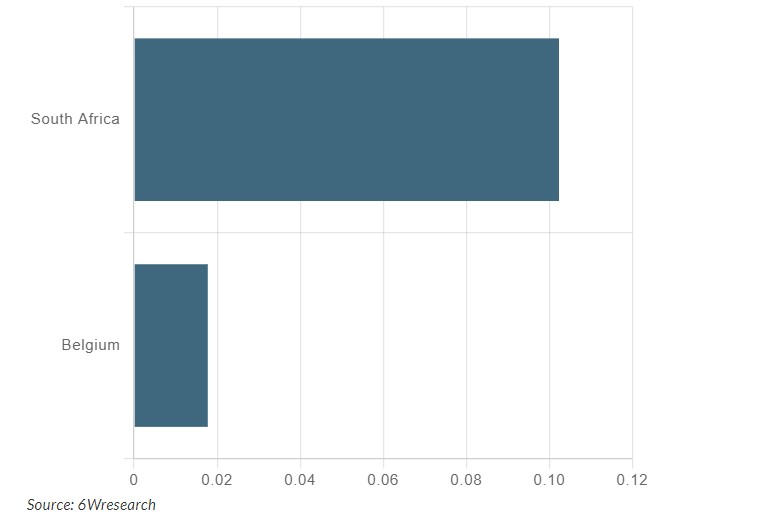
Namibia Export Potential Assessment For Edible Flakes Market (USD Values in Thousand)
Key Highlights of the Report:
- Namibia Edible Flakes Market Outlook
- Market Size of Namibia Edible Flakes Market, 2023
- Forecast of Namibia Edible Flakes Market, 2030
- Historical Data and Forecast of Namibia Edible Flakes Revenues & Volume for the Period 2020-2030
- Namibia Edible Flakes Market Trend Evolution
- Namibia Edible Flakes Market Drivers and Challenges
- Namibia Edible Flakes Price Trends
- Namibia Edible Flakes Porter`s Five Forces
- Namibia Edible Flakes Industry Life Cycle
- Historical Data and Forecast of Namibia Edible Flakes Market Revenues & Volume By Product for the Period 2020-2030
- Historical Data and Forecast of Namibia Edible Flakes Market Revenues & Volume By Corn flakes for the Period 2020-2030
- Historical Data and Forecast of Namibia Edible Flakes Market Revenues & Volume By Wheat flakes for the Period 2020-2030
- Historical Data and Forecast of Namibia Edible Flakes Market Revenues & Volume By Rice flakes for the Period 2020-2030
- Historical Data and Forecast of Namibia Edible Flakes Market Revenues & Volume By Flakey oats for the Period 2020-2030
- Historical Data and Forecast of Namibia Edible Flakes Market Revenues & Volume By Others for the Period 2020-2030
- Historical Data and Forecast of Namibia Edible Flakes Market Revenues & Volume By Distribution Channel for the Period 2020-2030
- Historical Data and Forecast of Namibia Edible Flakes Market Revenues & Volume By Supermarkets & hypermarkets for the Period 2020-2030
- Historical Data and Forecast of Namibia Edible Flakes Market Revenues & Volume By Convenience stores for the Period 2020-2030
- Historical Data and Forecast of Namibia Edible Flakes Market Revenues & Volume By Online retailers for the Period 2020-2030
- Namibia Edible Flakes Import Export Trade Statistics
- Market Opportunity Assessment By Product
- Market Opportunity Assessment By Distribution Channel
- Namibia Edible Flakes Top Companies Market Share
- Namibia Edible Flakes Competitive Benchmarking By Technical and Operational Parameters
- Namibia Edible Flakes Company Profiles
- Namibia Edible Flakes Key Strategic Recommendations
Frequently Asked Questions About the Market Study (FAQs):
6Wresearch actively monitors the Namibia Edible Flakes Market and publishes its comprehensive annual report, highlighting emerging trends, growth drivers, revenue analysis, and forecast outlook. Our insights help businesses to make data-backed strategic decisions with ongoing market dynamics. Our analysts track relevent industries related to the Namibia Edible Flakes Market, allowing our clients with actionable intelligence and reliable forecasts tailored to emerging regional needs.
Yes, we provide customisation as per your requirements. To learn more, feel free to contact us on sales@6wresearch.com
13 Disclaimer
|
1 Executive Summary |
|
2 Introduction |
|
2.1 Key Highlights of the Report |
|
2.2 Report Description |
|
2.3 Market Scope & Segmentation |
|
2.4 Research Methodology |
|
2.5 Assumptions |
|
3 Namibia Edible Flakes Market Overview |
|
3.1 Namibia Country Macro Economic Indicators |
|
3.2 Namibia Edible Flakes Market Revenues & Volume, 2020 & 2030F |
|
3.3 Namibia Edible Flakes Market - Industry Life Cycle |
|
3.4 Namibia Edible Flakes Market - Porter's Five Forces |
|
3.5 Namibia Edible Flakes Market Revenues & Volume Share, By Product, 2020 & 2030F |
|
3.6 Namibia Edible Flakes Market Revenues & Volume Share, By Distribution Channel, 2020 & 2030F |
|
4 Namibia Edible Flakes Market Dynamics |
|
4.1 Impact Analysis |
|
4.2 Market Drivers |
|
4.3 Market Restraints |
|
5 Namibia Edible Flakes Market Trends |
|
6 Namibia Edible Flakes Market Segmentations |
|
6.1 Namibia Edible Flakes Market, By Product |
|
6.1.1 Overview and Analysis |
|
6.1.2 Namibia Edible Flakes Market Revenues & Volume, By Corn flakes, 2020-2030F |
|
6.1.3 Namibia Edible Flakes Market Revenues & Volume, By Wheat flakes, 2020-2030F |
|
6.1.4 Namibia Edible Flakes Market Revenues & Volume, By Rice flakes, 2020-2030F |
|
6.1.5 Namibia Edible Flakes Market Revenues & Volume, By Flakey oats, 2020-2030F |
|
6.1.6 Namibia Edible Flakes Market Revenues & Volume, By Others, 2020-2030F |
|
6.2 Namibia Edible Flakes Market, By Distribution Channel |
|
6.2.1 Overview and Analysis |
|
6.2.2 Namibia Edible Flakes Market Revenues & Volume, By Supermarkets & hypermarkets, 2020-2030F |
|
6.2.3 Namibia Edible Flakes Market Revenues & Volume, By Convenience stores, 2020-2030F |
|
6.2.4 Namibia Edible Flakes Market Revenues & Volume, By Online retailers, 2020-2030F |
|
7 Namibia Edible Flakes Market Import-Export Trade Statistics |
|
7.1 Namibia Edible Flakes Market Export to Major Countries |
|
7.2 Namibia Edible Flakes Market Imports from Major Countries |
|
8 Namibia Edible Flakes Market Key Performance Indicators |
|
9 Namibia Edible Flakes Market - Opportunity Assessment |
|
9.1 Namibia Edible Flakes Market Opportunity Assessment, By Product, 2020 & 2030F |
|
9.2 Namibia Edible Flakes Market Opportunity Assessment, By Distribution Channel, 2020 & 2030F |
|
10 Namibia Edible Flakes Market - Competitive Landscape |
|
10.1 Namibia Edible Flakes Market Revenue Share, By Companies, 2023 |
|
10.2 Namibia Edible Flakes Market Competitive Benchmarking, By Operating and Technical Parameters |
|
11 Company Profiles |
|
12 Recommendations |
Global Go To Market Strategy - 2030
Export potential enables firms to identify high-growth global markets with greater confidence by combining advanced trade intelligence with a structured quantitative methodology. The framework analyzes emerging demand trends and country-level import patterns while integrating macroeconomic and trade datasets such as GDP and population forecasts, bilateral import–export flows, tariff structures, elasticity differentials between developed and developing economies, geographic distance, and import demand projections. Using weighted trade values from 2020–2024 as the base period to project country-to-country export potential for 2030, these inputs are operationalized through calculated drivers such as gravity model parameters, tariff impact factors, and projected GDP per-capita growth. Through an analysis of hidden potentials, demand hotspots, and market conditions that are most favorable to success, this method enables firms to focus on target countries, maximize returns, and global expansion with data, backed by accuracy.
By factoring in the projected importer demand gap that is currently unmet and could be potential opportunity, it identifies the potential for the Exporter (Country) among 190 countries, against the general trade analysis, which identifies the biggest importer or exporter.
To discover high-growth global markets and optimize your business strategy:
Click Here
Pricing
- Single User License$ 1,995
- Department License$ 2,400
- Site License$ 3,120
- Global License$ 3,795

Leadership Perspectives from Industry Events
Search
Thought Leadership and Analyst Meet


Our Clients
6WResearch In News
- India Export Attractiveness Tracker 2026
- India Air Conditioner Market Set for Strong Rebound in 2026 After Weather-Led Correction and GST-Driven Recovery: 6Wresearch
- ADAS in India: How Automatic Emergency Braking, Blind Spot Detection & Driver Monitoring are Transforming Road Safety
- Doha a strategic location for EV manufacturing hub: IPA Qatar
- Demand for luxury TVs surging in the GCC, says Samsung
- Empowering Growth: The Thriving Journey of Bangladesh’s Cable Industry
Latest Reports
- Nicaragua RPG Gaming Market (2026-2032)
- New Zealand RPG Gaming Market (2026-2032)
- Netherlands RPG Gaming Market (2026-2032)
- Nauru RPG Gaming Market (2026-2032)
- Namibia RPG Gaming Market (2026-2032)
- Mozambique RPG Gaming Market (2026-2032)
- Montenegro RPG Gaming Market (2026-2032)
- Mongolia RPG Gaming Market (2026-2032)
- Monaco RPG Gaming Market (2026-2032)
- Micronesia RPG Gaming Market (2026-2032)
Industry Events and Analyst Meet

EV India Expo 2026

HIMTEX 2026

India Refining Summit 2026

India EV Show 2026

EV tech India Expo 2026
Whitepaper
- Middle East & Africa Commercial Security Market Click here to view more.
- Middle East & Africa Fire Safety Systems & Equipment Market Click here to view more.
- GCC Drone Market Click here to view more.
- Middle East Lighting Fixture Market Click here to view more.
- GCC Physical & Perimeter Security Market Click here to view more.