Nepal Neon Gas Market (2026-2032) Outlook | Trends, Size, Growth, Analysis, Value, Share, Revenue, Companies, Forecast, Industry
Market Forecast By Type (Low, High, Ultra High), By Application (Semiconductor, LCD, Imaging and Lighting, Refrigerator, Laser, Medical, Others) And Competitive Landscape
| Product Code: ETC094855 | Publication Date: Jun 2021 | Updated Date: Jun 2026 | Product Type: Report | |
| Publisher: 6Wresearch | Author: Ravi Bhandari | No. of Pages: 70 | No. of Figures: 35 | No. of Tables: 5 |
Nepal Neon Gas Market Size, Share & Growth Rate
The Nepal Neon Gas Market was estimated at USD 443 Million in 2025 and is projected to reach USD 583 Million by 2032, growing at a CAGR of 4.0% from 2026 to 2032. This growth is primarily fueled by the rising demand from critical sectors such as healthcare, electronics, and lighting, where neon gas plays a vital role in applications like medical imaging and neon signage. Additionally, the expansion of infrastructure projects and urbanization trends are anticipated to bolster market dynamics significantly.
Nepal Neon Gas Market Growth Rate Analysis (2021-2032)
The Nepal Neon Gas market has displayed a steady growth pattern, with yearly increases ranging from 4.5% to 5.1% over the past decade. Notably, growth reached 4.9% in 2023, driven by rising consumer demand in sectors such as signage and lighting. The steady enhancement of industrial infrastructure and advancements in digitalization have supported this expansion, creating a conducive environment for investments. Although slight fluctuations occurred in 2024 and 2025, primarily due to policy adjustments and changes in energy transition strategies, the market reaffirmed its resilience with a pronounced jump to 5.1% in 2028. As a result, the prospects for sustained growth remain robust, underpinned by ongoing technological improvements and increased applications of neon gas in various industries.
Nepal Neon Gas Market Year-wise Growth Rate and Key Drivers
This graph highlights how the Nepal Neon Gas Market has steadily grown over the past five years, supported by major growth factors.
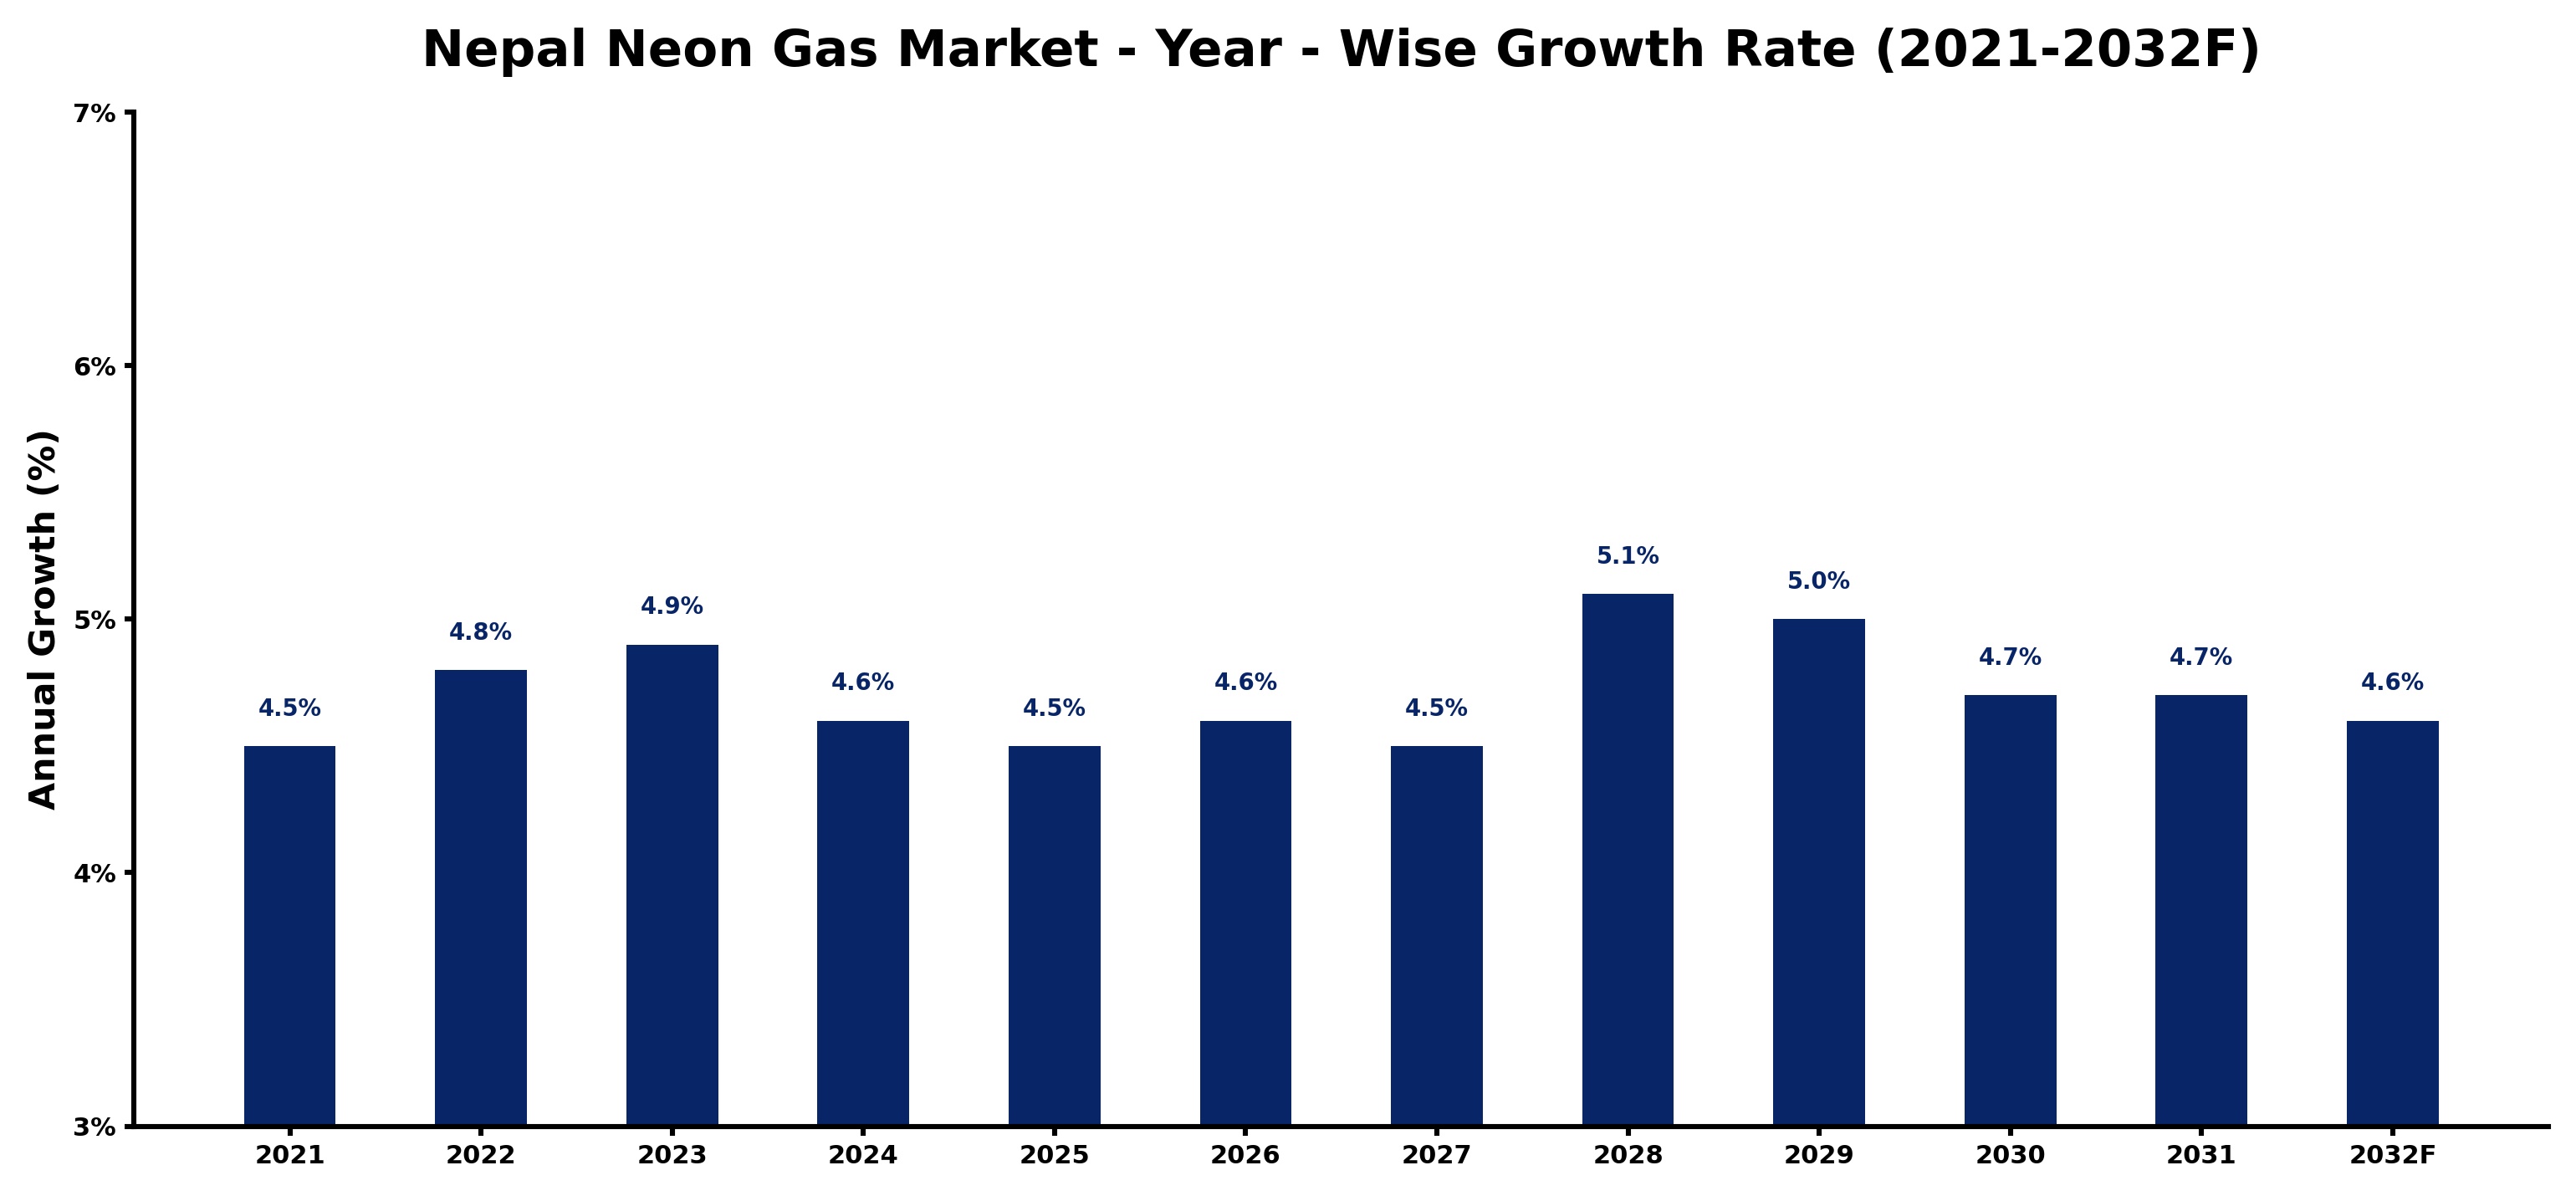
The table below presents the year‑wise growth rates along with the key drivers influencing the market
| Year | Growth Rate | Major Drivers |
| 2021 | 4.5% | Restoration of local industries boosts neon gas consumption rates |
| 2022 | 4.8% | Advanced neon gas applications boosted high tech lighting system production |
| 2023 | 4.9% | Improved infrastructure development boosted neon gas manufacturing capabilities |
| 2024 | 4.6% | Manufacturing investments in medical equipment boosted neon gas demand |
| 2025 | 4.5% | Modernized gas extraction technologies boost Nepal's neon production capacity |
| 2026 | 4.6% | Capacity utilization enhancements boosted neon gas production efficiency |
| 2027 | 4.5% | Export contracts for neon gas boost local production capacity |
| 2028 | 5.1% | Manufacturing investments in local neon gas production boost supply stability |
| 2029 | 5.0% | Increased domestic infrastructure projects boost neon gas production capacity |
| 2030 | 4.7% | Adoption of advanced welding technology boosts neon sign production efficiency |
| 2031 | 4.7% | Increased gas extraction capacity boosts neon supply reliability |
| 2032 | 4.6% | Advanced welding technology adoption boosts neon gas production efficiency |
Note - Market size estimations and growth projections presented in this report are based on 6Wresearch’s advanced forecasting approach, validated with industry datasets as of June 2026.
Nepal Neon Gas Market Synopsis
The demand for neon gas in Nepal is increasingly driven by its essential applications in the healthcare sector, particularly for MRI machines and neonatal care. This growing sector is a significant contributor to the overall increase in neon gas consumption, showcasing the crucial role of this industrial gas in enhancing medical technologies.
Moreover, neon gas continues to be the preferred choice for vibrant signage and decorative lighting, particularly in urban areas where aesthetic appeal is key. As public interest in unique lighting solutions and neon-themed events rises, the demand for neon gas in the entertainment and advertising industries remains robust.
Nepal Neon Gas Market Key Takeaways
- The market is projected to grow steadily due to rising demand from healthcare and electronics sectors.
- Neon gas applications in signage and lighting continue to thrive despite competition from LED technologies.
- Regulatory frameworks are shaping the market by ensuring quality and environmental standards.
- Investment opportunities abound, particularly in production and distribution infrastructures.
- Public awareness and market education are essential to tap into untapped consumer segments.
Evaluation of Restraints in Nepal Neon Gas Market
The Nepal Neon Gas Market faces several constraints that can hinder its growth trajectory. A limited number of high-quality suppliers restricts availability, making it challenging for businesses to maintain consistent operations. Furthermore, fluctuations in pricing, primarily due to dependency on imports, can create instability in market conditions. The relatively small market size compared to more developed nations results in higher operational costs and limited economies of scale. Additionally, there is a noticeable gap in consumer awareness regarding the applications and benefits of neon gas, which necessitates targeted marketing efforts to educate potential users.
Nepal Neon Gas Market Trends
Current trends in the Nepal Neon Gas Market include an increasing acceptance of neon signage in both commercial and residential settings. This trend is driven by a resurgence of retro aesthetics and a preference for unique visual expressions. Moreover, the entertainment industry is witnessing a rise in neon-themed events, further fueling demand for neon gas. Technological innovations, such as improved gas purity and more efficient production methods, are also emerging, catering to an industry increasingly focused on sustainability.
Nepal Neon Gas Market Opportunities
The future of the Nepal Neon Gas Market is rich with investment opportunities. With the healthcare sector's ongoing expansion and a rising trend for distinctive signage, investors can capitalize on production facilities and distribution networks tailored to these needs. Collaborating with academic institutions to explore new applications for neon gas, particularly in renewable energy technologies, presents a promising avenue for innovation. As the market evolves, there is a clear potential for companies to establish a strong foothold through strategic partnerships and innovative offerings.
Government Initiatives in the Nepal Neon Gas Market
The Nepalese government is actively regulating the neon gas market to ensure quality and safety standards are upheld. The Department of Commerce, Supplies and Consumer Protection enforces strict guidelines for production and distribution, focusing on preventing illegal imports and promoting ethical business practices. Furthermore, the government is implementing environmental regulations concerning the disposal of neon gas cylinders, aiming to mitigate any adverse impacts on the environment. Such initiatives are integral in fostering a well-regulated and sustainable market environment.
Future Insights of the Nepal Neon Gas Market
Looking ahead to 2026-2032, the Nepal Neon Gas Market is poised for optimistic growth. Increasing applications of neon gas across various sectors, driven by technological advancements and a cultural shift towards unique aesthetic solutions, will continue to energize demand. Government initiatives promoting clean energy and sustainability are expected to open new pathways for market expansion. As industries evolve and consumer preferences shift, companies that focus on innovation and adaptability will likely thrive in this dynamic landscape.
Nepal Neon Gas Market Latest Developments (May 2025 - June 2026)
Recent developments in the Nepal Neon Gas Market indicate a strong alignment with global trends towards sustainability and innovation. Companies are investing in advanced production technologies to enhance purity and efficiency, reflecting a commitment to quality. Additionally, there is an observable increase in collaborations between local businesses and international partners, aimed at expanding the market footprint and exploring innovative applications for neon gas.
Nepal Neon Gas Market - Key Attractiveness of the Report
- 10 Years of Market Numbers
- Historical Data Starting from 2022 to 2025
- Base Year: 2025
- Forecast Data until 2032
- Key Performance Indicators Impacting the Market
- Major Upcoming Developments and Projects
Key Highlights of the Report:
- Nepal Neon Gas Market Outlook
- Market Size of Nepal Neon Gas Market, 2025
- Forecast of Nepal Neon Gas Market, 2032
- Historical Data and Forecast of Nepal Neon Gas Revenues & Volume for the Period 2022-2032F
- Nepal Neon Gas Market Trend Evolution
- Nepal Neon Gas Market Drivers and Challenges
- Nepal Neon Gas Price Trends
- Nepal Neon Gas Porter's Five Forces
- Nepal Neon Gas Industry Life Cycle
- Historical Data and Forecast of Nepal Neon Gas Market Revenues & Volume By Type for the Period 2022-2032F
- Historical Data and Forecast of Nepal Neon Gas Market Revenues & Volume By Low for the Period 2022-2032F
- Historical Data and Forecast of Nepal Neon Gas Market Revenues & Volume By High for the Period 2022-2032F
- Historical Data and Forecast of Nepal Neon Gas Market Revenues & Volume By Ultra High for the Period 2022-2032F
- Historical Data and Forecast of Nepal Neon Gas Market Revenues & Volume By Application for the Period 2022-2032F
- Historical Data and Forecast of Nepal Neon Gas Market Revenues & Volume By Semiconductor for the Period 2022-2032F
- Historical Data and Forecast of Nepal Neon Gas Market Revenues & Volume By LCD for the Period 2022-2032F
- Historical Data and Forecast of Nepal Neon Gas Market Revenues & Volume By Imaging and Lighting for the Period 2022-2032F
- Historical Data and Forecast of Nepal Neon Gas Market Revenues & Volume By Refrigerator for the Period 2022-2032F
- Historical Data and Forecast of Nepal Neon Gas Market Revenues & Volume By Laser for the Period 2022-2032F
- Historical Data and Forecast of Nepal Neon Gas Market Revenues & Volume By Medical for the Period 2022-2032F
- Historical Data and Forecast of Nepal Neon Gas Market Revenues & Volume By Others for the Period 2022-2032F
- Nepal Neon Gas Import Export Trade Statistics
- Market Opportunity Assessment By Type
- Market Opportunity Assessment By Application
- Nepal Neon Gas Top Companies Market Share
- Nepal Neon Gas Competitive Benchmarking By Technical and Operational Parameters
- Nepal Neon Gas Company Profiles
- Nepal Neon Gas Key Strategic Recommendations
Nepal Neon Gas Market - Frequently Asked Questions
The growth is driven by rising demand from healthcare applications, particularly in medical imaging, along with the increasing popularity of neon signage in urban areas.
The Nepal Neon Gas Market was estimated at USD 443 Million in 2025 and is projected to reach USD 583 Million by 2032, growing at a CAGR of 4.0% from 2026 to 2032, reflecting a steady increase in demand across key sectors.
The market contends with limited availability of quality suppliers, regulatory hurdles, and the need for greater consumer awareness about the benefits of neon gas.
The Nepalese government has established regulations to ensure quality production and distribution of neon gas, along with environmental guidelines for safe disposal practices.
Investors can find lucrative opportunities in establishing production facilities and distribution networks, especially targeting the healthcare and lighting sectors where demand is growing steadily.
Despite the rise of LED technology, neon gas continues to hold a unique aesthetic appeal and brightness that attracts consumers, particularly in signage and decorative applications.
6Wresearch actively monitors the Nepal Neon Gas Market and publishes its comprehensive annual report, highlighting emerging trends, growth drivers, revenue analysis, and forecast outlook. Our insights help businesses to make data-backed strategic decisions with ongoing market dynamics. Our analysts track relevent industries related to the Nepal Neon Gas Market, allowing our clients with actionable intelligence and reliable forecasts tailored to emerging regional needs.
Yes, we provide customisation as per your requirements. To learn more, feel free to contact us on sales@6wresearch.com
1 Executive Summary |
2 Introduction |
2.1 Key Highlights of the Report |
2.2 Report Description |
2.3 Market Scope & Segmentation |
2.4 Research Methodology |
2.5 Assumptions |
3 Nepal Neon Gas Market Overview |
3.1 Nepal Country Macro Economic Indicators |
3.2 Nepal Neon Gas Market Revenues & Volume, 2022 & 2032F |
3.3 Nepal Neon Gas Market - Industry Life Cycle |
3.4 Nepal Neon Gas Market - Porter's Five Forces |
3.5 Nepal Neon Gas Market Revenues & Volume Share, By Type, 2022 & 2032F |
3.6 Nepal Neon Gas Market Revenues & Volume Share, By Form, 2022 & 2032F |
4 Nepal Neon Gas Market Dynamics |
4.1 Impact Analysis |
4.2 Market Drivers |
4.3 Market Restraints |
5 Nepal Neon Gas Market Trends |
6 Nepal Neon Gas Market, By Types |
6.1 Nepal Neon Gas Market, By Type |
6.1.1 Overview and Analysis |
6.1.2 Nepal Neon Gas Market Revenues & Volume, By Type, 2022-2032F |
6.1.3 Nepal Neon Gas Market Revenues & Volume, By Low, 2022-2032F |
6.1.4 Nepal Neon Gas Market Revenues & Volume, By High, 2022-2032F |
6.1.5 Nepal Neon Gas Market Revenues & Volume, By Ultra High, 2022-2032F |
6.2 Nepal Neon Gas Market, By Application |
6.2.1 Overview and Analysis |
6.2.2 Nepal Neon Gas Market Revenues & Volume, By Semiconductor, 2022-2032F |
6.2.3 Nepal Neon Gas Market Revenues & Volume, By LCD, 2022-2032F |
6.2.4 Nepal Neon Gas Market Revenues & Volume, By Imaging and Lighting, 2022-2032F |
6.2.5 Nepal Neon Gas Market Revenues & Volume, By Refrigerator, 2022-2032F |
6.2.6 Nepal Neon Gas Market Revenues & Volume, By Laser, 2022-2032F |
6.2.7 Nepal Neon Gas Market Revenues & Volume, By Medical, 2022-2032F |
7 Nepal Neon Gas Market Import-Export Trade Statistics |
7.1 Nepal Neon Gas Market Export to Major Countries |
7.2 Nepal Neon Gas Market Imports from Major Countries |
8 Nepal Neon Gas Market Key Performance Indicators |
9 Nepal Neon Gas Market - Opportunity Assessment |
9.1 Nepal Neon Gas Market Opportunity Assessment, By Type, 2022 & 2032F |
9.2 Nepal Neon Gas Market Opportunity Assessment, By Application, 2022 & 2032F |
10 Nepal Neon Gas Market - Competitive Landscape |
10.1 Nepal Neon Gas Market Revenue Share, By Companies, 2025 |
10.2 Nepal Neon Gas Market Competitive Benchmarking, By Operating and Technical Parameters |
11 Company Profiles |
12 Recommendations |
13 Disclaimer |
Global Go To Market Strategy - 2030
Export potential enables firms to identify high-growth global markets with greater confidence by combining advanced trade intelligence with a structured quantitative methodology. The framework analyzes emerging demand trends and country-level import patterns while integrating macroeconomic and trade datasets such as GDP and population forecasts, bilateral import–export flows, tariff structures, elasticity differentials between developed and developing economies, geographic distance, and import demand projections. Using weighted trade values from 2020–2024 as the base period to project country-to-country export potential for 2030, these inputs are operationalized through calculated drivers such as gravity model parameters, tariff impact factors, and projected GDP per-capita growth. Through an analysis of hidden potentials, demand hotspots, and market conditions that are most favorable to success, this method enables firms to focus on target countries, maximize returns, and global expansion with data, backed by accuracy.
By factoring in the projected importer demand gap that is currently unmet and could be potential opportunity, it identifies the potential for the Exporter (Country) among 190 countries, against the general trade analysis, which identifies the biggest importer or exporter.
To discover high-growth global markets and optimize your business strategy:
Click Here
Pricing
- Single User License$ 1,995
- Department License$ 2,400
- Site License$ 3,120
- Global License$ 3,795

Leadership Perspectives from Industry Events
Search
Thought Leadership and Analyst Meet


Our Clients
6WResearch In News
- India Air Conditioner Market Set for Strong Rebound in 2026 After Weather-Led Correction and GST-Driven Recovery: 6Wresearch
- ADAS in India: How Automatic Emergency Braking, Blind Spot Detection & Driver Monitoring are Transforming Road Safety
- Doha a strategic location for EV manufacturing hub: IPA Qatar
- Demand for luxury TVs surging in the GCC, says Samsung
- Empowering Growth: The Thriving Journey of Bangladesh’s Cable Industry
- Demand for luxury TVs surging in the GCC, says Samsung
Latest Reports
- Poland Fire Protection Systems Market (2026-2032)
- Cape Verde Portable Hand-Thrown Extinguisher Market (2026-2032)
- Canada Portable Hand-Thrown Extinguisher Market (2026-2032)
- Cameroon Portable Hand-Thrown Extinguisher Market (2026-2032)
- Burundi Portable Hand-Thrown Extinguisher Market (2026-2032)
- Burkina Faso Portable Hand-Thrown Extinguisher Market (2026-2032)
- Bulgaria Portable Hand-Thrown Extinguisher Market (2026-2032)
- Brunei Portable Hand-Thrown Extinguisher Market (2026-2032)
- Botswana Portable Hand-Thrown Extinguisher Market (2026-2032)
- Bosnia and Herzegovina Portable Hand-Thrown Extinguisher Market (2026-2032)
Industry Events and Analyst Meet

HIMTEX 2026

India Refining Summit 2026

India EV Show 2026

EV tech India Expo 2026

Auto Tech Asia 2026
Whitepaper
- Middle East & Africa Commercial Security Market Click here to view more.
- Middle East & Africa Fire Safety Systems & Equipment Market Click here to view more.
- GCC Drone Market Click here to view more.
- Middle East Lighting Fixture Market Click here to view more.
- GCC Physical & Perimeter Security Market Click here to view more.