Netherlands Automotive Scroll E-Compressor Market (2026-2032) | Competitive Landscape, Trends, Segmentation, Forecast, Companies, Value, Share, Size & Revenue, Outlook, Industry, Growth, Analysis
Market Forecast By Sales Channel (OEM, Aftermarket), By Vehicle Type (Passenger Vehicle, Light Duty Vehicle, Medium & Heavy Duty Trucks, Buses & Coach), By Cooling Capacity (Less than 20 CC, 20 to 40 CC, More than 40 CC), By Material (Steel, Aluminum, Others) And Competitive Landscape
| Product Code: ETC8532704 | Publication Date: Sep 2024 | Updated Date: Apr 2026 | Product Type: Market Research Report | |
| Publisher: 6Wresearch | Author: Sumit Sagar | No. of Pages: 75 | No. of Figures: 35 | No. of Tables: 20 |
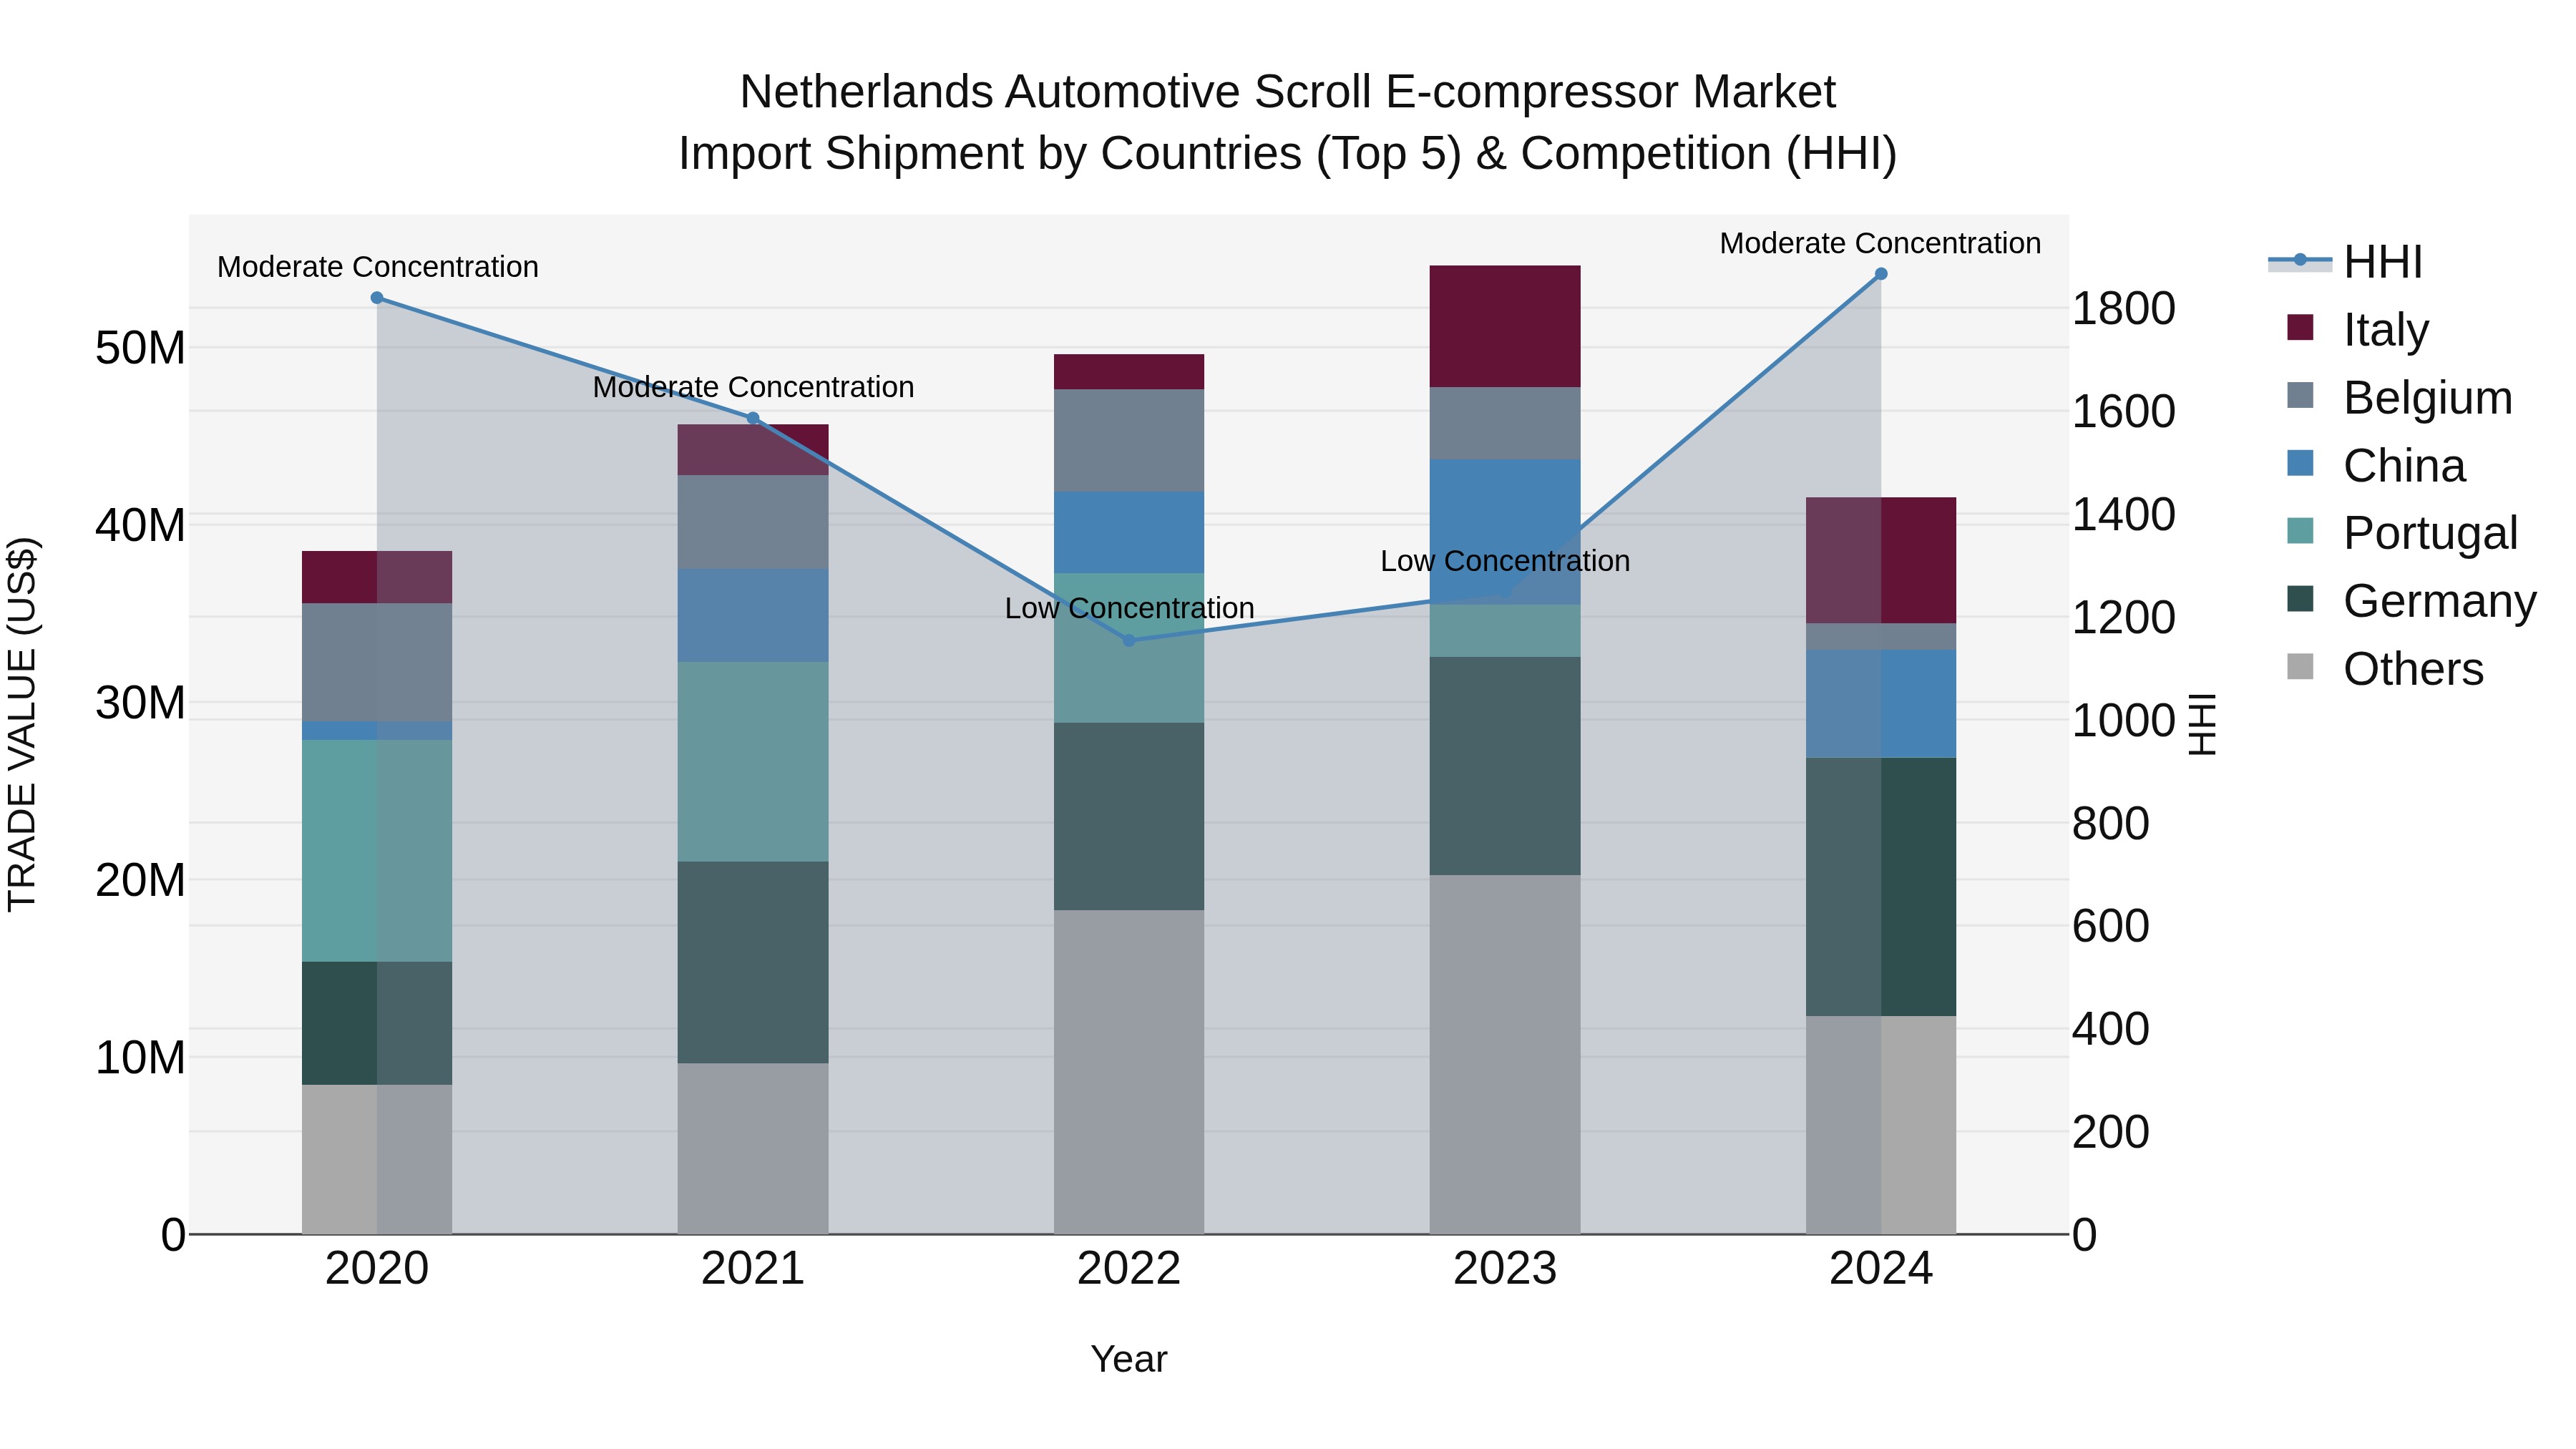
Netherlands Automotive Scroll E-compressor Market Top 5 Importing Countries and Market Competition (HHI) Analysis
In 2024, the Netherlands saw an increase in import shipments of automotive scroll e-compressors, with top exporting countries being Germany, Italy, China, Metropolitan France, and the USA. The market displayed a shift from low to moderate concentration, indicating evolving dynamics. Despite a modest CAGR of 1.91% from 2020 to 2024, there was a sharp decline in growth rate by -23.9% from 2023 to 2024. This fluctuation suggests a challenging landscape with potential changes in market behavior and competition dynamics that importers and stakeholders should closely monitor.
Key Highlights of the Report:
- Netherlands Automotive Scroll E-Compressor Market Outlook
- Market Size of Netherlands Automotive Scroll E-Compressor Market, 2025
- Forecast of Netherlands Automotive Scroll E-Compressor Market, 2032
- Historical Data and Forecast of Netherlands Automotive Scroll E-Compressor Revenues & Volume for the Period 2022 - 2032
- Netherlands Automotive Scroll E-Compressor Market Trend Evolution
- Netherlands Automotive Scroll E-Compressor Market Drivers and Challenges
- Netherlands Automotive Scroll E-Compressor Price Trends
- Netherlands Automotive Scroll E-Compressor Porter's Five Forces
- Netherlands Automotive Scroll E-Compressor Industry Life Cycle
- Historical Data and Forecast of Netherlands Automotive Scroll E-Compressor Market Revenues & Volume By Sales Channel for the Period 2022 - 2032
- Historical Data and Forecast of Netherlands Automotive Scroll E-Compressor Market Revenues & Volume By OEM for the Period 2022 - 2032
- Historical Data and Forecast of Netherlands Automotive Scroll E-Compressor Market Revenues & Volume By Aftermarket for the Period 2022 - 2032
- Historical Data and Forecast of Netherlands Automotive Scroll E-Compressor Market Revenues & Volume By Vehicle Type for the Period 2022 - 2032
- Historical Data and Forecast of Netherlands Automotive Scroll E-Compressor Market Revenues & Volume By Passenger Vehicle for the Period 2022 - 2032
- Historical Data and Forecast of Netherlands Automotive Scroll E-Compressor Market Revenues & Volume By Light Duty Vehicle for the Period 2022 - 2032
- Historical Data and Forecast of Netherlands Automotive Scroll E-Compressor Market Revenues & Volume By Medium & Heavy Duty Trucks for the Period 2022 - 2032
- Historical Data and Forecast of Netherlands Automotive Scroll E-Compressor Market Revenues & Volume By Buses & Coach for the Period 2022 - 2032
- Historical Data and Forecast of Netherlands Automotive Scroll E-Compressor Market Revenues & Volume By Cooling Capacity for the Period 2022 - 2032
- Historical Data and Forecast of Netherlands Automotive Scroll E-Compressor Market Revenues & Volume By Less than 20 CC for the Period 2022 - 2032
- Historical Data and Forecast of Netherlands Automotive Scroll E-Compressor Market Revenues & Volume By 20 to 40 CC for the Period 2022 - 2032
- Historical Data and Forecast of Netherlands Automotive Scroll E-Compressor Market Revenues & Volume By More than 40 CC for the Period 2022 - 2032
- Historical Data and Forecast of Netherlands Automotive Scroll E-Compressor Market Revenues & Volume By Material for the Period 2022 - 2032
- Historical Data and Forecast of Netherlands Automotive Scroll E-Compressor Market Revenues & Volume By Steel for the Period 2022 - 2032
- Historical Data and Forecast of Netherlands Automotive Scroll E-Compressor Market Revenues & Volume By Aluminum for the Period 2022 - 2032
- Historical Data and Forecast of Netherlands Automotive Scroll E-Compressor Market Revenues & Volume By Others for the Period 2022 - 2032
- Netherlands Automotive Scroll E-Compressor Import Export Trade Statistics
- Market Opportunity Assessment By Sales Channel
- Market Opportunity Assessment By Vehicle Type
- Market Opportunity Assessment By Cooling Capacity
- Market Opportunity Assessment By Material
- Netherlands Automotive Scroll E-Compressor Top Companies Market Share
- Netherlands Automotive Scroll E-Compressor Competitive Benchmarking By Technical and Operational Parameters
- Netherlands Automotive Scroll E-Compressor Company Profiles
- Netherlands Automotive Scroll E-Compressor Key Strategic Recommendations
Frequently Asked Questions About the Market Study (FAQs):
6Wresearch actively monitors the Netherlands Automotive Scroll E-Compressor Market and publishes its comprehensive annual report, highlighting emerging trends, growth drivers, revenue analysis, and forecast outlook. Our insights help businesses to make data-backed strategic decisions with ongoing market dynamics. Our analysts track relevent industries related to the Netherlands Automotive Scroll E-Compressor Market, allowing our clients with actionable intelligence and reliable forecasts tailored to emerging regional needs.
Yes, we provide customisation as per your requirements. To learn more, feel free to contact us on sales@6wresearch.com
1 Executive Summary |
2 Introduction |
2.1 Key Highlights of the Report |
2.2 Report Description |
2.3 Market Scope & Segmentation |
2.4 Research Methodology |
2.5 Assumptions |
3 Netherlands Automotive Scroll E-Compressor Market Overview |
3.1 Netherlands Country Macro Economic Indicators |
3.2 Netherlands Automotive Scroll E-Compressor Market Revenues & Volume, 2022 & 2032F |
3.3 Netherlands Automotive Scroll E-Compressor Market - Industry Life Cycle |
3.4 Netherlands Automotive Scroll E-Compressor Market - Porter's Five Forces |
3.5 Netherlands Automotive Scroll E-Compressor Market Revenues & Volume Share, By Sales Channel, 2022 & 2032F |
3.6 Netherlands Automotive Scroll E-Compressor Market Revenues & Volume Share, By Vehicle Type, 2022 & 2032F |
3.7 Netherlands Automotive Scroll E-Compressor Market Revenues & Volume Share, By Cooling Capacity, 2022 & 2032F |
3.8 Netherlands Automotive Scroll E-Compressor Market Revenues & Volume Share, By Material, 2022 & 2032F |
4 Netherlands Automotive Scroll E-Compressor Market Dynamics |
4.1 Impact Analysis |
4.2 Market Drivers |
4.2.1 Growing demand for energy-efficient automotive scroll e-compressors |
4.2.2 Increasing focus on reducing carbon emissions in the automotive industry |
4.2.3 Technological advancements leading to improved performance and reliability of scroll e-compressors |
4.3 Market Restraints |
4.3.1 High initial investment costs for adopting automotive scroll e-compressors |
4.3.2 Limited infrastructure and charging stations for electric vehicles in the Netherlands |
5 Netherlands Automotive Scroll E-Compressor Market Trends |
6 Netherlands Automotive Scroll E-Compressor Market, By Types |
6.1 Netherlands Automotive Scroll E-Compressor Market, By Sales Channel |
6.1.1 Overview and Analysis |
6.1.2 Netherlands Automotive Scroll E-Compressor Market Revenues & Volume, By Sales Channel, 2022 - 2032F |
6.1.3 Netherlands Automotive Scroll E-Compressor Market Revenues & Volume, By OEM, 2022 - 2032F |
6.1.4 Netherlands Automotive Scroll E-Compressor Market Revenues & Volume, By Aftermarket, 2022 - 2032F |
6.2 Netherlands Automotive Scroll E-Compressor Market, By Vehicle Type |
6.2.1 Overview and Analysis |
6.2.2 Netherlands Automotive Scroll E-Compressor Market Revenues & Volume, By Passenger Vehicle, 2022 - 2032F |
6.2.3 Netherlands Automotive Scroll E-Compressor Market Revenues & Volume, By Light Duty Vehicle, 2022 - 2032F |
6.2.4 Netherlands Automotive Scroll E-Compressor Market Revenues & Volume, By Medium & Heavy Duty Trucks, 2022 - 2032F |
6.2.5 Netherlands Automotive Scroll E-Compressor Market Revenues & Volume, By Buses & Coach, 2022 - 2032F |
6.3 Netherlands Automotive Scroll E-Compressor Market, By Cooling Capacity |
6.3.1 Overview and Analysis |
6.3.2 Netherlands Automotive Scroll E-Compressor Market Revenues & Volume, By Less than 20 CC, 2022 - 2032F |
6.3.3 Netherlands Automotive Scroll E-Compressor Market Revenues & Volume, By 20 to 40 CC, 2022 - 2032F |
6.3.4 Netherlands Automotive Scroll E-Compressor Market Revenues & Volume, By More than 40 CC, 2022 - 2032F |
6.4 Netherlands Automotive Scroll E-Compressor Market, By Material |
6.4.1 Overview and Analysis |
6.4.2 Netherlands Automotive Scroll E-Compressor Market Revenues & Volume, By Steel, 2022 - 2032F |
6.4.3 Netherlands Automotive Scroll E-Compressor Market Revenues & Volume, By Aluminum, 2022 - 2032F |
6.4.4 Netherlands Automotive Scroll E-Compressor Market Revenues & Volume, By Others, 2022 - 2032F |
7 Netherlands Automotive Scroll E-Compressor Market Import-Export Trade Statistics |
7.1 Netherlands Automotive Scroll E-Compressor Market Export to Major Countries |
7.2 Netherlands Automotive Scroll E-Compressor Market Imports from Major Countries |
8 Netherlands Automotive Scroll E-Compressor Market Key Performance Indicators |
8.1 Percentage of automotive manufacturers in the Netherlands using scroll e-compressors in their vehicles |
8.2 Adoption rate of energy-efficient automotive scroll e-compressors in new vehicle models |
8.3 Number of government incentives and subsidies promoting the use of eco-friendly automotive technologies |
9 Netherlands Automotive Scroll E-Compressor Market - Opportunity Assessment |
9.1 Netherlands Automotive Scroll E-Compressor Market Opportunity Assessment, By Sales Channel, 2022 & 2032F |
9.2 Netherlands Automotive Scroll E-Compressor Market Opportunity Assessment, By Vehicle Type, 2022 & 2032F |
9.3 Netherlands Automotive Scroll E-Compressor Market Opportunity Assessment, By Cooling Capacity, 2022 & 2032F |
9.4 Netherlands Automotive Scroll E-Compressor Market Opportunity Assessment, By Material, 2022 & 2032F |
10 Netherlands Automotive Scroll E-Compressor Market - Competitive Landscape |
10.1 Netherlands Automotive Scroll E-Compressor Market Revenue Share, By Companies, 2025 |
10.2 Netherlands Automotive Scroll E-Compressor Market Competitive Benchmarking, By Operating and Technical Parameters |
11 Company Profiles |
12 Recommendations |
13 Disclaimer |
Global Go To Market Strategy - 2030
Export potential enables firms to identify high-growth global markets with greater confidence by combining advanced trade intelligence with a structured quantitative methodology. The framework analyzes emerging demand trends and country-level import patterns while integrating macroeconomic and trade datasets such as GDP and population forecasts, bilateral import–export flows, tariff structures, elasticity differentials between developed and developing economies, geographic distance, and import demand projections. Using weighted trade values from 2020–2024 as the base period to project country-to-country export potential for 2030, these inputs are operationalized through calculated drivers such as gravity model parameters, tariff impact factors, and projected GDP per-capita growth. Through an analysis of hidden potentials, demand hotspots, and market conditions that are most favorable to success, this method enables firms to focus on target countries, maximize returns, and global expansion with data, backed by accuracy.
By factoring in the projected importer demand gap that is currently unmet and could be potential opportunity, it identifies the potential for the Exporter (Country) among 190 countries, against the general trade analysis, which identifies the biggest importer or exporter.
To discover high-growth global markets and optimize your business strategy:
Click Here
Pricing
- Single User License$ 1,995
- Department License$ 2,400
- Site License$ 3,120
- Global License$ 3,795

Leadership Perspectives from Industry Events
Search
Thought Leadership and Analyst Meet


Our Clients
6WResearch In News
- Doha a strategic location for EV manufacturing hub: IPA Qatar
- Demand for luxury TVs surging in the GCC, says Samsung
- Empowering Growth: The Thriving Journey of Bangladesh’s Cable Industry
- Demand for luxury TVs surging in the GCC, says Samsung
- Video call with a traditional healer? Once unthinkable, it’s now common in South Africa
- Intelligent Buildings To Smooth GCC’s Path To Net Zero
Latest Reports
- Cape Verde Portable Hand-Thrown Extinguisher Market (2026-2032)
- Canada Portable Hand-Thrown Extinguisher Market (2026-2032)
- Cameroon Portable Hand-Thrown Extinguisher Market (2026-2032)
- Burundi Portable Hand-Thrown Extinguisher Market (2026-2032)
- Burkina Faso Portable Hand-Thrown Extinguisher Market (2026-2032)
- Bulgaria Portable Hand-Thrown Extinguisher Market (2026-2032)
- Brunei Portable Hand-Thrown Extinguisher Market (2026-2032)
- Botswana Portable Hand-Thrown Extinguisher Market (2026-2032)
- Bosnia and Herzegovina Portable Hand-Thrown Extinguisher Market (2026-2032)
- Bolivia Portable Hand-Thrown Extinguisher Market (2026-2032)
Industry Events and Analyst Meet

HIMTEX 2026

India Refining Summit 2026

India EV Show 2026

EV tech India Expo 2026

Auto Tech Asia 2026
Whitepaper
- Middle East & Africa Commercial Security Market Click here to view more.
- Middle East & Africa Fire Safety Systems & Equipment Market Click here to view more.
- GCC Drone Market Click here to view more.
- Middle East Lighting Fixture Market Click here to view more.
- GCC Physical & Perimeter Security Market Click here to view more.