Netherlands Hoist Market (2026-2032) | Revenue, Size, Value, Forecast, Analysis, Share, Outlook, Segmentation, Trends, Companies, Growth & Industry
Market Forecast By Product Type (Planetary Gear, Worm Gear, Others), By Operation (Hydraulic, Electric, Pneumatic, Manual), By Hoist Rope (Chain Hoist, Wire or Rope Hoist), By Capacity (LBS) (Up to 1000 lbs, 1000 lbs to 2000 lbs, 2000 lbs to 4000 lbs, 4000 lbs to 6000 lbs, 6000 lbs to 8000 lbs, 8000 lbs to 10000 lbs, 10000 lbs to 12000 lbs, 12000 lbs to 16000 lbs), By Application (Commercial Recovery, Cranes, Fixed Cranes, Mobile Cranes, Workboats, Utility, Others (Military recovery, Stage maker, etc.)), By End-use (Automotive & Railway, Aerospace & Defense, Transportation & Logistics, Construction, Shipping & Marine, Material Handling, Agriculture & Forestry, Mining), By Distribution Channel (Direct Sales, Indirect Sales) And Competitive Landscape
| Product Code: ETC5400808 | Publication Date: Nov 2023 | Updated Date: Apr 2026 | Product Type: Market Research Report | |
| Publisher: 6Wresearch | Author: Ravi Bhandari | No. of Pages: 60 | No. of Figures: 30 | No. of Tables: 5 |
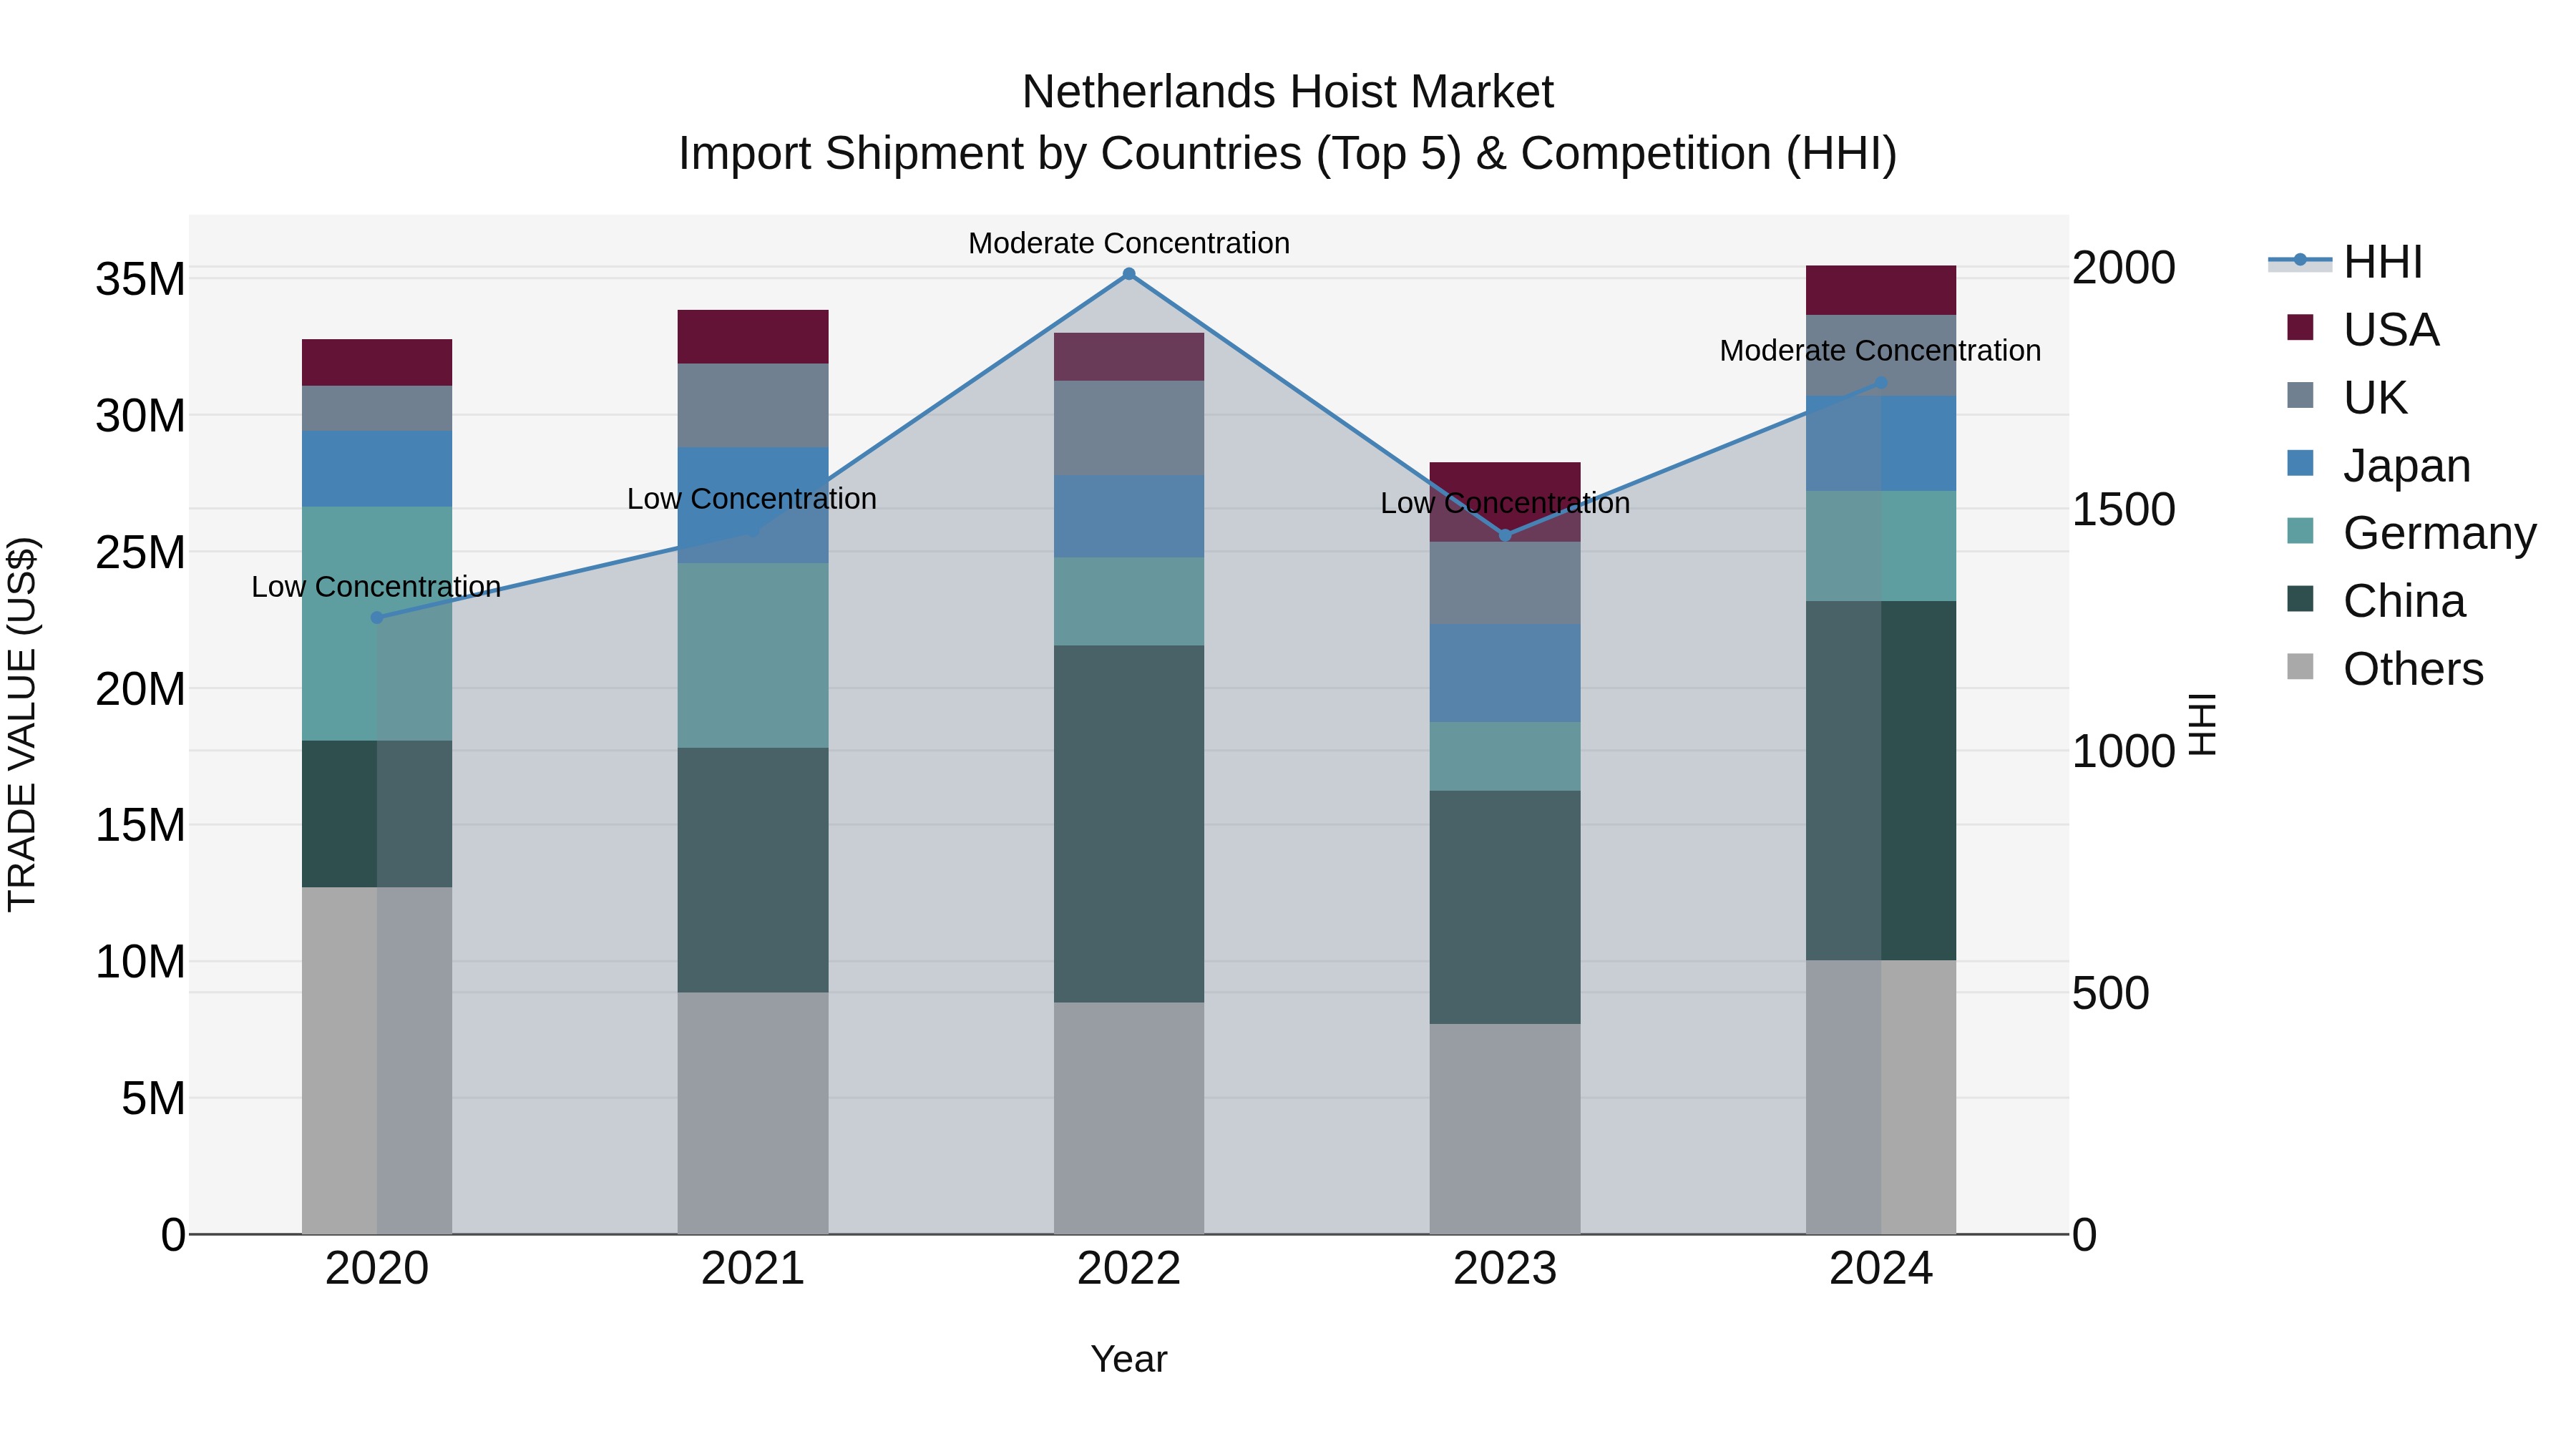
Netherlands Hoist Market Top 5 Importing Countries and Market Competition (HHI) Analysis
In 2024, Netherlands saw a notable increase in hoist import shipments, with top exporters including China, Germany, Japan, UK, and USA. The market demonstrated a shift from low to moderate concentration, indicating a more balanced competitive landscape. The compound annual growth rate (CAGR) from 2020 to 2024 stood at 2.0%, while the growth rate from 2023 to 2024 surged to an impressive 25.45%. These figures suggest a growing demand for hoists in the Netherlands market, with diverse import sources contributing to the sector`s development.
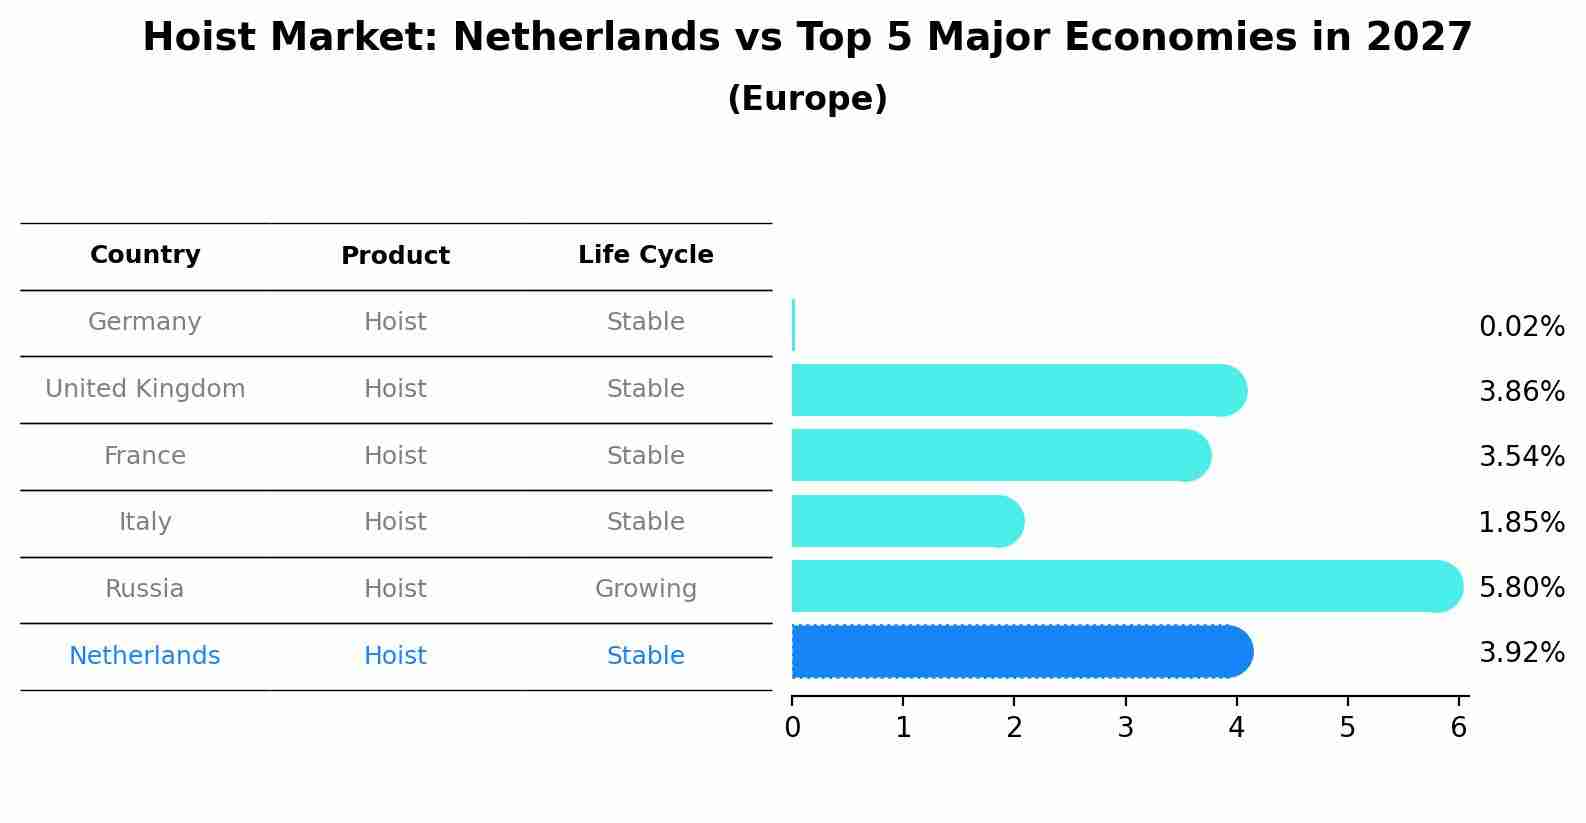
Hoist Market: Netherlands vs Top 5 Major Economies in 2027 (Europe)
The Hoist market in Netherlands is projected to grow at a stable growth rate of 3.92% by 2027, within the Europe region led by Germany, along with other countries like United Kingdom, France, Italy and Russia, collectively shaping a dynamic and evolving market environment driven by innovation and increasing adoption of emerging technologies.
Key Highlights of the Report:
- Netherlands Hoist Market Outlook
- Market Size of Netherlands Hoist Market, 2025
- Forecast of Netherlands Hoist Market, 2032
- Historical Data and Forecast of Netherlands Hoist Revenues & Volume for the Period 2022 - 2032F
- Netherlands Hoist Market Trend Evolution
- Netherlands Hoist Market Drivers and Challenges
- Netherlands Hoist Price Trends
- Netherlands Hoist Porter`s Five Forces
- Netherlands Hoist Industry Life Cycle
- Historical Data and Forecast of Netherlands Hoist Market Revenues & Volume By Product Type for the Period 2022 - 2032F
- Historical Data and Forecast of Netherlands Hoist Market Revenues & Volume By Planetary Gear for the Period 2022 - 2032F
- Historical Data and Forecast of Netherlands Hoist Market Revenues & Volume By Worm Gear for the Period 2022 - 2032F
- Historical Data and Forecast of Netherlands Hoist Market Revenues & Volume By Others for the Period 2022 - 2032F
- Historical Data and Forecast of Netherlands Hoist Market Revenues & Volume By Operation for the Period 2022 - 2032F
- Historical Data and Forecast of Netherlands Hoist Market Revenues & Volume By Hydraulic for the Period 2022 - 2032F
- Historical Data and Forecast of Netherlands Hoist Market Revenues & Volume By Electric for the Period 2022 - 2032F
- Historical Data and Forecast of Netherlands Hoist Market Revenues & Volume By Pneumatic for the Period 2022 - 2032F
- Historical Data and Forecast of Netherlands Hoist Market Revenues & Volume By Manual for the Period 2022 - 2032F
- Historical Data and Forecast of Netherlands Hoist Market Revenues & Volume By Hoist Rope for the Period 2022 - 2032F
- Historical Data and Forecast of Netherlands Hoist Market Revenues & Volume By Chain Hoist for the Period 2022 - 2032F
- Historical Data and Forecast of Netherlands Hoist Market Revenues & Volume By Wire or Rope Hoist for the Period 2022 - 2032F
- Historical Data and Forecast of Netherlands Hoist Market Revenues & Volume By Capacity (LBS) for the Period 2022 - 2032F
- Historical Data and Forecast of Netherlands Hoist Market Revenues & Volume By Up to 1000 lbs for the Period 2022 - 2032F
- Historical Data and Forecast of Netherlands Hoist Market Revenues & Volume By 1000 lbs to 2000 lbs for the Period 2022 - 2032F
- Historical Data and Forecast of Netherlands Hoist Market Revenues & Volume By 2000 lbs to 4000 lbs for the Period 2022 - 2032F
- Historical Data and Forecast of Netherlands Hoist Market Revenues & Volume By 4000 lbs to 6000 lbs for the Period 2022 - 2032F
- Historical Data and Forecast of Netherlands Hoist Market Revenues & Volume By 6000 lbs to 8000 lbs for the Period 2022 - 2032F
- Historical Data and Forecast of Netherlands Hoist Market Revenues & Volume By 8000 lbs to 10000 lbs for the Period 2022 - 2032F
- Historical Data and Forecast of Netherlands Hoist Market Revenues & Volume By 10000 lbs to 12000 lbs for the Period 2022 - 2032F
- Historical Data and Forecast of Netherlands Hoist Market Revenues & Volume By 12000 lbs to 16000 lbs for the Period 2022 - 2032F
- Historical Data and Forecast of Netherlands Hoist Market Revenues & Volume By Application for the Period 2022 - 2032F
- Historical Data and Forecast of Netherlands Hoist Market Revenues & Volume By Commercial Recovery for the Period 2022 - 2032F
- Historical Data and Forecast of Netherlands Hoist Market Revenues & Volume By Cranes for the Period 2022 - 2032F
- Historical Data and Forecast of Netherlands Hoist Market Revenues & Volume By Fixed Cranes for the Period 2022 - 2032F
- Historical Data and Forecast of Netherlands Hoist Market Revenues & Volume By Mobile Cranes for the Period 2022 - 2032F
- Historical Data and Forecast of Netherlands Hoist Market Revenues & Volume By Workboats for the Period 2022 - 2032F
- Historical Data and Forecast of Netherlands Hoist Market Revenues & Volume By Utility for the Period 2022 - 2032F
- Historical Data and Forecast of Netherlands Hoist Market Revenues & Volume By Others (Military recovery, Stage maker, etc.) for the Period 2022 - 2032F
- Historical Data and Forecast of Netherlands Hoist Market Revenues & Volume By End-use for the Period 2022 - 2032F
- Historical Data and Forecast of Netherlands Hoist Market Revenues & Volume By Automotive & Railway for the Period 2022 - 2032F
- Historical Data and Forecast of Netherlands Hoist Market Revenues & Volume By Aerospace & Defense for the Period 2022 - 2032F
- Historical Data and Forecast of Netherlands Hoist Market Revenues & Volume By Transportation & Logistics for the Period 2022 - 2032F
- Historical Data and Forecast of Netherlands Hoist Market Revenues & Volume By Construction for the Period 2022 - 2032F
- Historical Data and Forecast of Netherlands Hoist Market Revenues & Volume By Shipping & Marine for the Period 2022 - 2032F
- Historical Data and Forecast of Netherlands Hoist Market Revenues & Volume By Material Handling for the Period 2022 - 2032F
- Historical Data and Forecast of Netherlands Hoist Market Revenues & Volume By Agriculture & Forestry for the Period 2022 - 2032F
- Historical Data and Forecast of Netherlands Hoist Market Revenues & Volume By Mining for the Period 2022 - 2032F
- Historical Data and Forecast of Netherlands Hoist Market Revenues & Volume By Distribution Channel for the Period 2022 - 2032F
- Historical Data and Forecast of Netherlands Hoist Market Revenues & Volume By Direct Sales for the Period 2022 - 2032F
- Historical Data and Forecast of Netherlands Hoist Market Revenues & Volume By Indirect Sales for the Period 2022 - 2032F
- Netherlands Hoist Import Export Trade Statistics
- Market Opportunity Assessment By Product Type
- Market Opportunity Assessment By Operation
- Market Opportunity Assessment By Hoist Rope
- Market Opportunity Assessment By Capacity (LBS)
- Market Opportunity Assessment By Application
- Market Opportunity Assessment By End-use
- Market Opportunity Assessment By Distribution Channel
- Netherlands Hoist Top Companies Market Share
- Netherlands Hoist Competitive Benchmarking By Technical and Operational Parameters
- Netherlands Hoist Company Profiles
- Netherlands Hoist Key Strategic Recommendations
Frequently Asked Questions About the Market Study (FAQs):
6Wresearch actively monitors the Netherlands Hoist Market and publishes its comprehensive annual report, highlighting emerging trends, growth drivers, revenue analysis, and forecast outlook. Our insights help businesses to make data-backed strategic decisions with ongoing market dynamics. Our analysts track relevent industries related to the Netherlands Hoist Market, allowing our clients with actionable intelligence and reliable forecasts tailored to emerging regional needs.
Yes, we provide customisation as per your requirements. To learn more, feel free to contact us on sales@6wresearch.com
1 Executive Summary |
2 Introduction |
2.1 Key Highlights of the Report |
2.2 Report Description |
2.3 Market Scope & Segmentation |
2.4 Research Methodology |
2.5 Assumptions |
3 Netherlands Hoist Market Overview |
3.1 Netherlands Country Macro Economic Indicators |
3.2 Netherlands Hoist Market Revenues & Volume, 2022 & 2032F |
3.3 Netherlands Hoist Market - Industry Life Cycle |
3.4 Netherlands Hoist Market - Porter's Five Forces |
3.5 Netherlands Hoist Market Revenues & Volume Share, By Product Type, 2022 & 2032F |
3.6 Netherlands Hoist Market Revenues & Volume Share, By Operation, 2022 & 2032F |
3.7 Netherlands Hoist Market Revenues & Volume Share, By Hoist Rope, 2022 & 2032F |
3.8 Netherlands Hoist Market Revenues & Volume Share, By Capacity (LBS), 2022 & 2032F |
3.9 Netherlands Hoist Market Revenues & Volume Share, By Application, 2022 & 2032F |
3.10 Netherlands Hoist Market Revenues & Volume Share, By End-use, 2022 & 2032F |
3.11 Netherlands Hoist Market Revenues & Volume Share, By Distribution Channel, 2022 & 2032F |
4 Netherlands Hoist Market Dynamics |
4.1 Impact Analysis |
4.2 Market Drivers |
4.2.1 Growth in the construction industry in the Netherlands, leading to increased demand for hoists. |
4.2.2 Emphasis on workplace safety regulations, driving the adoption of hoists for lifting heavy materials. |
4.2.3 Technological advancements in hoist systems, making them more efficient and safer. |
4.3 Market Restraints |
4.3.1 Economic fluctuations impacting construction projects and infrastructure development. |
4.3.2 Competition from alternative lifting equipment such as cranes and forklifts. |
5 Netherlands Hoist Market Trends |
6 Netherlands Hoist Market Segmentations |
6.1 Netherlands Hoist Market, By Product Type |
6.1.1 Overview and Analysis |
6.1.2 Netherlands Hoist Market Revenues & Volume, By Planetary Gear, 2022 - 2032F |
6.1.3 Netherlands Hoist Market Revenues & Volume, By Worm Gear, 2022 - 2032F |
6.1.4 Netherlands Hoist Market Revenues & Volume, By Others, 2022 - 2032F |
6.2 Netherlands Hoist Market, By Operation |
6.2.1 Overview and Analysis |
6.2.2 Netherlands Hoist Market Revenues & Volume, By Hydraulic, 2022 - 2032F |
6.2.3 Netherlands Hoist Market Revenues & Volume, By Electric, 2022 - 2032F |
6.2.4 Netherlands Hoist Market Revenues & Volume, By Pneumatic, 2022 - 2032F |
6.2.5 Netherlands Hoist Market Revenues & Volume, By Manual, 2022 - 2032F |
6.3 Netherlands Hoist Market, By Hoist Rope |
6.3.1 Overview and Analysis |
6.3.2 Netherlands Hoist Market Revenues & Volume, By Chain Hoist, 2022 - 2032F |
6.3.3 Netherlands Hoist Market Revenues & Volume, By Wire or Rope Hoist, 2022 - 2032F |
6.4 Netherlands Hoist Market, By Capacity (LBS) |
6.4.1 Overview and Analysis |
6.4.2 Netherlands Hoist Market Revenues & Volume, By Up to 1000 lbs, 2022 - 2032F |
6.4.3 Netherlands Hoist Market Revenues & Volume, By 1000 lbs to 2000 lbs, 2022 - 2032F |
6.4.4 Netherlands Hoist Market Revenues & Volume, By 2000 lbs to 4000 lbs, 2022 - 2032F |
6.4.5 Netherlands Hoist Market Revenues & Volume, By 4000 lbs to 6000 lbs, 2022 - 2032F |
6.4.6 Netherlands Hoist Market Revenues & Volume, By 6000 lbs to 8000 lbs, 2022 - 2032F |
6.4.7 Netherlands Hoist Market Revenues & Volume, By 8000 lbs to 10000 lbs, 2022 - 2032F |
6.4.8 Netherlands Hoist Market Revenues & Volume, By 12000 lbs to 16000 lbs, 2022 - 2032F |
6.4.9 Netherlands Hoist Market Revenues & Volume, By 12000 lbs to 16000 lbs, 2022 - 2032F |
6.5 Netherlands Hoist Market, By Application |
6.5.1 Overview and Analysis |
6.5.2 Netherlands Hoist Market Revenues & Volume, By Commercial Recovery, 2022 - 2032F |
6.5.3 Netherlands Hoist Market Revenues & Volume, By Cranes, 2022 - 2032F |
6.5.4 Netherlands Hoist Market Revenues & Volume, By Fixed Cranes, 2022 - 2032F |
6.5.5 Netherlands Hoist Market Revenues & Volume, By Mobile Cranes, 2022 - 2032F |
6.5.6 Netherlands Hoist Market Revenues & Volume, By Workboats, 2022 - 2032F |
6.5.7 Netherlands Hoist Market Revenues & Volume, By Utility, 2022 - 2032F |
6.6 Netherlands Hoist Market, By End-use |
6.6.1 Overview and Analysis |
6.6.2 Netherlands Hoist Market Revenues & Volume, By Automotive & Railway, 2022 - 2032F |
6.6.3 Netherlands Hoist Market Revenues & Volume, By Aerospace & Defense, 2022 - 2032F |
6.6.4 Netherlands Hoist Market Revenues & Volume, By Transportation & Logistics, 2022 - 2032F |
6.6.5 Netherlands Hoist Market Revenues & Volume, By Construction, 2022 - 2032F |
6.6.6 Netherlands Hoist Market Revenues & Volume, By Shipping & Marine, 2022 - 2032F |
6.6.7 Netherlands Hoist Market Revenues & Volume, By Material Handling, 2022 - 2032F |
6.6.8 Netherlands Hoist Market Revenues & Volume, By Mining, 2022 - 2032F |
6.6.9 Netherlands Hoist Market Revenues & Volume, By Mining, 2022 - 2032F |
6.7 Netherlands Hoist Market, By Distribution Channel |
6.7.1 Overview and Analysis |
6.7.2 Netherlands Hoist Market Revenues & Volume, By Direct Sales, 2022 - 2032F |
6.7.3 Netherlands Hoist Market Revenues & Volume, By Indirect Sales, 2022 - 2032F |
7 Netherlands Hoist Market Import-Export Trade Statistics |
7.1 Netherlands Hoist Market Export to Major Countries |
7.2 Netherlands Hoist Market Imports from Major Countries |
8 Netherlands Hoist Market Key Performance Indicators |
8.1 Number of construction permits issued in the Netherlands. |
8.2 Adoption rate of automated and smart hoist systems in the market. |
8.3 Number of workplace accidents related to manual lifting, indicating the need for hoist solutions. |
8.4 Investment in research and development for hoist technology advancements. |
9 Netherlands Hoist Market - Opportunity Assessment |
9.1 Netherlands Hoist Market Opportunity Assessment, By Product Type, 2022 & 2032F |
9.2 Netherlands Hoist Market Opportunity Assessment, By Operation, 2022 & 2032F |
9.3 Netherlands Hoist Market Opportunity Assessment, By Hoist Rope, 2022 & 2032F |
9.4 Netherlands Hoist Market Opportunity Assessment, By Capacity (LBS), 2022 & 2032F |
9.5 Netherlands Hoist Market Opportunity Assessment, By Application, 2022 & 2032F |
9.6 Netherlands Hoist Market Opportunity Assessment, By End-use, 2022 & 2032F |
9.7 Netherlands Hoist Market Opportunity Assessment, By Distribution Channel, 2022 & 2032F |
10 Netherlands Hoist Market - Competitive Landscape |
10.1 Netherlands Hoist Market Revenue Share, By Companies, 2025 |
10.2 Netherlands Hoist Market Competitive Benchmarking, By Operating and Technical Parameters |
11 Company Profiles |
12 Recommendations | 13 Disclaimer |
Global Go To Market Strategy - 2030
Export potential enables firms to identify high-growth global markets with greater confidence by combining advanced trade intelligence with a structured quantitative methodology. The framework analyzes emerging demand trends and country-level import patterns while integrating macroeconomic and trade datasets such as GDP and population forecasts, bilateral import–export flows, tariff structures, elasticity differentials between developed and developing economies, geographic distance, and import demand projections. Using weighted trade values from 2020–2024 as the base period to project country-to-country export potential for 2030, these inputs are operationalized through calculated drivers such as gravity model parameters, tariff impact factors, and projected GDP per-capita growth. Through an analysis of hidden potentials, demand hotspots, and market conditions that are most favorable to success, this method enables firms to focus on target countries, maximize returns, and global expansion with data, backed by accuracy.
By factoring in the projected importer demand gap that is currently unmet and could be potential opportunity, it identifies the potential for the Exporter (Country) among 190 countries, against the general trade analysis, which identifies the biggest importer or exporter.
To discover high-growth global markets and optimize your business strategy:
Click Here
Pricing
- Single User License$ 1,995
- Department License$ 2,400
- Site License$ 3,120
- Global License$ 3,795

Leadership Perspectives from Industry Events
Search
Thought Leadership and Analyst Meet


Our Clients
6WResearch In News
- India Air Conditioner Market Set for Strong Rebound in 2026 After Weather-Led Correction and GST-Driven Recovery: 6Wresearch
- ADAS in India: How Automatic Emergency Braking, Blind Spot Detection & Driver Monitoring are Transforming Road Safety
- Doha a strategic location for EV manufacturing hub: IPA Qatar
- Demand for luxury TVs surging in the GCC, says Samsung
- Empowering Growth: The Thriving Journey of Bangladesh’s Cable Industry
- Demand for luxury TVs surging in the GCC, says Samsung
Latest Reports
- Poland Fire Protection Systems Market (2026-2032)
- Cape Verde Portable Hand-Thrown Extinguisher Market (2026-2032)
- Canada Portable Hand-Thrown Extinguisher Market (2026-2032)
- Cameroon Portable Hand-Thrown Extinguisher Market (2026-2032)
- Burundi Portable Hand-Thrown Extinguisher Market (2026-2032)
- Burkina Faso Portable Hand-Thrown Extinguisher Market (2026-2032)
- Bulgaria Portable Hand-Thrown Extinguisher Market (2026-2032)
- Brunei Portable Hand-Thrown Extinguisher Market (2026-2032)
- Botswana Portable Hand-Thrown Extinguisher Market (2026-2032)
- Bosnia and Herzegovina Portable Hand-Thrown Extinguisher Market (2026-2032)
Industry Events and Analyst Meet

HIMTEX 2026

India Refining Summit 2026

India EV Show 2026

EV tech India Expo 2026

Auto Tech Asia 2026
Whitepaper
- Middle East & Africa Commercial Security Market Click here to view more.
- Middle East & Africa Fire Safety Systems & Equipment Market Click here to view more.
- GCC Drone Market Click here to view more.
- Middle East Lighting Fixture Market Click here to view more.
- GCC Physical & Perimeter Security Market Click here to view more.