Netherlands Hypodermic Market (2026-2032) | Consumer Insights, Investment Trends, Segmentation, Competitive, Revenue, Share, Forecast, Companies, Drivers, Size, Restraints, Segments, Analysis, Supply, Outlook, Growth, Strategic Insights, Demand, Strategy, Opportunities, Competition, Pricing Analysis, Trends, Industry, Challenges, Value
Market Forecast By Product Type (Hypodermic Needles, Hypodermic Syringes, Prefilled Syringes, Safety Needles, Retractable Syringes), By Technology Type (Needle-Free Injection Systems, Smart Sensor Technology, Auto-Disable Mechanisms, Biodegradable Polymer Coating, AI-powered Drug Delivery), By End User (Hospitals, Clinics, Diabetic Patients, Elderly Population, Pharmacies), By Application (Intravenous Drug Delivery, Blood Sample Collection, Insulin Administration, Vaccination Programs, Home-based Medical Care) And Competitive Landscape
| Product Code: ETC12518412 | Publication Date: Apr 2025 | Updated Date: Apr 2026 | Product Type: Market Research Report | |
| Publisher: 6Wresearch | Author: Sachin Kumar Rai | No. of Pages: 65 | No. of Figures: 34 | No. of Tables: 19 |
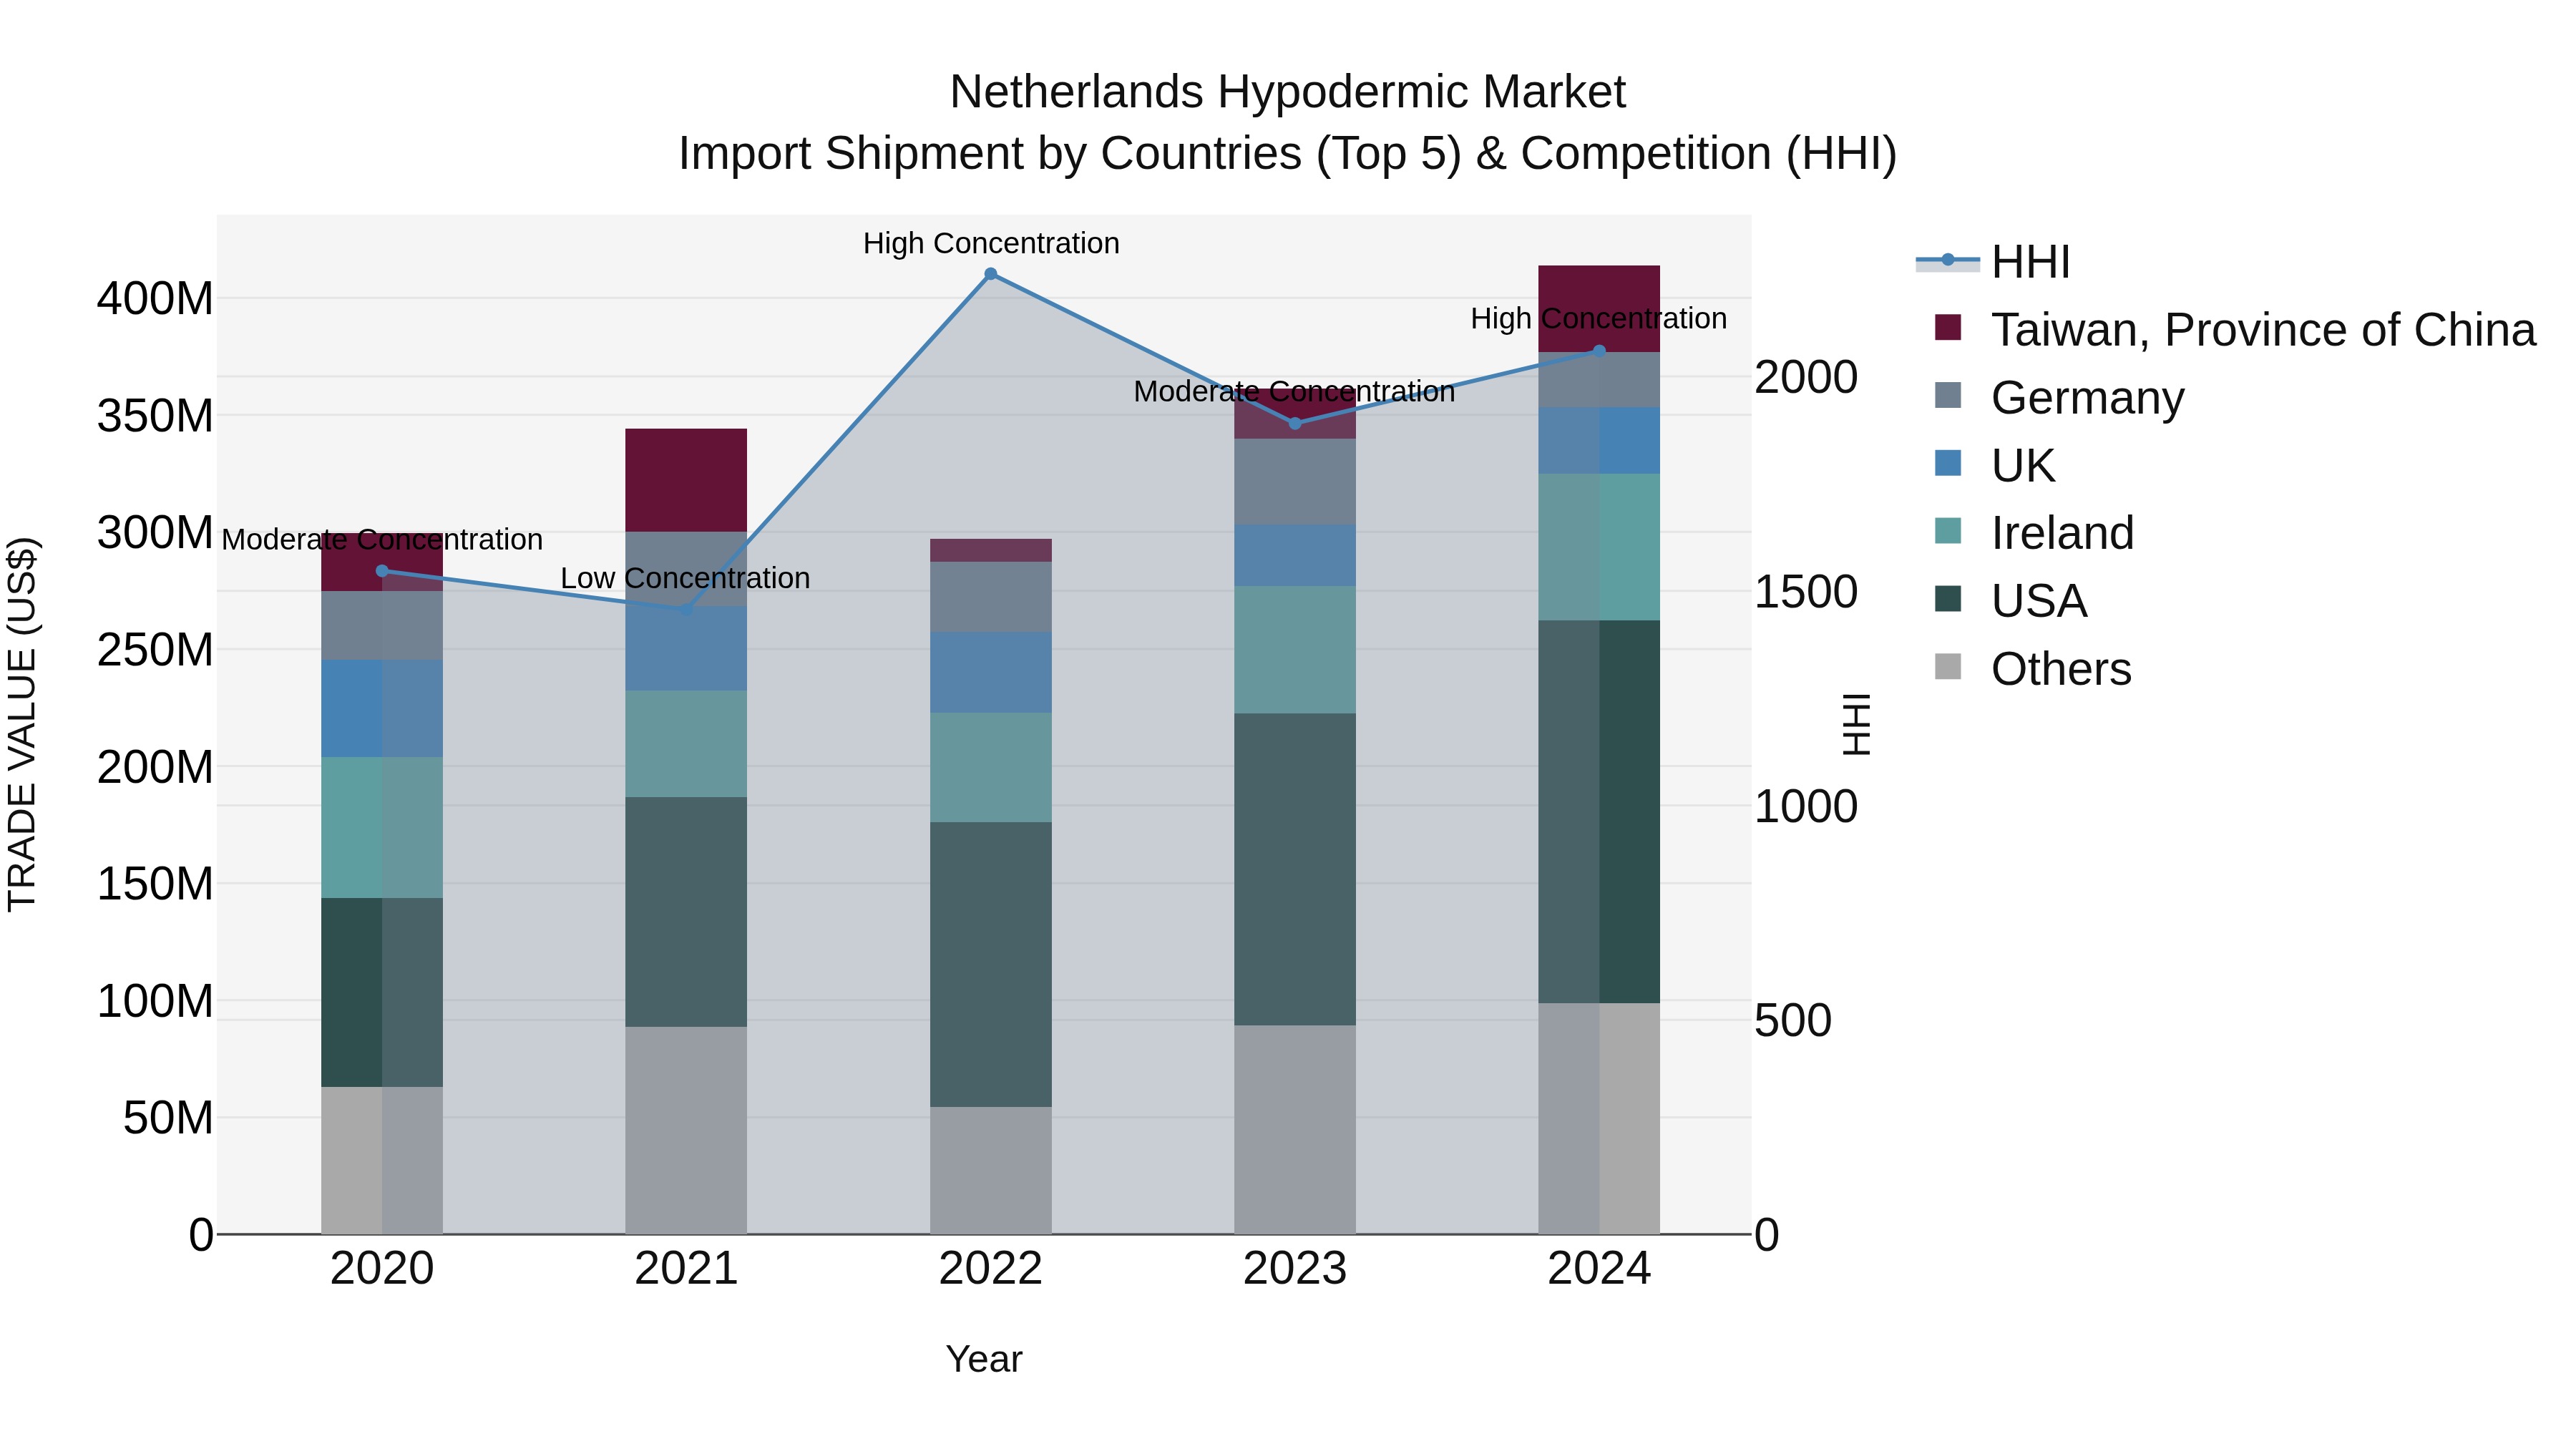
Netherlands Hypodermic Market Top 5 Importing Countries and Market Competition (HHI) Analysis
The Netherlands saw a significant increase in hypodermic import shipments in 2024, with top exporting countries including the USA, Ireland, Taiwan, China, and the UK. The market exhibited a shift towards high concentration, indicating increased dominance by key players. The impressive compound annual growth rate of 8.41% from 2020 to 2024, coupled with a notable growth rate of 14.53% from 2023 to 2024, highlights the robust expansion and competitive dynamics within the hypodermic import market in the Netherlands.
Key Highlights of the Report:
- Netherlands Hypodermic Market Outlook
- Market Size of Netherlands Hypodermic Market, 2025
- Forecast of Netherlands Hypodermic Market, 2032
- Historical Data and Forecast of Netherlands Hypodermic Revenues & Volume for the Period 2022 - 2032F
- Netherlands Hypodermic Market Trend Evolution
- Netherlands Hypodermic Market Drivers and Challenges
- Netherlands Hypodermic Price Trends
- Netherlands Hypodermic Porter's Five Forces
- Netherlands Hypodermic Industry Life Cycle
- Historical Data and Forecast of Netherlands Hypodermic Market Revenues & Volume By Product Type for the Period 2022 - 2032F
- Historical Data and Forecast of Netherlands Hypodermic Market Revenues & Volume By Hypodermic Needles for the Period 2022 - 2032F
- Historical Data and Forecast of Netherlands Hypodermic Market Revenues & Volume By Hypodermic Syringes for the Period 2022 - 2032F
- Historical Data and Forecast of Netherlands Hypodermic Market Revenues & Volume By Prefilled Syringes for the Period 2022 - 2032F
- Historical Data and Forecast of Netherlands Hypodermic Market Revenues & Volume By Safety Needles for the Period 2022 - 2032F
- Historical Data and Forecast of Netherlands Hypodermic Market Revenues & Volume By Retractable Syringes for the Period 2022 - 2032F
- Historical Data and Forecast of Netherlands Hypodermic Market Revenues & Volume By Technology Type for the Period 2022 - 2032F
- Historical Data and Forecast of Netherlands Hypodermic Market Revenues & Volume By Needle-Free Injection Systems for the Period 2022 - 2032F
- Historical Data and Forecast of Netherlands Hypodermic Market Revenues & Volume By Smart Sensor Technology for the Period 2022 - 2032F
- Historical Data and Forecast of Netherlands Hypodermic Market Revenues & Volume By Auto-Disable Mechanisms for the Period 2022 - 2032F
- Historical Data and Forecast of Netherlands Hypodermic Market Revenues & Volume By Biodegradable Polymer Coating for the Period 2022 - 2032F
- Historical Data and Forecast of Netherlands Hypodermic Market Revenues & Volume By AI-powered Drug Delivery for the Period 2022 - 2032F
- Historical Data and Forecast of Netherlands Hypodermic Market Revenues & Volume By End User for the Period 2022 - 2032F
- Historical Data and Forecast of Netherlands Hypodermic Market Revenues & Volume By Hospitals for the Period 2022 - 2032F
- Historical Data and Forecast of Netherlands Hypodermic Market Revenues & Volume By Clinics for the Period 2022 - 2032F
- Historical Data and Forecast of Netherlands Hypodermic Market Revenues & Volume By Diabetic Patients for the Period 2022 - 2032F
- Historical Data and Forecast of Netherlands Hypodermic Market Revenues & Volume By Elderly Population for the Period 2022 - 2032F
- Historical Data and Forecast of Netherlands Hypodermic Market Revenues & Volume By Pharmacies for the Period 2022 - 2032F
- Historical Data and Forecast of Netherlands Hypodermic Market Revenues & Volume By Application for the Period 2022 - 2032F
- Historical Data and Forecast of Netherlands Hypodermic Market Revenues & Volume By Intravenous Drug Delivery for the Period 2022 - 2032F
- Historical Data and Forecast of Netherlands Hypodermic Market Revenues & Volume By Blood Sample Collection for the Period 2022 - 2032F
- Historical Data and Forecast of Netherlands Hypodermic Market Revenues & Volume By Insulin Administration for the Period 2022 - 2032F
- Historical Data and Forecast of Netherlands Hypodermic Market Revenues & Volume By Vaccination Programs for the Period 2022 - 2032F
- Historical Data and Forecast of Netherlands Hypodermic Market Revenues & Volume By Home-based Medical Care for the Period 2022 - 2032F
- Netherlands Hypodermic Import Export Trade Statistics
- Market Opportunity Assessment By Product Type
- Market Opportunity Assessment By Technology Type
- Market Opportunity Assessment By End User
- Market Opportunity Assessment By Application
- Netherlands Hypodermic Top Companies Market Share
- Netherlands Hypodermic Competitive Benchmarking By Technical and Operational Parameters
- Netherlands Hypodermic Company Profiles
- Netherlands Hypodermic Key Strategic Recommendations
Frequently Asked Questions About the Market Study (FAQs):
6Wresearch actively monitors the Netherlands Hypodermic Market and publishes its comprehensive annual report, highlighting emerging trends, growth drivers, revenue analysis, and forecast outlook. Our insights help businesses to make data-backed strategic decisions with ongoing market dynamics. Our analysts track relevent industries related to the Netherlands Hypodermic Market, allowing our clients with actionable intelligence and reliable forecasts tailored to emerging regional needs.
Yes, we provide customisation as per your requirements. To learn more, feel free to contact us on sales@6wresearch.com
1 Executive Summary |
2 Introduction |
2.1 Key Highlights of the Report |
2.2 Report Description |
2.3 Market Scope & Segmentation |
2.4 Research Methodology |
2.5 Assumptions |
3 Netherlands Hypodermic Market Overview |
3.1 Netherlands Country Macro Economic Indicators |
3.2 Netherlands Hypodermic Market Revenues & Volume, 2022 & 2032F |
3.3 Netherlands Hypodermic Market - Industry Life Cycle |
3.4 Netherlands Hypodermic Market - Porter's Five Forces |
3.5 Netherlands Hypodermic Market Revenues & Volume Share, By Product Type, 2022 & 2032F |
3.6 Netherlands Hypodermic Market Revenues & Volume Share, By Technology Type, 2022 & 2032F |
3.7 Netherlands Hypodermic Market Revenues & Volume Share, By End User, 2022 & 2032F |
3.8 Netherlands Hypodermic Market Revenues & Volume Share, By Application, 2022 & 2032F |
4 Netherlands Hypodermic Market Dynamics |
4.1 Impact Analysis |
4.2 Market Drivers |
4.2.1 Increasing prevalence of chronic diseases requiring frequent injections. |
4.2.2 Technological advancements in hypodermic devices leading to improved patient comfort and ease of use. |
4.2.3 Growing awareness about the benefits of using hypodermic products for drug delivery. |
4.3 Market Restraints |
4.3.1 Stringent regulatory requirements for approval and marketing of hypodermic products. |
4.3.2 Competitive pricing pressure from alternative drug delivery methods. |
4.3.3 Limited reimbursement coverage for certain hypodermic products. |
5 Netherlands Hypodermic Market Trends |
6 Netherlands Hypodermic Market, By Types |
6.1 Netherlands Hypodermic Market, By Product Type |
6.1.1 Overview and Analysis |
6.1.2 Netherlands Hypodermic Market Revenues & Volume, By Product Type, 2022 - 2032F |
6.1.3 Netherlands Hypodermic Market Revenues & Volume, By Hypodermic Needles, 2022 - 2032F |
6.1.4 Netherlands Hypodermic Market Revenues & Volume, By Hypodermic Syringes, 2022 - 2032F |
6.1.5 Netherlands Hypodermic Market Revenues & Volume, By Prefilled Syringes, 2022 - 2032F |
6.1.6 Netherlands Hypodermic Market Revenues & Volume, By Safety Needles, 2022 - 2032F |
6.1.7 Netherlands Hypodermic Market Revenues & Volume, By Retractable Syringes, 2022 - 2032F |
6.2 Netherlands Hypodermic Market, By Technology Type |
6.2.1 Overview and Analysis |
6.2.2 Netherlands Hypodermic Market Revenues & Volume, By Needle-Free Injection Systems, 2022 - 2032F |
6.2.3 Netherlands Hypodermic Market Revenues & Volume, By Smart Sensor Technology, 2022 - 2032F |
6.2.4 Netherlands Hypodermic Market Revenues & Volume, By Auto-Disable Mechanisms, 2022 - 2032F |
6.2.5 Netherlands Hypodermic Market Revenues & Volume, By Biodegradable Polymer Coating, 2022 - 2032F |
6.2.6 Netherlands Hypodermic Market Revenues & Volume, By AI-powered Drug Delivery, 2022 - 2032F |
6.3 Netherlands Hypodermic Market, By End User |
6.3.1 Overview and Analysis |
6.3.2 Netherlands Hypodermic Market Revenues & Volume, By Hospitals, 2022 - 2032F |
6.3.3 Netherlands Hypodermic Market Revenues & Volume, By Clinics, 2022 - 2032F |
6.3.4 Netherlands Hypodermic Market Revenues & Volume, By Diabetic Patients, 2022 - 2032F |
6.3.5 Netherlands Hypodermic Market Revenues & Volume, By Elderly Population, 2022 - 2032F |
6.3.6 Netherlands Hypodermic Market Revenues & Volume, By Pharmacies, 2022 - 2032F |
6.4 Netherlands Hypodermic Market, By Application |
6.4.1 Overview and Analysis |
6.4.2 Netherlands Hypodermic Market Revenues & Volume, By Intravenous Drug Delivery, 2022 - 2032F |
6.4.3 Netherlands Hypodermic Market Revenues & Volume, By Blood Sample Collection, 2022 - 2032F |
6.4.4 Netherlands Hypodermic Market Revenues & Volume, By Insulin Administration, 2022 - 2032F |
6.4.5 Netherlands Hypodermic Market Revenues & Volume, By Vaccination Programs, 2022 - 2032F |
6.4.6 Netherlands Hypodermic Market Revenues & Volume, By Home-based Medical Care, 2022 - 2032F |
7 Netherlands Hypodermic Market Import-Export Trade Statistics |
7.1 Netherlands Hypodermic Market Export to Major Countries |
7.2 Netherlands Hypodermic Market Imports from Major Countries |
8 Netherlands Hypodermic Market Key Performance Indicators |
8.1 Number of new product launches in the hypodermic market. |
8.2 Adoption rate of innovative hypodermic devices in healthcare facilities. |
8.3 Patient satisfaction and comfort levels with hypodermic products. |
8.4 Market penetration of hypodermic products in different therapeutic areas. |
8.5 Rate of compliance with regulatory requirements for hypodermic product development. |
9 Netherlands Hypodermic Market - Opportunity Assessment |
9.1 Netherlands Hypodermic Market Opportunity Assessment, By Product Type, 2022 & 2032F |
9.2 Netherlands Hypodermic Market Opportunity Assessment, By Technology Type, 2022 & 2032F |
9.3 Netherlands Hypodermic Market Opportunity Assessment, By End User, 2022 & 2032F |
9.4 Netherlands Hypodermic Market Opportunity Assessment, By Application, 2022 & 2032F |
10 Netherlands Hypodermic Market - Competitive Landscape |
10.1 Netherlands Hypodermic Market Revenue Share, By Companies, 2025 |
10.2 Netherlands Hypodermic Market Competitive Benchmarking, By Operating and Technical Parameters |
11 Company Profiles |
12 Recommendations |
13 Disclaimer |
Global Go To Market Strategy - 2030
Export potential enables firms to identify high-growth global markets with greater confidence by combining advanced trade intelligence with a structured quantitative methodology. The framework analyzes emerging demand trends and country-level import patterns while integrating macroeconomic and trade datasets such as GDP and population forecasts, bilateral import–export flows, tariff structures, elasticity differentials between developed and developing economies, geographic distance, and import demand projections. Using weighted trade values from 2020–2024 as the base period to project country-to-country export potential for 2030, these inputs are operationalized through calculated drivers such as gravity model parameters, tariff impact factors, and projected GDP per-capita growth. Through an analysis of hidden potentials, demand hotspots, and market conditions that are most favorable to success, this method enables firms to focus on target countries, maximize returns, and global expansion with data, backed by accuracy.
By factoring in the projected importer demand gap that is currently unmet and could be potential opportunity, it identifies the potential for the Exporter (Country) among 190 countries, against the general trade analysis, which identifies the biggest importer or exporter.
To discover high-growth global markets and optimize your business strategy:
Click Here
Pricing
- Single User License$ 1,995
- Department License$ 2,400
- Site License$ 3,120
- Global License$ 3,795

Leadership Perspectives from Industry Events
Search
Thought Leadership and Analyst Meet


Our Clients
6WResearch In News
- Doha a strategic location for EV manufacturing hub: IPA Qatar
- Demand for luxury TVs surging in the GCC, says Samsung
- Empowering Growth: The Thriving Journey of Bangladesh’s Cable Industry
- Demand for luxury TVs surging in the GCC, says Samsung
- Video call with a traditional healer? Once unthinkable, it’s now common in South Africa
- Intelligent Buildings To Smooth GCC’s Path To Net Zero
Latest Reports
- Cape Verde Portable Hand-Thrown Extinguisher Market (2026-2032)
- Canada Portable Hand-Thrown Extinguisher Market (2026-2032)
- Cameroon Portable Hand-Thrown Extinguisher Market (2026-2032)
- Burundi Portable Hand-Thrown Extinguisher Market (2026-2032)
- Burkina Faso Portable Hand-Thrown Extinguisher Market (2026-2032)
- Bulgaria Portable Hand-Thrown Extinguisher Market (2026-2032)
- Brunei Portable Hand-Thrown Extinguisher Market (2026-2032)
- Botswana Portable Hand-Thrown Extinguisher Market (2026-2032)
- Bosnia and Herzegovina Portable Hand-Thrown Extinguisher Market (2026-2032)
- Bolivia Portable Hand-Thrown Extinguisher Market (2026-2032)
Industry Events and Analyst Meet

HIMTEX 2026

India Refining Summit 2026

India EV Show 2026

EV tech India Expo 2026

Auto Tech Asia 2026
Whitepaper
- Middle East & Africa Commercial Security Market Click here to view more.
- Middle East & Africa Fire Safety Systems & Equipment Market Click here to view more.
- GCC Drone Market Click here to view more.
- Middle East Lighting Fixture Market Click here to view more.
- GCC Physical & Perimeter Security Market Click here to view more.