New Zealand Bulb Market (2025-2031) | Revenue, Growth, Share, Value, Analysis, Trends, Outlook, Industry, Companies, Size, Segmentation & Forecast
Market Forecast By Type (Incandescent Bulbs, Fluorescent Bulbs, CFLs, Halogens, LEDs), By Application (Lamps & Light Bulbs, Operation Theatre (OT Instruments), Torchlights and Flashlights, Automobile Headlights, Mining Headgears, Others) And Competitive Landscape
| Product Code: ETC5110869 | Publication Date: Nov 2023 | Updated Date: Sep 2025 | Product Type: Market Research Report | |
| Publisher: 6Wresearch | Author: Sachin Kumar Rai | No. of Pages: 60 | No. of Figures: 30 | No. of Tables: 5 |
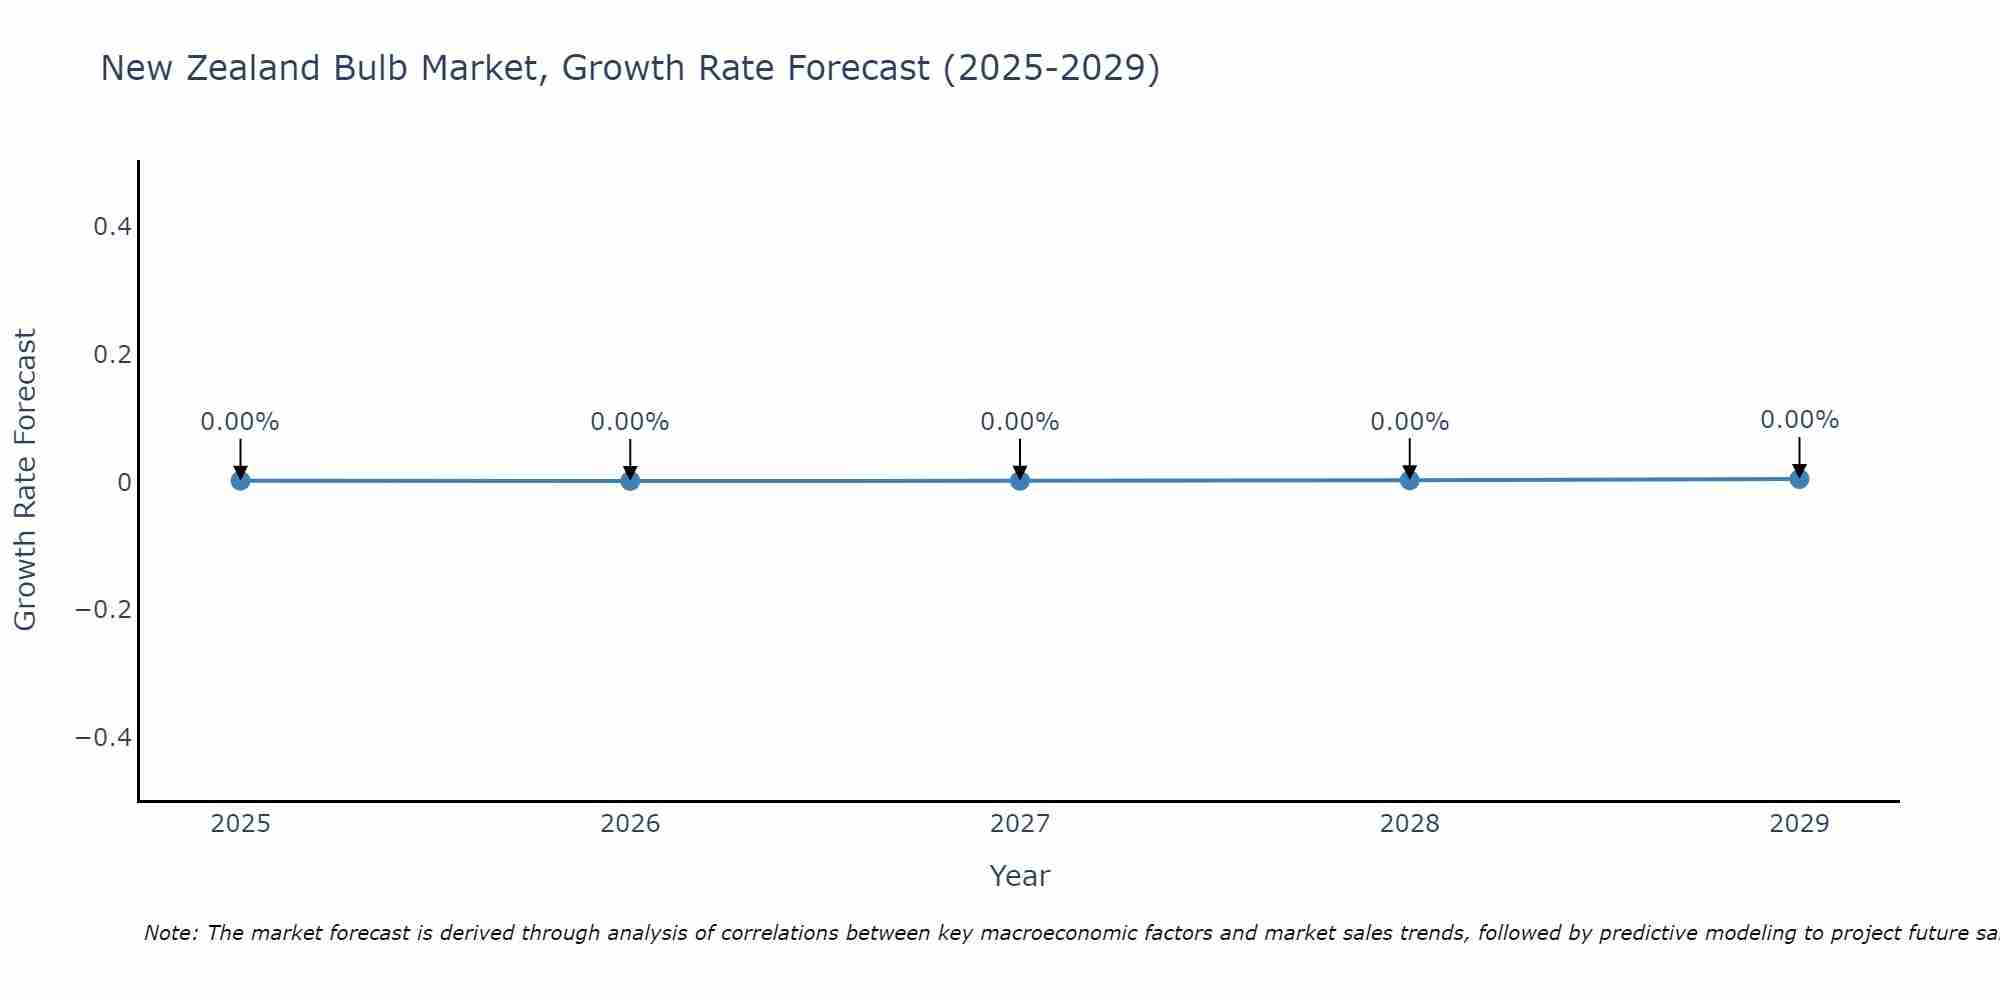
New Zealand Bulb Market Size Growth Rate
The New Zealand Bulb Market is projected to witness mixed growth rate patterns during 2025 to 2029. Commencing at 0.00% in 2025, growth builds up to 0.00% by 2029.
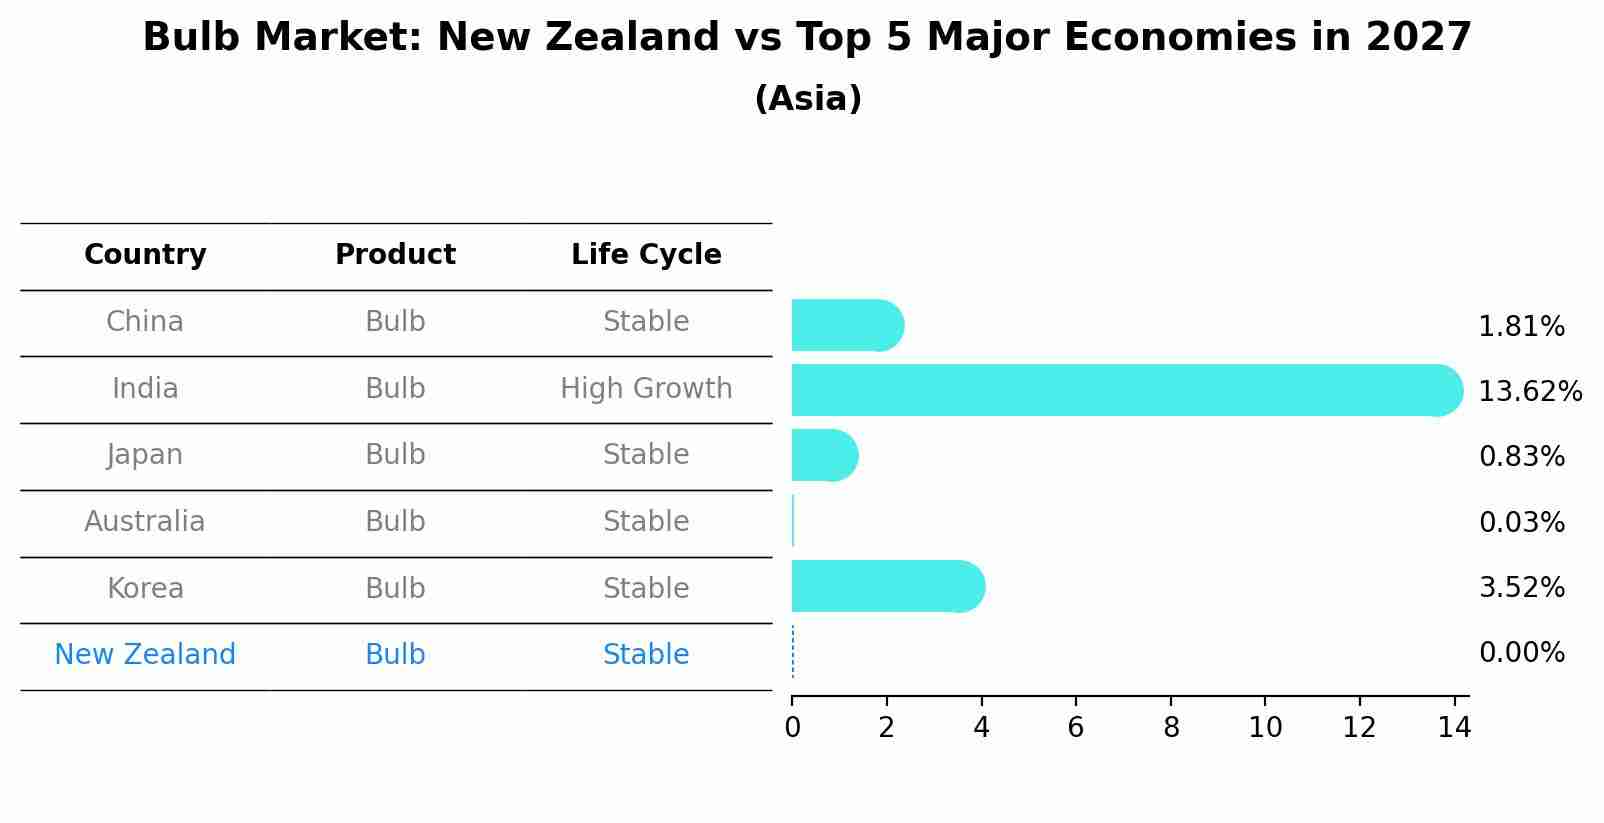
Bulb Market: New Zealand vs Top 5 Major Economies in 2027 (Asia)
The Bulb market in New Zealand is projected to grow at a stable growth rate of 0.00% by 2027, highlighting the country's increasing focus on advanced technologies within the Asia region, where China holds the dominant position, followed closely by India, Japan, Australia and South Korea, shaping overall regional demand.
New Zealand Bulb Market Overview
The bulb market in New Zealand encompasses various types of lighting technologies, including incandescent, fluorescent, LED (light-emitting diode), and CFL (compact fluorescent lamp) bulbs. With increasing emphasis on energy efficiency and sustainability, there`s a notable transition towards LED lighting solutions due to their superior energy efficiency, longer lifespan, and lower environmental impact compared to traditional bulbs. Government initiatives promoting the phase-out of inefficient lighting technologies and offering incentives for LED adoption drive market growth. Additionally, advancements in LED technology, resulting in improved performance, color rendering, and affordability, contribute to the widespread adoption of LED bulbs across residential, commercial, and industrial sectors in New Zealand.
Drivers of the market
In the New Zealand bulb market, there`s a burgeoning interest in energy-efficient lighting solutions as the country aims to transition towards sustainability and reduce its carbon footprint. LED bulbs are gaining prominence due to their longevity, energy efficiency, and environmental benefits, leading to a gradual phasing out of traditional incandescent bulbs.
Challenges of the market
In the New Zealand Bulb Market, challenges include competition from LED and other energy-efficient lighting technologies. Traditional bulbs are being phased out in favor of more sustainable options, which impacts market demand. There is also a need to ensure compliance with energy efficiency standards and regulations.
Government Policy of the market
Government policies in New Zealand promote the use of energy-efficient lighting solutions, such as LED bulbs, to reduce electricity consumption. Initiatives like the Energy Efficiency and Conservation Authority (EECA) encourage households and businesses to switch to more sustainable lighting options through incentives and educational programs.
Key Highlights of the Report:
- New Zealand Bulb Market Outlook
- Market Size of New Zealand Bulb Market, 2024
- Forecast of New Zealand Bulb Market, 2031
- Historical Data and Forecast of New Zealand Bulb Revenues & Volume for the Period 2021-2031
- New Zealand Bulb Market Trend Evolution
- New Zealand Bulb Market Drivers and Challenges
- New Zealand Bulb Price Trends
- New Zealand Bulb Porter`s Five Forces
- New Zealand Bulb Industry Life Cycle
- Historical Data and Forecast of New Zealand Bulb Market Revenues & Volume By Type for the Period 2021-2031
- Historical Data and Forecast of New Zealand Bulb Market Revenues & Volume By Incandescent Bulbs for the Period 2021-2031
- Historical Data and Forecast of New Zealand Bulb Market Revenues & Volume By Fluorescent Bulbs for the Period 2021-2031
- Historical Data and Forecast of New Zealand Bulb Market Revenues & Volume By CFLs for the Period 2021-2031
- Historical Data and Forecast of New Zealand Bulb Market Revenues & Volume By Halogens for the Period 2021-2031
- Historical Data and Forecast of New Zealand Bulb Market Revenues & Volume By LEDs for the Period 2021-2031
- Historical Data and Forecast of New Zealand Bulb Market Revenues & Volume By Application for the Period 2021-2031
- Historical Data and Forecast of New Zealand Bulb Market Revenues & Volume By Lamps & Light Bulbs for the Period 2021-2031
- Historical Data and Forecast of New Zealand Bulb Market Revenues & Volume By Operation Theatre (OT Instruments) for the Period 2021-2031
- Historical Data and Forecast of New Zealand Bulb Market Revenues & Volume By Torchlights and Flashlights for the Period 2021-2031
- Historical Data and Forecast of New Zealand Bulb Market Revenues & Volume By Automobile Headlights for the Period 2021-2031
- Historical Data and Forecast of New Zealand Bulb Market Revenues & Volume By Mining Headgears for the Period 2021-2031
- Historical Data and Forecast of New Zealand Bulb Market Revenues & Volume By Others for the Period 2021-2031
- New Zealand Bulb Import Export Trade Statistics
- Market Opportunity Assessment By Type
- Market Opportunity Assessment By Application
- New Zealand Bulb Top Companies Market Share
- New Zealand Bulb Competitive Benchmarking By Technical and Operational Parameters
- New Zealand Bulb Company Profiles
- New Zealand Bulb Key Strategic Recommendations
Frequently Asked Questions About the Market Study (FAQs):
6Wresearch actively monitors the New Zealand Bulb Market and publishes its comprehensive annual report, highlighting emerging trends, growth drivers, revenue analysis, and forecast outlook. Our insights help businesses to make data-backed strategic decisions with ongoing market dynamics. Our analysts track relevent industries related to the New Zealand Bulb Market, allowing our clients with actionable intelligence and reliable forecasts tailored to emerging regional needs.
Yes, we provide customisation as per your requirements. To learn more, feel free to contact us on sales@6wresearch.com
1 Executive Summary |
2 Introduction |
2.1 Key Highlights of the Report |
2.2 Report Description |
2.3 Market Scope & Segmentation |
2.4 Research Methodology |
2.5 Assumptions |
3 New Zealand Bulb Market Overview |
3.1 New Zealand Country Macro Economic Indicators |
3.2 New Zealand Bulb Market Revenues & Volume, 2021 & 2031F |
3.3 New Zealand Bulb Market - Industry Life Cycle |
3.4 New Zealand Bulb Market - Porter's Five Forces |
3.5 New Zealand Bulb Market Revenues & Volume Share, By Type, 2021 & 2031F |
3.6 New Zealand Bulb Market Revenues & Volume Share, By Application, 2021 & 2031F |
4 New Zealand Bulb Market Dynamics |
4.1 Impact Analysis |
4.2 Market Drivers |
4.2.1 Growing demand for sustainable and eco-friendly products |
4.2.2 Increasing trend towards gardening and home decor |
4.2.3 Rise in urbanization leading to smaller living spaces with higher demand for indoor plants and bulbs |
4.3 Market Restraints |
4.3.1 Seasonal nature of bulb planting and growth |
4.3.2 Vulnerability to weather conditions and natural disasters affecting bulb production |
5 New Zealand Bulb Market Trends |
6 New Zealand Bulb Market Segmentations |
6.1 New Zealand Bulb Market, By Type |
6.1.1 Overview and Analysis |
6.1.2 New Zealand Bulb Market Revenues & Volume, By Incandescent Bulbs, 2021-2031F |
6.1.3 New Zealand Bulb Market Revenues & Volume, By Fluorescent Bulbs, 2021-2031F |
6.1.4 New Zealand Bulb Market Revenues & Volume, By CFLs, 2021-2031F |
6.1.5 New Zealand Bulb Market Revenues & Volume, By Halogens, 2021-2031F |
6.1.6 New Zealand Bulb Market Revenues & Volume, By LEDs, 2021-2031F |
6.2 New Zealand Bulb Market, By Application |
6.2.1 Overview and Analysis |
6.2.2 New Zealand Bulb Market Revenues & Volume, By Lamps & Light Bulbs, 2021-2031F |
6.2.3 New Zealand Bulb Market Revenues & Volume, By Operation Theatre (OT Instruments), 2021-2031F |
6.2.4 New Zealand Bulb Market Revenues & Volume, By Torchlights and Flashlights, 2021-2031F |
6.2.5 New Zealand Bulb Market Revenues & Volume, By Automobile Headlights, 2021-2031F |
6.2.6 New Zealand Bulb Market Revenues & Volume, By Mining Headgears, 2021-2031F |
6.2.7 New Zealand Bulb Market Revenues & Volume, By Others, 2021-2031F |
7 New Zealand Bulb Market Import-Export Trade Statistics |
7.1 New Zealand Bulb Market Export to Major Countries |
7.2 New Zealand Bulb Market Imports from Major Countries |
8 New Zealand Bulb Market Key Performance Indicators |
8.1 Percentage increase in online searches for gardening and plant-related keywords |
8.2 Number of participants in gardening workshops and events |
8.3 Growth in sales of indoor gardening supplies and accessories |
9 New Zealand Bulb Market - Opportunity Assessment |
9.1 New Zealand Bulb Market Opportunity Assessment, By Type, 2021 & 2031F |
9.2 New Zealand Bulb Market Opportunity Assessment, By Application, 2021 & 2031F |
10 New Zealand Bulb Market - Competitive Landscape |
10.1 New Zealand Bulb Market Revenue Share, By Companies, 2024 |
10.2 New Zealand Bulb Market Competitive Benchmarking, By Operating and Technical Parameters |
11 Company Profiles |
12 Recommendations | 13 Disclaimer |
Global Go To Market Strategy - 2030
Export potential enables firms to identify high-growth global markets with greater confidence by combining advanced trade intelligence with a structured quantitative methodology. The framework analyzes emerging demand trends and country-level import patterns while integrating macroeconomic and trade datasets such as GDP and population forecasts, bilateral import–export flows, tariff structures, elasticity differentials between developed and developing economies, geographic distance, and import demand projections. Using weighted trade values from 2020–2024 as the base period to project country-to-country export potential for 2030, these inputs are operationalized through calculated drivers such as gravity model parameters, tariff impact factors, and projected GDP per-capita growth. Through an analysis of hidden potentials, demand hotspots, and market conditions that are most favorable to success, this method enables firms to focus on target countries, maximize returns, and global expansion with data, backed by accuracy.
By factoring in the projected importer demand gap that is currently unmet and could be potential opportunity, it identifies the potential for the Exporter (Country) among 190 countries, against the general trade analysis, which identifies the biggest importer or exporter.
To discover high-growth global markets and optimize your business strategy:
Click Here
Pricing
- Single User License$ 1,995
- Department License$ 2,400
- Site License$ 3,120
- Global License$ 3,795

Leadership Perspectives from Industry Events
Search
Thought Leadership and Analyst Meet


Our Clients
6WResearch In News
- India Export Attractiveness Tracker 2026
- India Air Conditioner Market Set for Strong Rebound in 2026 After Weather-Led Correction and GST-Driven Recovery: 6Wresearch
- ADAS in India: How Automatic Emergency Braking, Blind Spot Detection & Driver Monitoring are Transforming Road Safety
- Doha a strategic location for EV manufacturing hub: IPA Qatar
- Demand for luxury TVs surging in the GCC, says Samsung
- Empowering Growth: The Thriving Journey of Bangladesh’s Cable Industry
Latest Reports
- Qatar Access and Home Network Market (2026-2032)
- Nicaragua RPG Gaming Market (2026-2032)
- New Zealand RPG Gaming Market (2026-2032)
- Netherlands RPG Gaming Market (2026-2032)
- Nauru RPG Gaming Market (2026-2032)
- Namibia RPG Gaming Market (2026-2032)
- Mozambique RPG Gaming Market (2026-2032)
- Montenegro RPG Gaming Market (2026-2032)
- Mongolia RPG Gaming Market (2026-2032)
- Monaco RPG Gaming Market (2026-2032)
Industry Events and Analyst Meet

EV India Expo 2026

HIMTEX 2026

India Refining Summit 2026

India EV Show 2026

EV tech India Expo 2026
Whitepaper
- Middle East & Africa Commercial Security Market Click here to view more.
- Middle East & Africa Fire Safety Systems & Equipment Market Click here to view more.
- GCC Drone Market Click here to view more.
- Middle East Lighting Fixture Market Click here to view more.
- GCC Physical & Perimeter Security Market Click here to view more.