New Zealand Interactive Tables Market (2025-2031) | Industry, Value, Revenue, Growth, Analysis, Trends, Size, Forecast, Segmentation, Companies, Share & Outlook
Market Forecast By Technology (LCD, LED, Capacitive, Others), By Screen Size (32-65 Inch, 65 Inch & Above), By Application (Exhibition & Trade Shows, Education, Retail, Control Room, Hospitality, Transportation, Others) And Competitive Landscape
| Product Code: ETC5147045 | Publication Date: Nov 2023 | Updated Date: Nov 2025 | Product Type: Market Research Report | |
| Publisher: 6Wresearch | Author: Bhawna Singh | No. of Pages: 60 | No. of Figures: 30 | No. of Tables: 5 |
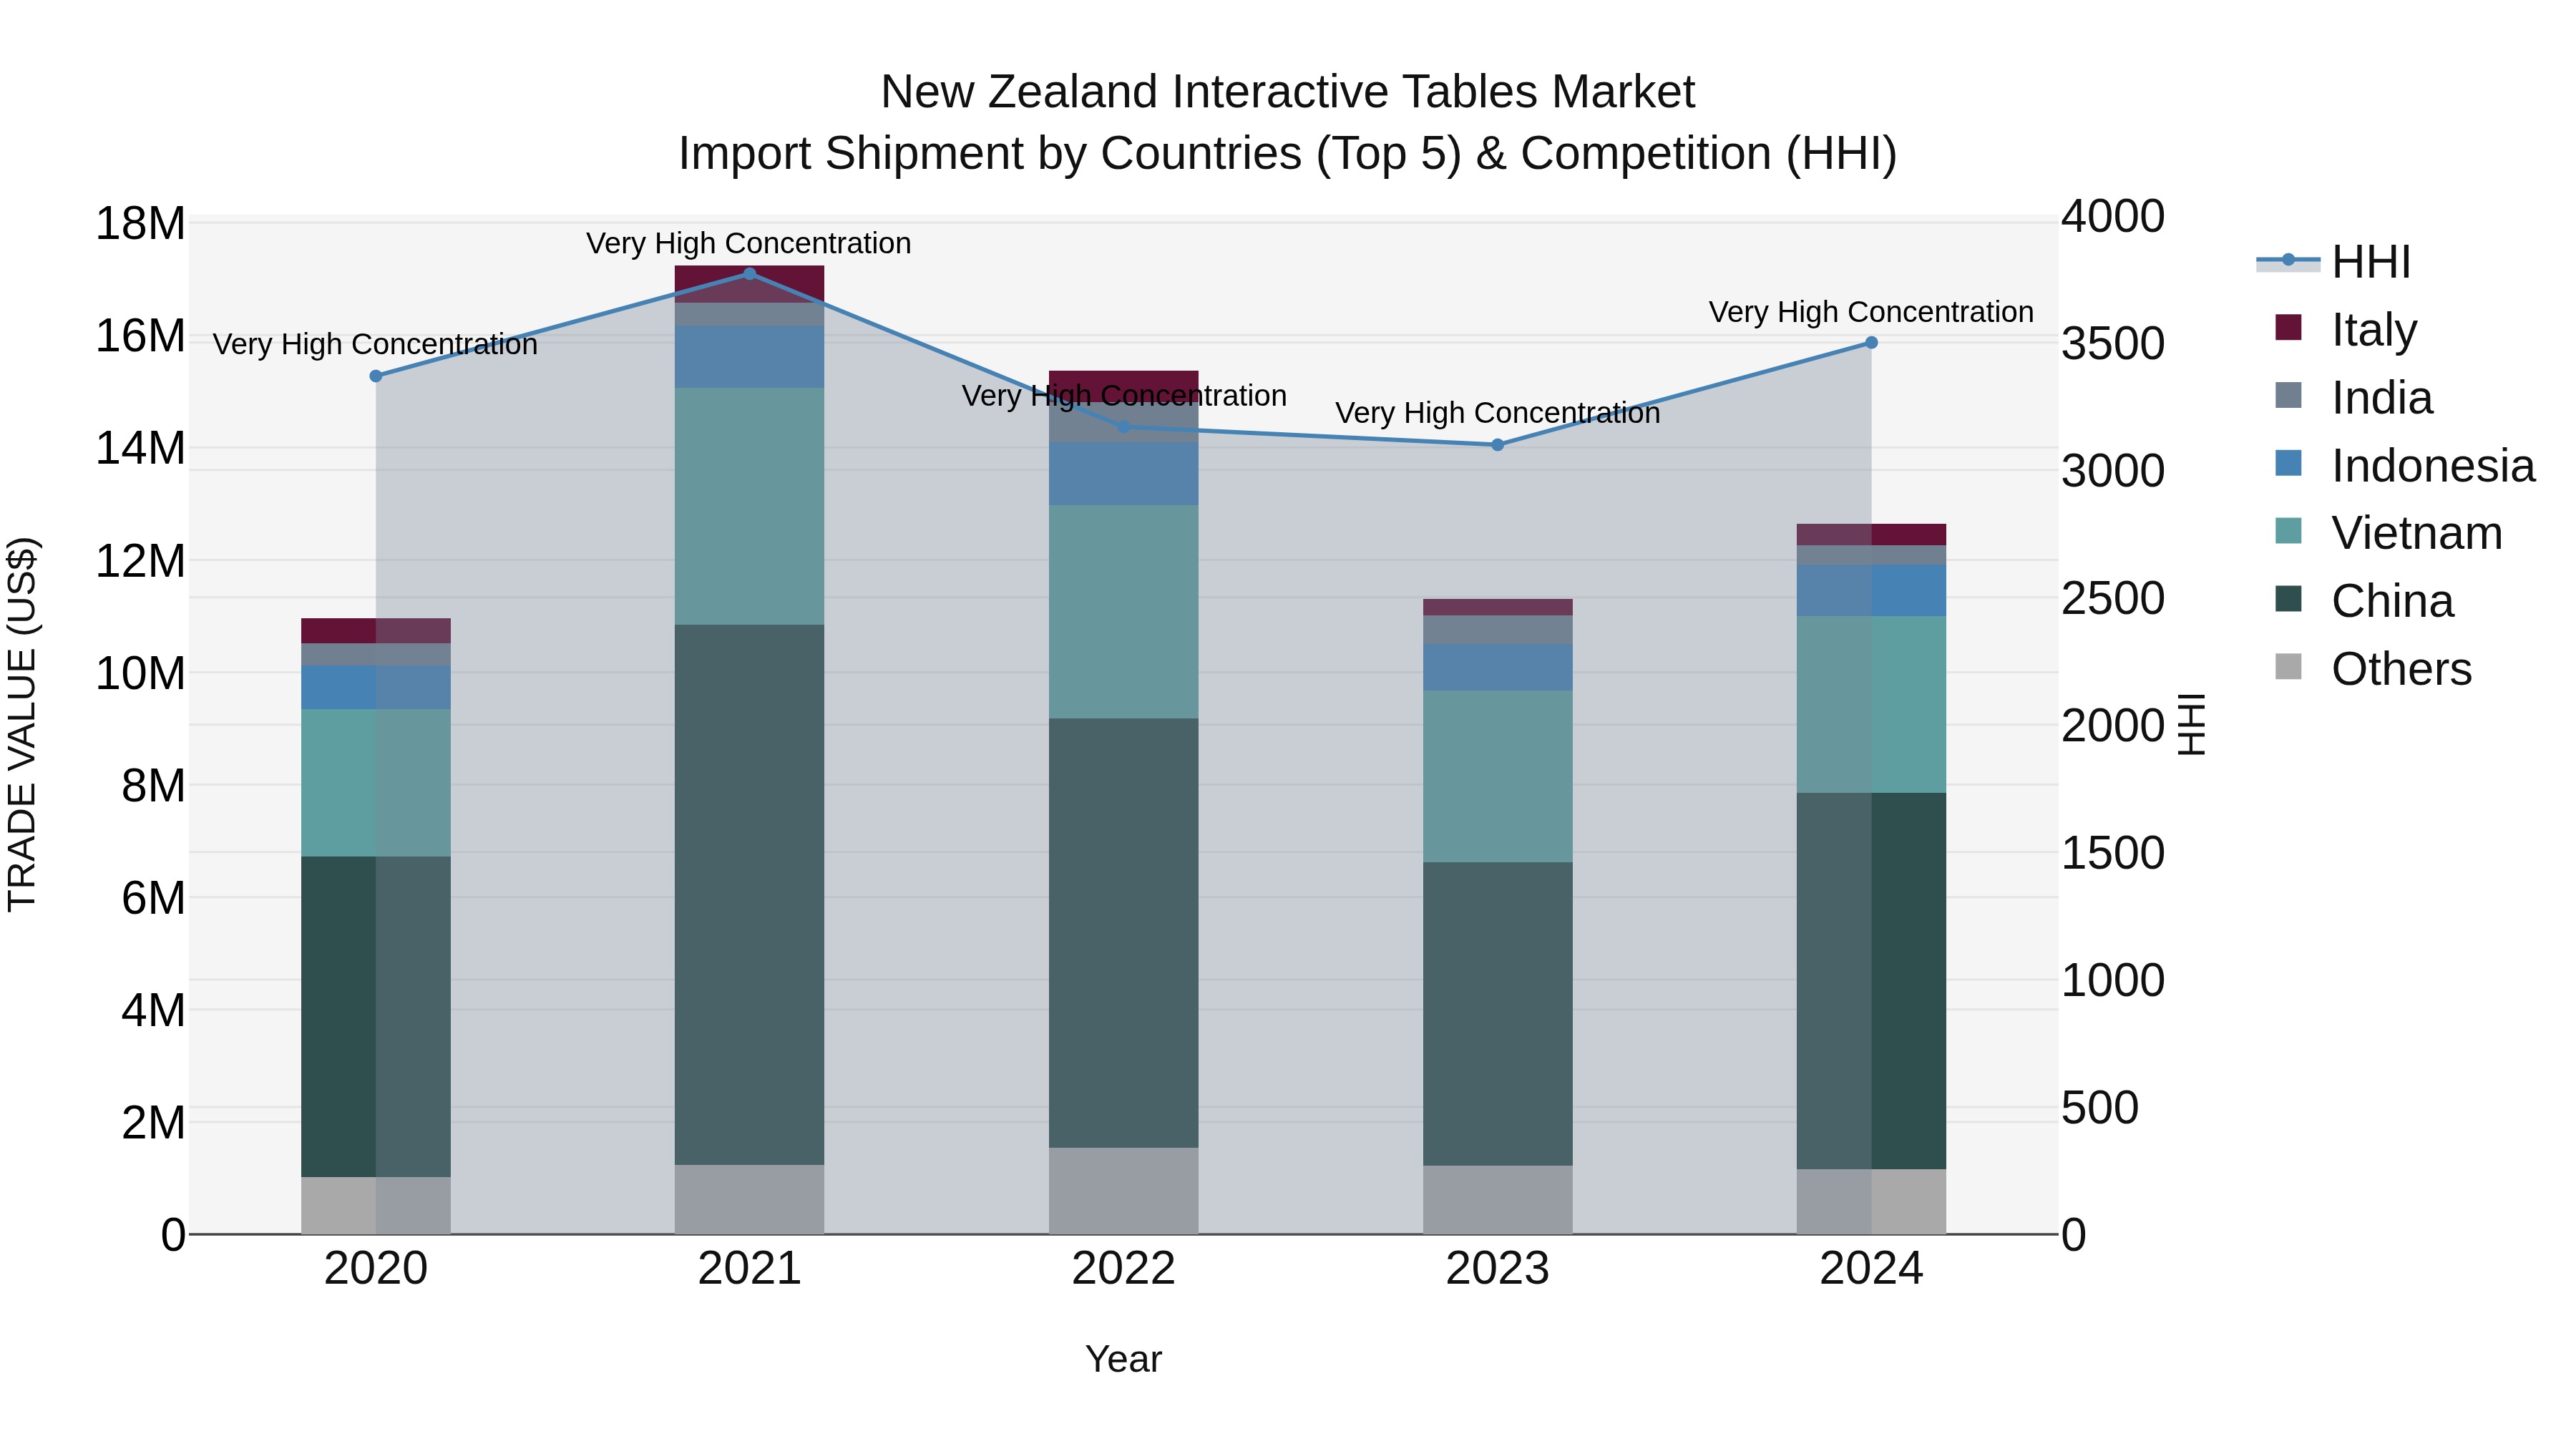
New Zealand Interactive Tables Market Top 5 Importing Countries and Market Competition (HHI) Analysis
In 2024, New Zealand`s interactive tables import market saw continued dominance from key exporters, with China, Vietnam, Indonesia, Malaysia, and Italy leading the pack. The high Herfindahl-Hirschman Index (HHI) reflects a concentrated market landscape. The compound annual growth rate (CAGR) from 2020 to 2024 stood at a steady 3.63%, while the impressive growth rate of 11.8% from 2023 to 2024 indicates a positive trajectory for the industry. This data underscores the importance of these top exporting countries in driving the growth and development of New Zealand`s interactive tables market.
New Zealand Interactive Tables Market Overview
Interactive tables are becoming popular in New Zealand for educational and collaborative environments. These tables feature touch-sensitive surfaces and interactive displays, facilitating group work and interactive learning.
Drivers of the market
The demand for interactive and immersive experiences in hospitality, retail, and entertainment venues is driving the growth of the interactive tables market in New Zealand. Interactive tables offer engaging and informative experiences for customers, enhancing brand perception and driving foot traffic.
Challenges of the market
For the interactive tables market, challenges include designing tables with durable touch screens, multitouch capabilities, and seamless integration with software applications to support collaborative activities and customer engagements. Addressing space constraints, maintenance requirements, and cost considerations also remain significant hurdles.
Government Policy of the market
The Interactive Tables Market benefits from government policies that advocate for the integration of digital tools in education and collaborative workspaces. Policies support the adoption of interactive tables in educational institutions and corporate environments to facilitate interactive learning and teamwork.
Key Highlights of the Report:
- New Zealand Interactive Tables Market Outlook
- Market Size of New Zealand Interactive Tables Market, 2024
- Forecast of New Zealand Interactive Tables Market, 2031
- Historical Data and Forecast of New Zealand Interactive Tables Revenues & Volume for the Period 2021-2031
- New Zealand Interactive Tables Market Trend Evolution
- New Zealand Interactive Tables Market Drivers and Challenges
- New Zealand Interactive Tables Price Trends
- New Zealand Interactive Tables Porter`s Five Forces
- New Zealand Interactive Tables Industry Life Cycle
- Historical Data and Forecast of New Zealand Interactive Tables Market Revenues & Volume By Technology for the Period 2021-2031
- Historical Data and Forecast of New Zealand Interactive Tables Market Revenues & Volume By LCD for the Period 2021-2031
- Historical Data and Forecast of New Zealand Interactive Tables Market Revenues & Volume By LED for the Period 2021-2031
- Historical Data and Forecast of New Zealand Interactive Tables Market Revenues & Volume By Capacitive for the Period 2021-2031
- Historical Data and Forecast of New Zealand Interactive Tables Market Revenues & Volume By Others for the Period 2021-2031
- Historical Data and Forecast of New Zealand Interactive Tables Market Revenues & Volume By Screen Size for the Period 2021-2031
- Historical Data and Forecast of New Zealand Interactive Tables Market Revenues & Volume By 32-65 Inch for the Period 2021-2031
- Historical Data and Forecast of New Zealand Interactive Tables Market Revenues & Volume By 65 Inch & Above for the Period 2021-2031
- Historical Data and Forecast of New Zealand Interactive Tables Market Revenues & Volume By Application for the Period 2021-2031
- Historical Data and Forecast of New Zealand Interactive Tables Market Revenues & Volume By Exhibition & Trade Shows for the Period 2021-2031
- Historical Data and Forecast of New Zealand Interactive Tables Market Revenues & Volume By Education for the Period 2021-2031
- Historical Data and Forecast of New Zealand Interactive Tables Market Revenues & Volume By Retail for the Period 2021-2031
- Historical Data and Forecast of New Zealand Interactive Tables Market Revenues & Volume By Control Room for the Period 2021-2031
- Historical Data and Forecast of New Zealand Interactive Tables Market Revenues & Volume By Hospitality for the Period 2021-2031
- Historical Data and Forecast of New Zealand Interactive Tables Market Revenues & Volume By Transportation for the Period 2021-2031
- Historical Data and Forecast of New Zealand Interactive Tables Market Revenues & Volume By Others for the Period 2021-2031
- New Zealand Interactive Tables Import Export Trade Statistics
- Market Opportunity Assessment By Technology
- Market Opportunity Assessment By Screen Size
- Market Opportunity Assessment By Application
- New Zealand Interactive Tables Top Companies Market Share
- New Zealand Interactive Tables Competitive Benchmarking By Technical and Operational Parameters
- New Zealand Interactive Tables Company Profiles
- New Zealand Interactive Tables Key Strategic Recommendations
Frequently Asked Questions About the Market Study (FAQs):
6Wresearch actively monitors the New Zealand Interactive Tables Market and publishes its comprehensive annual report, highlighting emerging trends, growth drivers, revenue analysis, and forecast outlook. Our insights help businesses to make data-backed strategic decisions with ongoing market dynamics. Our analysts track relevent industries related to the New Zealand Interactive Tables Market, allowing our clients with actionable intelligence and reliable forecasts tailored to emerging regional needs.
Yes, we provide customisation as per your requirements. To learn more, feel free to contact us on sales@6wresearch.com
1 Executive Summary |
2 Introduction |
2.1 Key Highlights of the Report |
2.2 Report Description |
2.3 Market Scope & Segmentation |
2.4 Research Methodology |
2.5 Assumptions |
3 New Zealand Interactive Tables Market Overview |
3.1 New Zealand Country Macro Economic Indicators |
3.2 New Zealand Interactive Tables Market Revenues & Volume, 2021 & 2031F |
3.3 New Zealand Interactive Tables Market - Industry Life Cycle |
3.4 New Zealand Interactive Tables Market - Porter's Five Forces |
3.5 New Zealand Interactive Tables Market Revenues & Volume Share, By Technology, 2021 & 2031F |
3.6 New Zealand Interactive Tables Market Revenues & Volume Share, By Screen Size, 2021 & 2031F |
3.7 New Zealand Interactive Tables Market Revenues & Volume Share, By Application, 2021 & 2031F |
4 New Zealand Interactive Tables Market Dynamics |
4.1 Impact Analysis |
4.2 Market Drivers |
4.2.1 Increasing demand for interactive learning tools in educational institutions |
4.2.2 Growing adoption of interactive tables in retail stores for enhancing customer engagement |
4.2.3 Technological advancements leading to improved features and functionalities of interactive tables |
4.3 Market Restraints |
4.3.1 High initial investment costs for implementing interactive tables |
4.3.2 Limited awareness about the benefits of interactive tables among potential end-users |
5 New Zealand Interactive Tables Market Trends |
6 New Zealand Interactive Tables Market Segmentations |
6.1 New Zealand Interactive Tables Market, By Technology |
6.1.1 Overview and Analysis |
6.1.2 New Zealand Interactive Tables Market Revenues & Volume, By LCD, 2021-2031F |
6.1.3 New Zealand Interactive Tables Market Revenues & Volume, By LED, 2021-2031F |
6.1.4 New Zealand Interactive Tables Market Revenues & Volume, By Capacitive, 2021-2031F |
6.1.5 New Zealand Interactive Tables Market Revenues & Volume, By Others, 2021-2031F |
6.2 New Zealand Interactive Tables Market, By Screen Size |
6.2.1 Overview and Analysis |
6.2.2 New Zealand Interactive Tables Market Revenues & Volume, By 32-65 Inch, 2021-2031F |
6.2.3 New Zealand Interactive Tables Market Revenues & Volume, By 65 Inch & Above, 2021-2031F |
6.3 New Zealand Interactive Tables Market, By Application |
6.3.1 Overview and Analysis |
6.3.2 New Zealand Interactive Tables Market Revenues & Volume, By Exhibition & Trade Shows, 2021-2031F |
6.3.3 New Zealand Interactive Tables Market Revenues & Volume, By Education, 2021-2031F |
6.3.4 New Zealand Interactive Tables Market Revenues & Volume, By Retail, 2021-2031F |
6.3.5 New Zealand Interactive Tables Market Revenues & Volume, By Control Room, 2021-2031F |
6.3.6 New Zealand Interactive Tables Market Revenues & Volume, By Hospitality, 2021-2031F |
6.3.7 New Zealand Interactive Tables Market Revenues & Volume, By Transportation, 2021-2031F |
7 New Zealand Interactive Tables Market Import-Export Trade Statistics |
7.1 New Zealand Interactive Tables Market Export to Major Countries |
7.2 New Zealand Interactive Tables Market Imports from Major Countries |
8 New Zealand Interactive Tables Market Key Performance Indicators |
8.1 Average time spent by students/employees using interactive tables |
8.2 Number of interactive table installations in key sectors such as education and retail |
8.3 Rate of adoption of interactive tables in new applications or industries |
9 New Zealand Interactive Tables Market - Opportunity Assessment |
9.1 New Zealand Interactive Tables Market Opportunity Assessment, By Technology, 2021 & 2031F |
9.2 New Zealand Interactive Tables Market Opportunity Assessment, By Screen Size, 2021 & 2031F |
9.3 New Zealand Interactive Tables Market Opportunity Assessment, By Application, 2021 & 2031F |
10 New Zealand Interactive Tables Market - Competitive Landscape |
10.1 New Zealand Interactive Tables Market Revenue Share, By Companies, 2024 |
10.2 New Zealand Interactive Tables Market Competitive Benchmarking, By Operating and Technical Parameters |
11 Company Profiles |
12 Recommendations | 13 Disclaimer |
Global Go To Market Strategy - 2030
Export potential enables firms to identify high-growth global markets with greater confidence by combining advanced trade intelligence with a structured quantitative methodology. The framework analyzes emerging demand trends and country-level import patterns while integrating macroeconomic and trade datasets such as GDP and population forecasts, bilateral import–export flows, tariff structures, elasticity differentials between developed and developing economies, geographic distance, and import demand projections. Using weighted trade values from 2020–2024 as the base period to project country-to-country export potential for 2030, these inputs are operationalized through calculated drivers such as gravity model parameters, tariff impact factors, and projected GDP per-capita growth. Through an analysis of hidden potentials, demand hotspots, and market conditions that are most favorable to success, this method enables firms to focus on target countries, maximize returns, and global expansion with data, backed by accuracy.
By factoring in the projected importer demand gap that is currently unmet and could be potential opportunity, it identifies the potential for the Exporter (Country) among 190 countries, against the general trade analysis, which identifies the biggest importer or exporter.
To discover high-growth global markets and optimize your business strategy:
Click Here
Pricing
- Single User License$ 1,995
- Department License$ 2,400
- Site License$ 3,120
- Global License$ 3,795

Leadership Perspectives from Industry Events
Search
Thought Leadership and Analyst Meet


Our Clients
6WResearch In News
- India Export Attractiveness Tracker 2026
- India Air Conditioner Market Set for Strong Rebound in 2026 After Weather-Led Correction and GST-Driven Recovery: 6Wresearch
- ADAS in India: How Automatic Emergency Braking, Blind Spot Detection & Driver Monitoring are Transforming Road Safety
- Doha a strategic location for EV manufacturing hub: IPA Qatar
- Demand for luxury TVs surging in the GCC, says Samsung
- Empowering Growth: The Thriving Journey of Bangladesh’s Cable Industry
Latest Reports
- Nicaragua RPG Gaming Market (2026-2032)
- New Zealand RPG Gaming Market (2026-2032)
- Netherlands RPG Gaming Market (2026-2032)
- Nauru RPG Gaming Market (2026-2032)
- Namibia RPG Gaming Market (2026-2032)
- Mozambique RPG Gaming Market (2026-2032)
- Montenegro RPG Gaming Market (2026-2032)
- Mongolia RPG Gaming Market (2026-2032)
- Monaco RPG Gaming Market (2026-2032)
- Micronesia RPG Gaming Market (2026-2032)
Industry Events and Analyst Meet

EV India Expo 2026

HIMTEX 2026

India Refining Summit 2026

India EV Show 2026

EV tech India Expo 2026
Whitepaper
- Middle East & Africa Commercial Security Market Click here to view more.
- Middle East & Africa Fire Safety Systems & Equipment Market Click here to view more.
- GCC Drone Market Click here to view more.
- Middle East Lighting Fixture Market Click here to view more.
- GCC Physical & Perimeter Security Market Click here to view more.