Norway Consumer Grade 3D Scanner Market (2026-2032) | Size & Revenue, Outlook, Analysis, Share, Trends, Companies, Value, Segmentation, Industry, Growth, Forecast, Competitive Landscape
Market Forecast By Offering (Hardware, Software and Solutions, Services), By Range (Short-Range 3D Scanners, Medium-Range 3D Scanners), By Type (Structured Light Scanners, 3D Laser Scanners, Hybrid 3D Scanners), By Technology (Light Triangulation, Laser Triangulation, Pattern Fringe Triangulation, Laser Pulse Based), By Application (Quality Control/Inspection, Reverse Engineering, Virtual Simulation, Others), By Product (Handheld, Tripod Mounted, Desktop), By End-Use (Additive Printing, Architects and Designers, Education and Research, Hobbyists, Arts, Digital Content Creation, Others) And Competitive Landscape
| Product Code: ETC8665462 | Publication Date: Sep 2024 | Updated Date: Apr 2026 | Product Type: Market Research Report | |
| Publisher: 6Wresearch | Author: Sumit Sagar | No. of Pages: 75 | No. of Figures: 35 | No. of Tables: 20 |
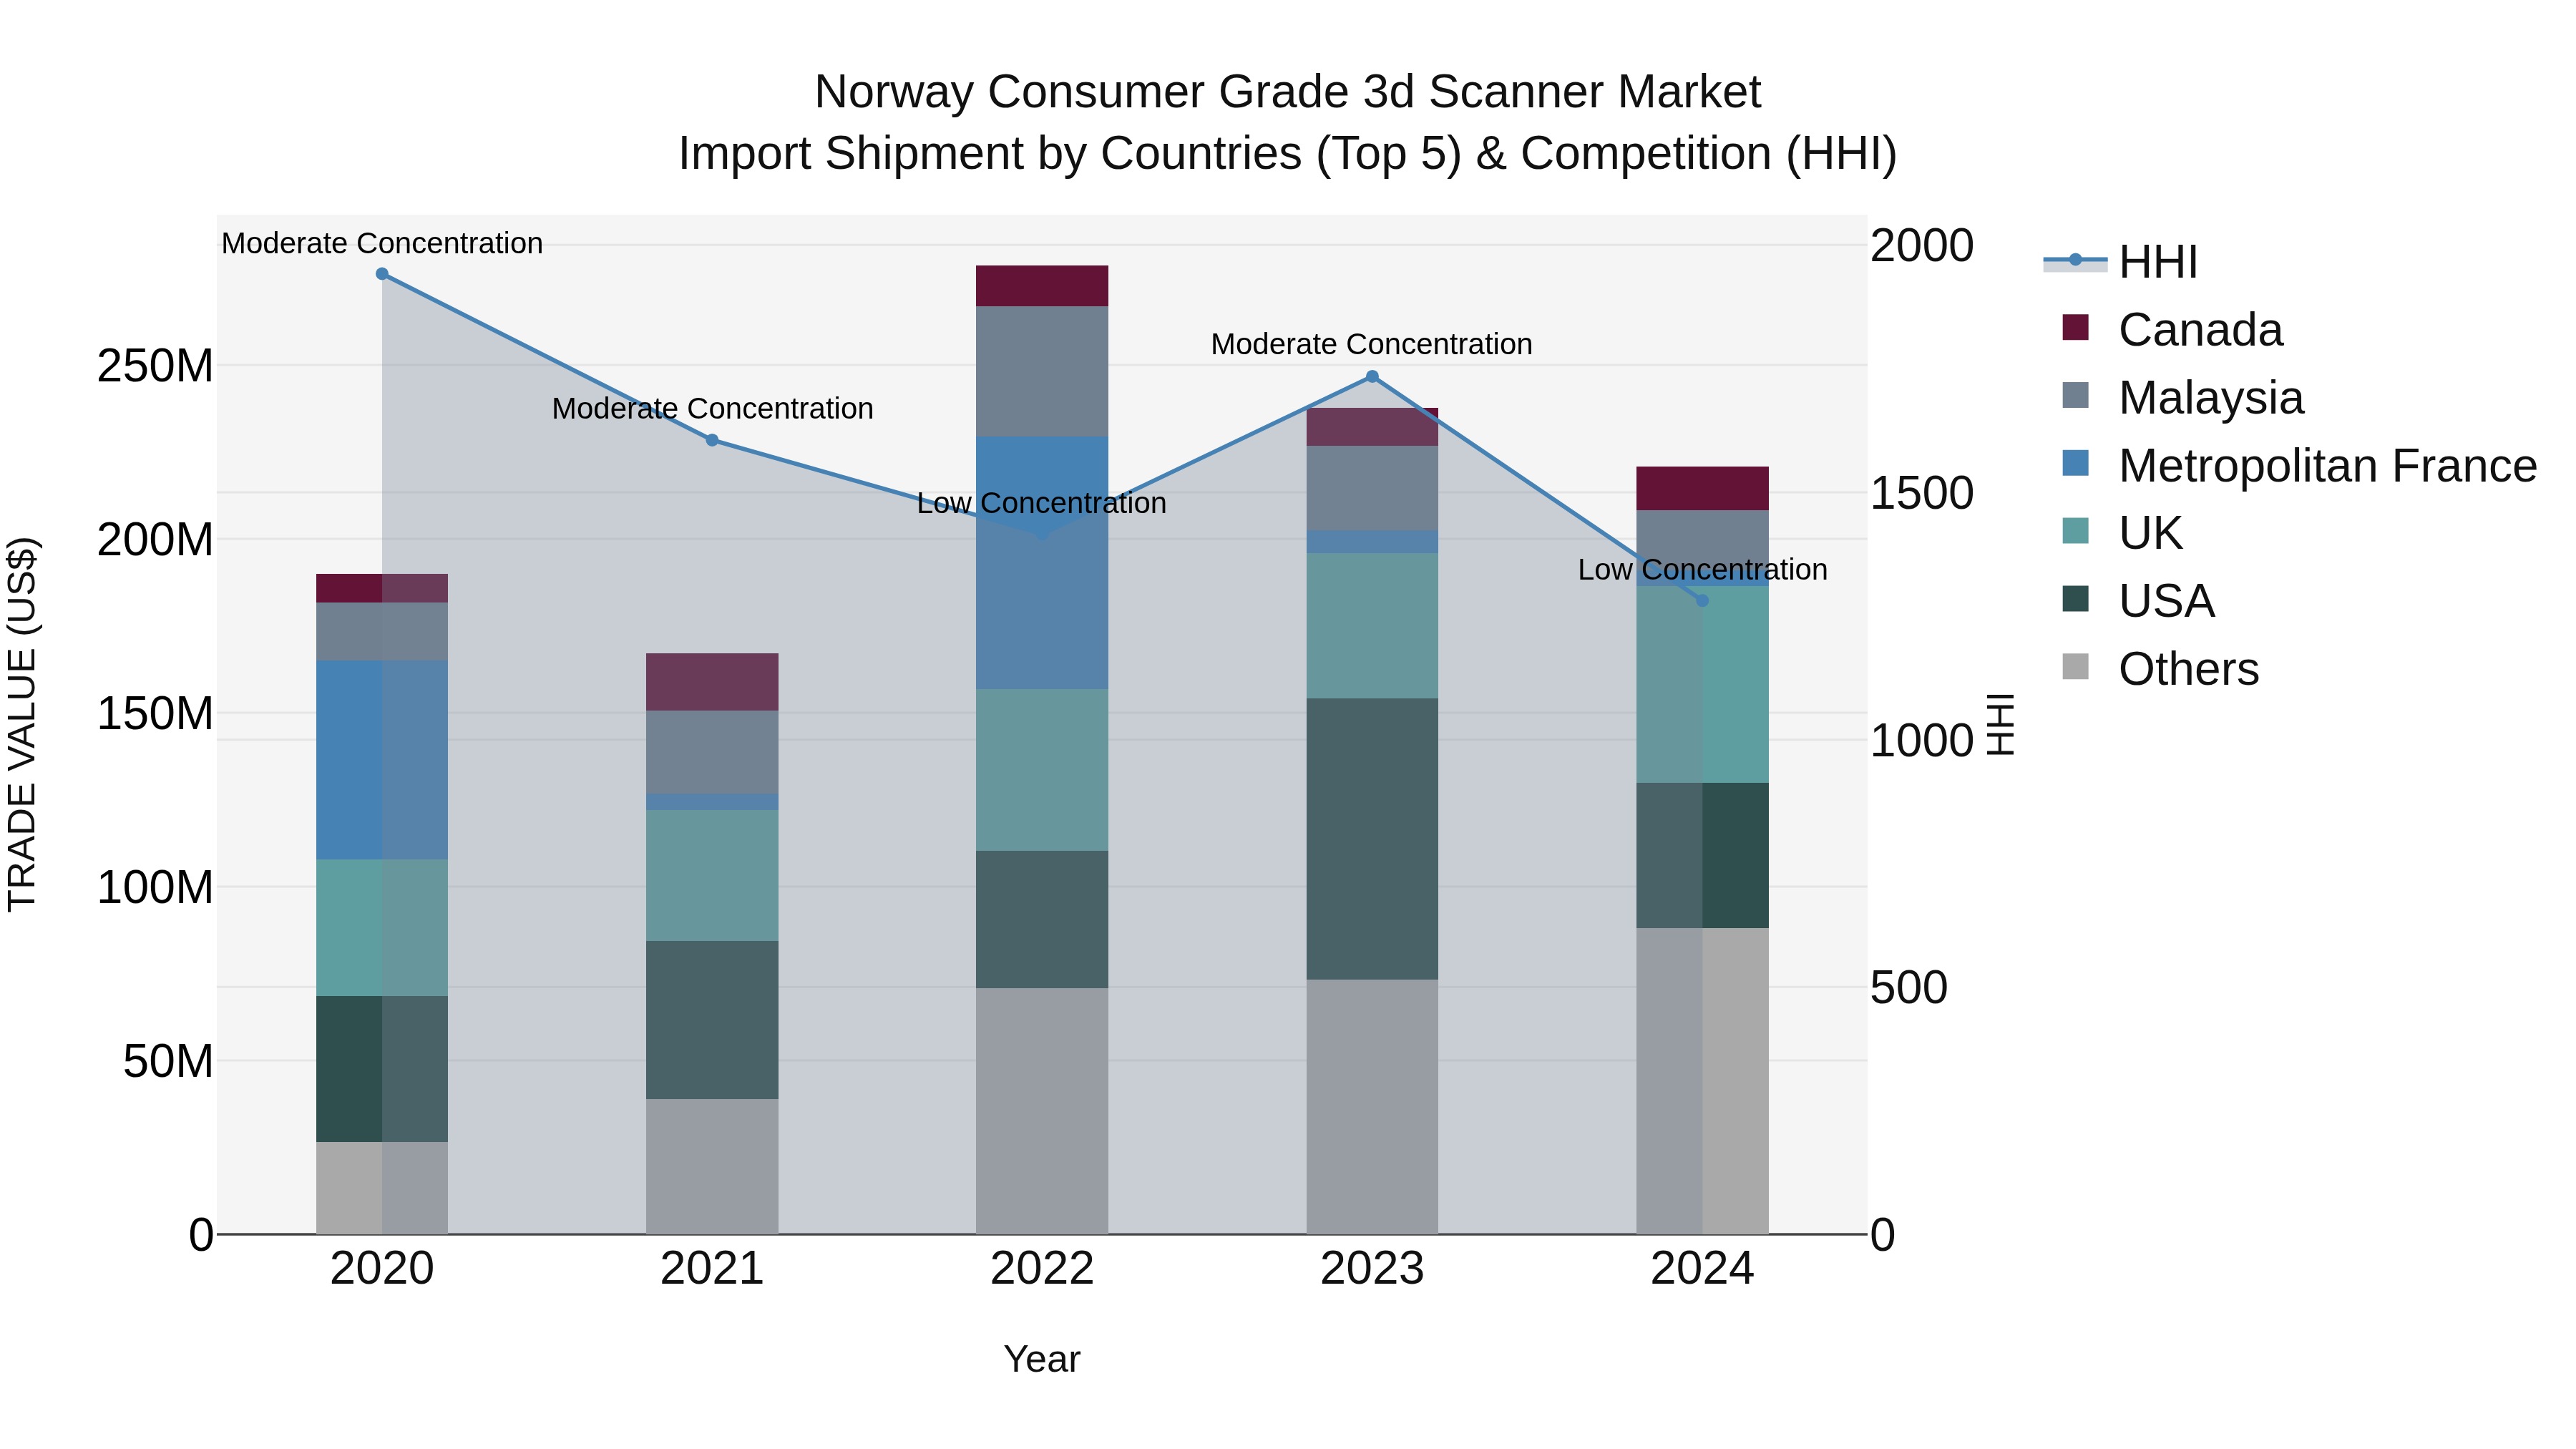
Norway Consumer Grade 3D Scanner Market Top 5 Importing Countries and Market Competition (HHI) Analysis
Norway`s consumer grade 3D scanner import market saw a shift in concentration levels from moderate to low in 2024, indicating increased diversification among suppliers. Despite a slight decline in growth rate in 2024, the market maintained a steady CAGR of 3.83% from 2020 to 2024. Key exporting countries such as the UK, USA, China, Malaysia, and Canada continued to play a significant role in supplying 3D scanners to Norway. The market dynamics suggest a competitive landscape with potential opportunities for further growth and innovation in the coming years.
Key Highlights of the Report:
- Norway Consumer Grade 3D Scanner Market Outlook
- Market Size of Norway Consumer Grade 3D Scanner Market, 2025
- Forecast of Norway Consumer Grade 3D Scanner Market, 2032
- Historical Data and Forecast of Norway Consumer Grade 3D Scanner Revenues & Volume for the Period 2022 - 2032
- Norway Consumer Grade 3D Scanner Market Trend Evolution
- Norway Consumer Grade 3D Scanner Market Drivers and Challenges
- Norway Consumer Grade 3D Scanner Price Trends
- Norway Consumer Grade 3D Scanner Porter's Five Forces
- Norway Consumer Grade 3D Scanner Industry Life Cycle
- Historical Data and Forecast of Norway Consumer Grade 3D Scanner Market Revenues & Volume By Offering for the Period 2022 - 2032
- Historical Data and Forecast of Norway Consumer Grade 3D Scanner Market Revenues & Volume By Hardware for the Period 2022 - 2032
- Historical Data and Forecast of Norway Consumer Grade 3D Scanner Market Revenues & Volume By Software and Solutions for the Period 2022 - 2032
- Historical Data and Forecast of Norway Consumer Grade 3D Scanner Market Revenues & Volume By Services for the Period 2022 - 2032
- Historical Data and Forecast of Norway Consumer Grade 3D Scanner Market Revenues & Volume By Range for the Period 2022 - 2032
- Historical Data and Forecast of Norway Consumer Grade 3D Scanner Market Revenues & Volume By Short-Range 3D Scanners for the Period 2022 - 2032
- Historical Data and Forecast of Norway Consumer Grade 3D Scanner Market Revenues & Volume By Medium-Range 3D Scanners for the Period 2022 - 2032
- Historical Data and Forecast of Norway Consumer Grade 3D Scanner Market Revenues & Volume By Type for the Period 2022 - 2032
- Historical Data and Forecast of Norway Consumer Grade 3D Scanner Market Revenues & Volume By Structured Light Scanners for the Period 2022 - 2032
- Historical Data and Forecast of Norway Consumer Grade 3D Scanner Market Revenues & Volume By 3D Laser Scanners for the Period 2022 - 2032
- Historical Data and Forecast of Norway Consumer Grade 3D Scanner Market Revenues & Volume By Hybrid 3D Scanners for the Period 2022 - 2032
- Historical Data and Forecast of Norway Consumer Grade 3D Scanner Market Revenues & Volume By Technology for the Period 2022 - 2032
- Historical Data and Forecast of Norway Consumer Grade 3D Scanner Market Revenues & Volume By Light Triangulation for the Period 2022 - 2032
- Historical Data and Forecast of Norway Consumer Grade 3D Scanner Market Revenues & Volume By Laser Triangulation for the Period 2022 - 2032
- Historical Data and Forecast of Norway Consumer Grade 3D Scanner Market Revenues & Volume By Pattern Fringe Triangulation for the Period 2022 - 2032
- Historical Data and Forecast of Norway Consumer Grade 3D Scanner Market Revenues & Volume By Laser Pulse Based for the Period 2022 - 2032
- Historical Data and Forecast of Norway Consumer Grade 3D Scanner Market Revenues & Volume By Application for the Period 2022 - 2032
- Historical Data and Forecast of Norway Consumer Grade 3D Scanner Market Revenues & Volume By Quality Control/Inspection for the Period 2022 - 2032
- Historical Data and Forecast of Norway Consumer Grade 3D Scanner Market Revenues & Volume By Reverse Engineering for the Period 2022 - 2032
- Historical Data and Forecast of Norway Consumer Grade 3D Scanner Market Revenues & Volume By Virtual Simulation for the Period 2022 - 2032
- Historical Data and Forecast of Norway Consumer Grade 3D Scanner Market Revenues & Volume By Others for the Period 2022 - 2032
- Historical Data and Forecast of Norway Consumer Grade 3D Scanner Market Revenues & Volume By Product for the Period 2022 - 2032
- Historical Data and Forecast of Norway Consumer Grade 3D Scanner Market Revenues & Volume By Handheld for the Period 2022 - 2032
- Historical Data and Forecast of Norway Consumer Grade 3D Scanner Market Revenues & Volume By Tripod Mounted for the Period 2022 - 2032
- Historical Data and Forecast of Norway Consumer Grade 3D Scanner Market Revenues & Volume By Desktop for the Period 2022 - 2032
- Historical Data and Forecast of Norway Consumer Grade 3D Scanner Market Revenues & Volume By End-Use for the Period 2022 - 2032
- Historical Data and Forecast of Norway Consumer Grade 3D Scanner Market Revenues & Volume By Additive Printing for the Period 2022 - 2032
- Historical Data and Forecast of Norway Consumer Grade 3D Scanner Market Revenues & Volume By Architects and Designers for the Period 2022 - 2032
- Historical Data and Forecast of Norway Consumer Grade 3D Scanner Market Revenues & Volume By Education and Research for the Period 2022 - 2032
- Historical Data and Forecast of Norway Consumer Grade 3D Scanner Market Revenues & Volume By Hobbyists for the Period 2022 - 2032
- Historical Data and Forecast of Norway Consumer Grade 3D Scanner Market Revenues & Volume By Arts for the Period 2022 - 2032
- Historical Data and Forecast of Norway Consumer Grade 3D Scanner Market Revenues & Volume By Digital Content Creation for the Period 2022 - 2032
- Historical Data and Forecast of Norway Consumer Grade 3D Scanner Market Revenues & Volume By Others for the Period 2022 - 2032
- Norway Consumer Grade 3D Scanner Import Export Trade Statistics
- Market Opportunity Assessment By Offering
- Market Opportunity Assessment By Range
- Market Opportunity Assessment By Type
- Market Opportunity Assessment By Technology
- Market Opportunity Assessment By Application
- Market Opportunity Assessment By Product
- Market Opportunity Assessment By End-Use
- Norway Consumer Grade 3D Scanner Top Companies Market Share
- Norway Consumer Grade 3D Scanner Competitive Benchmarking By Technical and Operational Parameters
- Norway Consumer Grade 3D Scanner Company Profiles
- Norway Consumer Grade 3D Scanner Key Strategic Recommendations
Frequently Asked Questions About the Market Study (FAQs):
6Wresearch actively monitors the Norway Consumer Grade 3D Scanner Market and publishes its comprehensive annual report, highlighting emerging trends, growth drivers, revenue analysis, and forecast outlook. Our insights help businesses to make data-backed strategic decisions with ongoing market dynamics. Our analysts track relevent industries related to the Norway Consumer Grade 3D Scanner Market, allowing our clients with actionable intelligence and reliable forecasts tailored to emerging regional needs.
Yes, we provide customisation as per your requirements. To learn more, feel free to contact us on sales@6wresearch.com
1 Executive Summary |
2 Introduction |
2.1 Key Highlights of the Report |
2.2 Report Description |
2.3 Market Scope & Segmentation |
2.4 Research Methodology |
2.5 Assumptions |
3 Norway Consumer Grade 3D Scanner Market Overview |
3.1 Norway Country Macro Economic Indicators |
3.2 Norway Consumer Grade 3D Scanner Market Revenues & Volume, 2022 & 2032F |
3.3 Norway Consumer Grade 3D Scanner Market - Industry Life Cycle |
3.4 Norway Consumer Grade 3D Scanner Market - Porter's Five Forces |
3.5 Norway Consumer Grade 3D Scanner Market Revenues & Volume Share, By Offering, 2022 & 2032F |
3.6 Norway Consumer Grade 3D Scanner Market Revenues & Volume Share, By Range, 2022 & 2032F |
3.7 Norway Consumer Grade 3D Scanner Market Revenues & Volume Share, By Type, 2022 & 2032F |
3.8 Norway Consumer Grade 3D Scanner Market Revenues & Volume Share, By Technology, 2022 & 2032F |
3.9 Norway Consumer Grade 3D Scanner Market Revenues & Volume Share, By Application, 2022 & 2032F |
3.10 Norway Consumer Grade 3D Scanner Market Revenues & Volume Share, By Product, 2022 & 2032F |
3.11 Norway Consumer Grade 3D Scanner Market Revenues & Volume Share, By End-Use, 2022 & 2032F |
4 Norway Consumer Grade 3D Scanner Market Dynamics |
4.1 Impact Analysis |
4.2 Market Drivers |
4.2.1 Increasing adoption of 3D printing technology in various industries |
4.2.2 Growing demand for customized and personalized products |
4.2.3 Technological advancements leading to improved accuracy and affordability of consumer-grade 3D scanners |
4.3 Market Restraints |
4.3.1 High initial cost of consumer-grade 3D scanners |
4.3.2 Limited awareness and knowledge about 3D scanning technology among consumers |
4.3.3 Lack of standardization and interoperability in the 3D scanning industry |
5 Norway Consumer Grade 3D Scanner Market Trends |
6 Norway Consumer Grade 3D Scanner Market, By Types |
6.1 Norway Consumer Grade 3D Scanner Market, By Offering |
6.1.1 Overview and Analysis |
6.1.2 Norway Consumer Grade 3D Scanner Market Revenues & Volume, By Offering, 2022 - 2032F |
6.1.3 Norway Consumer Grade 3D Scanner Market Revenues & Volume, By Hardware, 2022 - 2032F |
6.1.4 Norway Consumer Grade 3D Scanner Market Revenues & Volume, By Software and Solutions, 2022 - 2032F |
6.1.5 Norway Consumer Grade 3D Scanner Market Revenues & Volume, By Services, 2022 - 2032F |
6.2 Norway Consumer Grade 3D Scanner Market, By Range |
6.2.1 Overview and Analysis |
6.2.2 Norway Consumer Grade 3D Scanner Market Revenues & Volume, By Short-Range 3D Scanners, 2022 - 2032F |
6.2.3 Norway Consumer Grade 3D Scanner Market Revenues & Volume, By Medium-Range 3D Scanners, 2022 - 2032F |
6.3 Norway Consumer Grade 3D Scanner Market, By Type |
6.3.1 Overview and Analysis |
6.3.2 Norway Consumer Grade 3D Scanner Market Revenues & Volume, By Structured Light Scanners, 2022 - 2032F |
6.3.3 Norway Consumer Grade 3D Scanner Market Revenues & Volume, By 3D Laser Scanners, 2022 - 2032F |
6.3.4 Norway Consumer Grade 3D Scanner Market Revenues & Volume, By Hybrid 3D Scanners, 2022 - 2032F |
6.4 Norway Consumer Grade 3D Scanner Market, By Technology |
6.4.1 Overview and Analysis |
6.4.2 Norway Consumer Grade 3D Scanner Market Revenues & Volume, By Light Triangulation, 2022 - 2032F |
6.4.3 Norway Consumer Grade 3D Scanner Market Revenues & Volume, By Laser Triangulation, 2022 - 2032F |
6.4.4 Norway Consumer Grade 3D Scanner Market Revenues & Volume, By Pattern Fringe Triangulation, 2022 - 2032F |
6.4.5 Norway Consumer Grade 3D Scanner Market Revenues & Volume, By Laser Pulse Based, 2022 - 2032F |
6.5 Norway Consumer Grade 3D Scanner Market, By Application |
6.5.1 Overview and Analysis |
6.5.2 Norway Consumer Grade 3D Scanner Market Revenues & Volume, By Quality Control/Inspection, 2022 - 2032F |
6.5.3 Norway Consumer Grade 3D Scanner Market Revenues & Volume, By Reverse Engineering, 2022 - 2032F |
6.5.4 Norway Consumer Grade 3D Scanner Market Revenues & Volume, By Virtual Simulation, 2022 - 2032F |
6.5.5 Norway Consumer Grade 3D Scanner Market Revenues & Volume, By Others, 2022 - 2032F |
6.6 Norway Consumer Grade 3D Scanner Market, By Product |
6.6.1 Overview and Analysis |
6.6.2 Norway Consumer Grade 3D Scanner Market Revenues & Volume, By Handheld, 2022 - 2032F |
6.6.3 Norway Consumer Grade 3D Scanner Market Revenues & Volume, By Tripod Mounted, 2022 - 2032F |
6.6.4 Norway Consumer Grade 3D Scanner Market Revenues & Volume, By Desktop, 2022 - 2032F |
6.7 Norway Consumer Grade 3D Scanner Market, By End-Use |
6.7.1 Overview and Analysis |
6.7.2 Norway Consumer Grade 3D Scanner Market Revenues & Volume, By Additive Printing, 2022 - 2032F |
6.7.3 Norway Consumer Grade 3D Scanner Market Revenues & Volume, By Architects and Designers, 2022 - 2032F |
6.7.4 Norway Consumer Grade 3D Scanner Market Revenues & Volume, By Hobbyists, 2022 - 2032F |
6.7.5 Norway Consumer Grade 3D Scanner Market Revenues & Volume, By Hobbyists, 2022 - 2032F |
6.7.6 Norway Consumer Grade 3D Scanner Market Revenues & Volume, By Arts, 2022 - 2032F |
6.7.7 Norway Consumer Grade 3D Scanner Market Revenues & Volume, By Digital Content Creation, 2022 - 2032F |
7 Norway Consumer Grade 3D Scanner Market Import-Export Trade Statistics |
7.1 Norway Consumer Grade 3D Scanner Market Export to Major Countries |
7.2 Norway Consumer Grade 3D Scanner Market Imports from Major Countries |
8 Norway Consumer Grade 3D Scanner Market Key Performance Indicators |
8.1 Average cost per scan |
8.2 Adoption rate of 3D scanning technology in different industries |
8.3 Number of new applications utilizing consumer-grade 3D scanners |
8.4 Average time taken for scanning and processing 3D images |
8.5 Customer satisfaction and feedback on the usability and performance of consumer-grade 3D scanners |
9 Norway Consumer Grade 3D Scanner Market - Opportunity Assessment |
9.1 Norway Consumer Grade 3D Scanner Market Opportunity Assessment, By Offering, 2022 & 2032F |
9.2 Norway Consumer Grade 3D Scanner Market Opportunity Assessment, By Range, 2022 & 2032F |
9.3 Norway Consumer Grade 3D Scanner Market Opportunity Assessment, By Type, 2022 & 2032F |
9.4 Norway Consumer Grade 3D Scanner Market Opportunity Assessment, By Technology, 2022 & 2032F |
9.5 Norway Consumer Grade 3D Scanner Market Opportunity Assessment, By Application, 2022 & 2032F |
9.6 Norway Consumer Grade 3D Scanner Market Opportunity Assessment, By Product, 2022 & 2032F |
9.7 Norway Consumer Grade 3D Scanner Market Opportunity Assessment, By End-Use, 2022 & 2032F |
10 Norway Consumer Grade 3D Scanner Market - Competitive Landscape |
10.1 Norway Consumer Grade 3D Scanner Market Revenue Share, By Companies, 2025 |
10.2 Norway Consumer Grade 3D Scanner Market Competitive Benchmarking, By Operating and Technical Parameters |
11 Company Profiles |
12 Recommendations |
13 Disclaimer |
Global Go To Market Strategy - 2030
Export potential enables firms to identify high-growth global markets with greater confidence by combining advanced trade intelligence with a structured quantitative methodology. The framework analyzes emerging demand trends and country-level import patterns while integrating macroeconomic and trade datasets such as GDP and population forecasts, bilateral import–export flows, tariff structures, elasticity differentials between developed and developing economies, geographic distance, and import demand projections. Using weighted trade values from 2020–2024 as the base period to project country-to-country export potential for 2030, these inputs are operationalized through calculated drivers such as gravity model parameters, tariff impact factors, and projected GDP per-capita growth. Through an analysis of hidden potentials, demand hotspots, and market conditions that are most favorable to success, this method enables firms to focus on target countries, maximize returns, and global expansion with data, backed by accuracy.
By factoring in the projected importer demand gap that is currently unmet and could be potential opportunity, it identifies the potential for the Exporter (Country) among 190 countries, against the general trade analysis, which identifies the biggest importer or exporter.
To discover high-growth global markets and optimize your business strategy:
Click Here
Pricing
- Single User License$ 1,995
- Department License$ 2,400
- Site License$ 3,120
- Global License$ 3,795

Leadership Perspectives from Industry Events
Search
Thought Leadership and Analyst Meet


Our Clients
6WResearch In News
- Doha a strategic location for EV manufacturing hub: IPA Qatar
- Demand for luxury TVs surging in the GCC, says Samsung
- Empowering Growth: The Thriving Journey of Bangladesh’s Cable Industry
- Demand for luxury TVs surging in the GCC, says Samsung
- Video call with a traditional healer? Once unthinkable, it’s now common in South Africa
- Intelligent Buildings To Smooth GCC’s Path To Net Zero
Latest Reports
- Cape Verde Portable Hand-Thrown Extinguisher Market (2026-2032)
- Canada Portable Hand-Thrown Extinguisher Market (2026-2032)
- Cameroon Portable Hand-Thrown Extinguisher Market (2026-2032)
- Burundi Portable Hand-Thrown Extinguisher Market (2026-2032)
- Burkina Faso Portable Hand-Thrown Extinguisher Market (2026-2032)
- Bulgaria Portable Hand-Thrown Extinguisher Market (2026-2032)
- Brunei Portable Hand-Thrown Extinguisher Market (2026-2032)
- Botswana Portable Hand-Thrown Extinguisher Market (2026-2032)
- Bosnia and Herzegovina Portable Hand-Thrown Extinguisher Market (2026-2032)
- Bolivia Portable Hand-Thrown Extinguisher Market (2026-2032)
Industry Events and Analyst Meet

HIMTEX 2026

India Refining Summit 2026

India EV Show 2026

EV tech India Expo 2026

Auto Tech Asia 2026
Whitepaper
- Middle East & Africa Commercial Security Market Click here to view more.
- Middle East & Africa Fire Safety Systems & Equipment Market Click here to view more.
- GCC Drone Market Click here to view more.
- Middle East Lighting Fixture Market Click here to view more.
- GCC Physical & Perimeter Security Market Click here to view more.