Oman Inorganic Pigments Market (2026-2032) Outlook | Share, Companies, Size, Analysis, Trends, Revenue, Value, Industry, Forecast & Growth
Market Forecast By Type (Titanium Dioxide, Iron Oxide, Cadmium, Carbon Blank, Lead Chromate, Chromium Oxide, Others), By Colour (Red, Yellow, Orange, Green, Blue, Black, White, Others), By Chemistry (Oxide, Silicate, Carbonate, Sulphate, Sulphide, Others), By Grade (Food Grade, Pharmaceutical Grade, Industrial Grade, Others), By Form (Powder, Liquid), By Application (Plastics, Paints & Coatings, Printing Inks, Glass & Ceramics, Cosmetics, Paper Industry, Food Industry, Others) And Competitive Landscape
| Product Code: ETC190555 | Publication Date: May 2022 | Updated Date: Jun 2026 | Product Type: Market Research Report | |
| Publisher: 6Wresearch | Author: Ravi Bhandari | No. of Pages: 60 | No. of Figures: 40 | No. of Tables: 7 |
Oman Inorganic Pigments Market Size, Share & Growth Rate
The Oman Inorganic Pigments Market was estimated at USD 169 Million in 2025 and is projected to reach USD 234 Million by 2032, growing at a CAGR of 4.8% from 2026 to 2032. This growth trajectory is fueled largely by increasing demand from the construction and automotive sectors, both of which require high-performance pigments for enhanced durability and visual appeal. The emphasis on sustainable and eco-friendly production methods further amplifies the market’s potential, positioning Oman as a competitive player in the global inorganic pigments landscape.
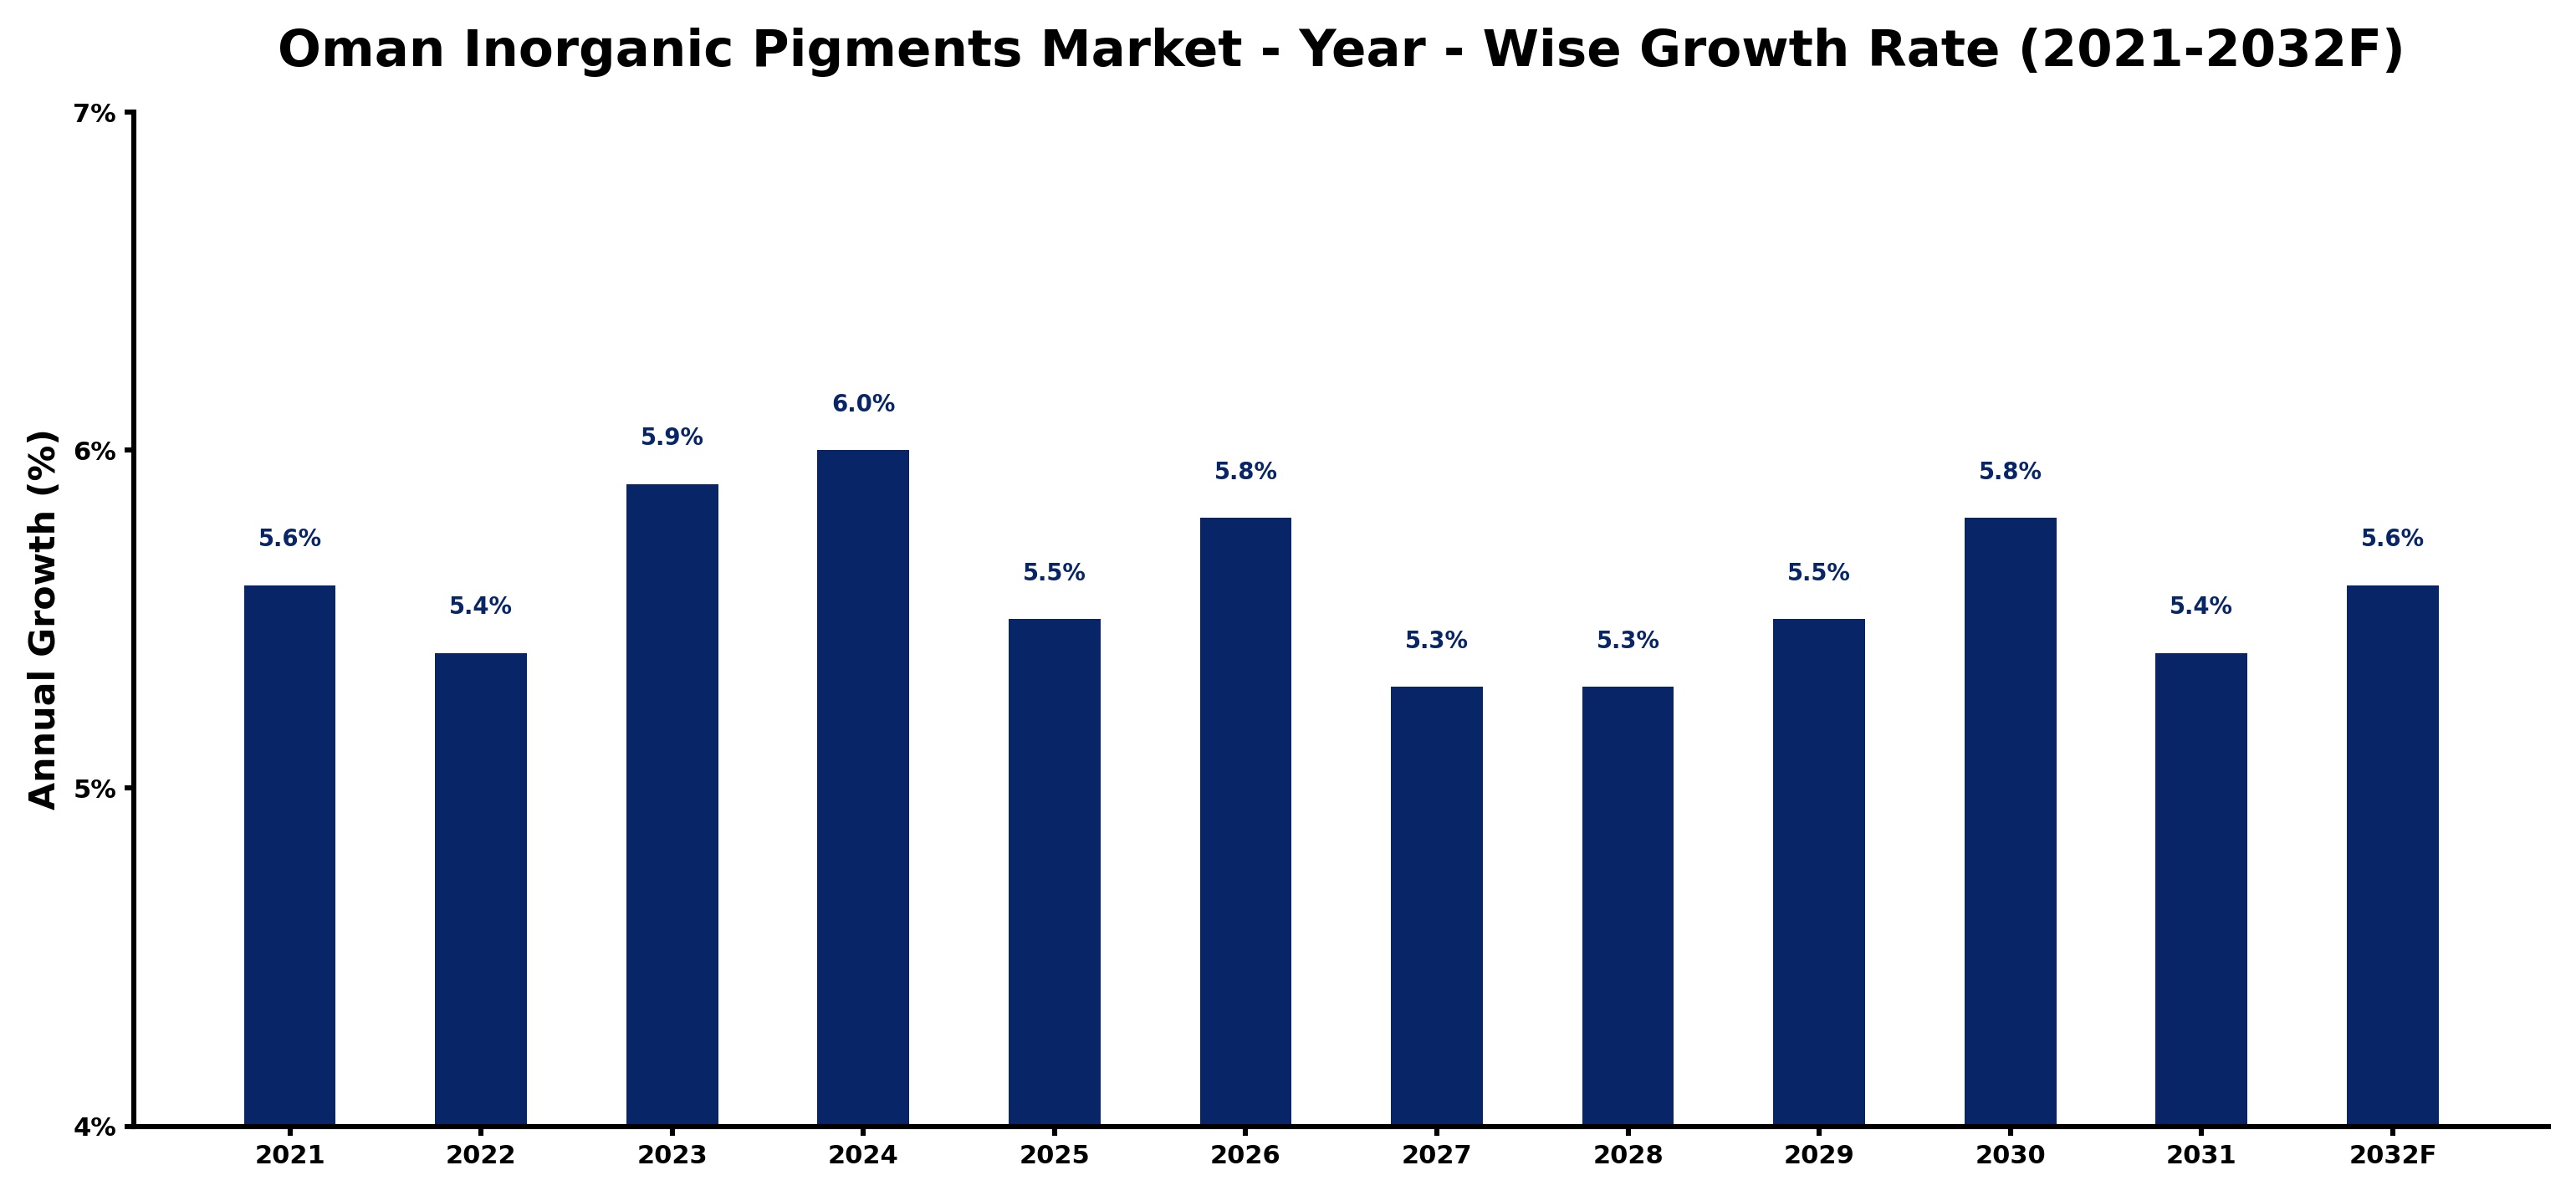
Oman Inorganic Pigments Market Growth Rate Analysis (2021-2032)
The Oman inorganic pigments market has exhibited a steady growth trend, with an annual increase of 5.6% in 2021, slightly tapering to 5.4% in 2022. However, a renewed upward trajectory occurred in 2023, reaching 5.9%, attributed to heightened demand from the construction and automotive sectors, which are expanding due to government infrastructure initiatives. A projected growth of 6.0% in 2024 reflects continued investment in energy-efficient technologies and sustainable practices. Despite minor fluctuations anticipated through to 2032, with rates varying between 5.3% to 5.8%, the underlying consumer demand for high-performance pigments remains robust, driven by technological advancements and environmental regulations encouraging greener applications.
Oman Inorganic Pigments Market Year-wise Growth Rate and Key Drivers
This graph highlights how the Oman Inorganic Pigments Market has steadily grown over the years, supported by major growth factors.
The table below presents the year‑wise growth rates along with the key drivers influencing the market
| Year | Growth Rate | Major Drivers |
| 2021 | 5.6% | Construction sector demand increased |
| 2022 | 5.4% | Automotive industry growth accelerated |
| 2023 | 5.9% | Paint and coatings market expanded |
| 2024 | 6.0% | Infrastructure projects stimulated demand |
| 2025 | 5.5% | Consumer goods sector thrived significantly |
| 2026 | 5.8% | Sustainable products gained popularity |
| 2027 | 5.3% | Technological advancements enhanced production |
| 2028 | 5.3% | Export opportunities broadened market reach |
| 2029 | 5.5% | Regulatory support encouraged innovation |
| 2030 | 5.8% | Market diversification attracted investments |
| 2031 | 5.4% | Local manufacturing capabilities improved |
| 2032 | 5.6% | Environmental awareness drove preferences |
Note - Market size estimations and growth projections presented in this report are based on 6Wresearch’s advanced forecasting approach, validated with industry datasets as of June 2026.
Oman Inorganic Pigments Market Synopsis
In Oman, the inorganic pigments market is characterized by a notable demand for color stability and resistance to environmental factors, which are critical in the construction and coatings industries. The shift towards high-quality, sustainable pigments underscores a growing awareness among manufacturers regarding environmental regulations and consumer preferences.
Furthermore, technological advancements in pigment production are enabling manufacturers to meet the stringent quality standards set forth by various industries. This not only enhances product offerings but also strengthens the competitive position of Omani suppliers in regional and international markets.
Oman Inorganic Pigments Market Key Takeaways
- The market is predominantly driven by growth in the construction and automotive sectors.
- Government policies are actively promoting environmentally friendly pigment production.
- There is a rising demand for high-performance pigments that offer durability and color stability.
- Technological advancements are facilitating the development of innovative pigment solutions.
- Environmental compliance is becoming increasingly important for manufacturers in this sector.
Evaluation of Restraints in Oman Inorganic Pigments Market
Despite the promising growth, the Oman Inorganic Pigments Market faces several restraints that could temper its expansion. One significant challenge is ensuring pigment color consistency and stability across different production batches, which can lead to inconsistencies in end products. Additionally, manufacturers must navigate a complex landscape of environmental regulations that govern pigment production processes. These regulations often impose strict limits on emissions and waste, requiring companies to invest in compliance technologies and practices. Meeting these industry-specific performance requirements adds further complexity, as businesses strive to balance quality with regulatory adherence.
Oman Inorganic Pigments Market Trends
Current trends in the Oman Inorganic Pigments Market include an increasing focus on sustainability and eco-friendly production techniques. As awareness of environmental issues grows, manufacturers are integrating greener practices into their operations. This not only enhances the appeal of their products but also aligns with global efforts toward sustainability. Another trend is the rise of digitalization in production processes, facilitating real-time quality control and efficiency improvements. Moreover, the ongoing development of advanced pigment formulations that enhance performance in coatings and plastics is shaping the future of this market.
Oman Inorganic Pigments Market Opportunities
Opportunities for growth in the Oman Inorganic Pigments Market are manifold. The burgeoning construction industry in Oman is a major catalyst, with investments in infrastructure projects creating heightened demand for high-performance pigments. Additionally, the automotive sector is exploring innovative applications for inorganic pigments, enhancing vehicle aesthetics while ensuring durability. Collaboration with research institutions to develop novel pigment technologies can further drive market expansion. As the global focus shifts toward sustainability, there is also a growing market for eco-friendly inorganic pigments, offering companies a chance to differentiate their products and capture a larger market share.
Government Initiatives in the Oman Inorganic Pigments Market
The government of Oman is taking proactive steps to bolster the inorganic pigments market through various initiatives. Policies encouraging the production of high-quality, environmentally friendly pigments are being implemented, including financial incentives aimed at manufacturers. These initiatives support research and development for innovative pigment technologies while setting stringent regulatory standards for product quality and environmental compliance. By advocating the use of inorganic pigments in critical sectors such as paints, coatings, and plastics, the government is enhancing both product quality and sustainability in the market.
Future Insights of the Oman Inorganic Pigments Market
Looking ahead to 2026-2032, the Oman Inorganic Pigments Market is expected to continue its upward trajectory, propelled by an expanding construction sector and evolving automotive applications. The increasing demand for sustainable pigments will likely drive innovations and investments in greener production methods. Furthermore, enhanced collaboration between industry stakeholders and academic institutions may yield groundbreaking developments in pigment technology, paving the way for new applications and market segments. As Oman's infrastructure projects ramp up, the inorganic pigments market stands to benefit from sustained growth and diversification.
Oman Inorganic Pigments Market Latest Developments (May 2025 - June 2026)
Recent developments in the Oman Inorganic Pigments Market indicate a concerted push towards innovation and sustainability. Companies are increasingly adopting advanced production technologies to enhance the quality and performance of their pigment offerings. Additionally, partnerships aimed at research into eco-friendly alternatives are becoming more common, reflecting the market's commitment to reducing environmental impacts. Investments in local manufacturing capabilities are expected to rise, driven by both domestic demand and export opportunities. This evolving landscape showcases the dynamic nature of the market as it adapts to both local and global trends.
Oman Inorganic Pigments Market - Key Attractiveness of the Report
- 10 Years of Market Numbers
- Historical Data Starting from 2022 to 2025
- Base Year: 2025
- Forecast Data until 2032
- Key Performance Indicators Impacting the Market
- Major Upcoming Developments and Projects
Key Highlights of the Report:
- Oman Inorganic Pigments Market Outlook
- Market Size of Oman Inorganic Pigments Market, 2025
- Forecast of Oman Inorganic Pigments Market, 2032
- Historical Data and Forecast of Oman Inorganic Pigments Revenues & Volume for the Period 2022-2032F
- Oman Inorganic Pigments Market Trend Evolution
- Oman Inorganic Pigments Market Drivers and Challenges
- Oman Inorganic Pigments Price Trends
- Oman Inorganic Pigments Porter's Five Forces
- Oman Inorganic Pigments Industry Life Cycle
- Historical Data and Forecast of Oman Inorganic Pigments Market Revenues & Volume By Type for the Period 2022-2032F
- Historical Data and Forecast of Oman Inorganic Pigments Market Revenues & Volume By Titanium Dioxide for the Period 2022-2032F
- Historical Data and Forecast of Oman Inorganic Pigments Market Revenues & Volume By Iron Oxide, Cadmium for the Period 2022-2032F
- Historical Data and Forecast of Oman Inorganic Pigments Market Revenues & Volume By Carbon Blank for the Period 2022-2032F
- Historical Data and Forecast of Oman Inorganic Pigments Market Revenues & Volume By Lead Chromate for the Period 2022-2032F
- Historical Data and Forecast of Oman Inorganic Pigments Market Revenues & Volume By Chromium Oxide for the Period 2022-2032F
- Historical Data and Forecast of Oman Inorganic Pigments Market Revenues & Volume By Others for the Period 2022-2032F
- Historical Data and Forecast of Oman Inorganic Pigments Market Revenues & Volume By Colour for the Period 2022-2032F
- Historical Data and Forecast of Oman Inorganic Pigments Market Revenues & Volume By Red for the Period 2022-2032F
- Historical Data and Forecast of Oman Inorganic Pigments Market Revenues & Volume By Yellow for the Period 2022-2032F
- Historical Data and Forecast of Oman Inorganic Pigments Market Revenues & Volume By Orange for the Period 2022-2032F
- Historical Data and Forecast of Oman Inorganic Pigments Market Revenues & Volume By Green for the Period 2022-2032F
- Historical Data and Forecast of Oman Inorganic Pigments Market Revenues & Volume By Blue for the Period 2022-2032F
- Historical Data and Forecast of Oman Inorganic Pigments Market Revenues & Volume By Black for the Period 2022-2032F
- Historical Data and Forecast of Oman Inorganic Pigments Market Revenues & Volume By White for the Period 2022-2032F
- Historical Data and Forecast of Oman Inorganic Pigments Market Revenues & Volume By Others for the Period 2022-2032F
- Historical Data and Forecast of Oman Inorganic Pigments Market Revenues & Volume By Chemistry for the Period 2022-2032F
- Historical Data and Forecast of Oman Inorganic Pigments Market Revenues & Volume By Oxide for the Period 2022-2032F
- Historical Data and Forecast of Oman Inorganic Pigments Market Revenues & Volume By Silicate for the Period 2022-2032F
- Historical Data and Forecast of Oman Inorganic Pigments Market Revenues & Volume By Carbonate for the Period 2022-2032F
- Historical Data and Forecast of Oman Inorganic Pigments Market Revenues & Volume By Sulphate for the Period 2022-2032F
- Historical Data and Forecast of Oman Inorganic Pigments Market Revenues & Volume By Sulphide for the Period 2022-2032F
- Historical Data and Forecast of Oman Inorganic Pigments Market Revenues & Volume By Others for the Period 2022-2032F
- Historical Data and Forecast of Oman Inorganic Pigments Market Revenues & Volume By Grade for the Period 2022-2032F
- Historical Data and Forecast of Oman Inorganic Pigments Market Revenues & Volume By Food Grade for the Period 2022-2032F
- Historical Data and Forecast of Oman Inorganic Pigments Market Revenues & Volume By Pharmaceutical Grade for the Period 2022-2032F
- Historical Data and Forecast of Oman Inorganic Pigments Market Revenues & Volume By Industrial Grade for the Period 2022-2032F
- Historical Data and Forecast of Oman Inorganic Pigments Market Revenues & Volume By Others for the Period 2022-2032F
- Historical Data and Forecast of Oman Inorganic Pigments Market Revenues & Volume By Form for the Period 2022-2032F
- Historical Data and Forecast of Oman Inorganic Pigments Market Revenues & Volume By Powder for the Period 2022-2032F
- Historical Data and Forecast of Oman Inorganic Pigments Market Revenues & Volume By Liquid for the Period 2022-2032F
- Historical Data and Forecast of Oman Inorganic Pigments Market Revenues & Volume By Application for the Period 2022-2032F
- Historical Data and Forecast of Oman Inorganic Pigments Market Revenues & Volume By Plastics for the Period 2022-2032F
- Historical Data and Forecast of Oman Inorganic Pigments Market Revenues & Volume By Paints & Coatings for the Period 2022-2032F
- Historical Data and Forecast of Oman Inorganic Pigments Market Revenues & Volume By Printing Inks for the Period 2022-2032F
- Historical Data and Forecast of Oman Inorganic Pigments Market Revenues & Volume By Glass & Ceramics for the Period 2022-2032F
- Historical Data and Forecast of Oman Inorganic Pigments Market Revenues & Volume By Cosmetics for the Period 2022-2032F
- Historical Data and Forecast of Oman Inorganic Pigments Market Revenues & Volume By Paper Industry for the Period 2022-2032F
- Historical Data and Forecast of Oman Inorganic Pigments Market Revenues & Volume By Food Industry for the Period 2022-2032F
- Historical Data and Forecast of Oman Inorganic Pigments Market Revenues & Volume By Others for the Period 2022-2032F
- Oman Inorganic Pigments Import Export Trade Statistics
- Market Opportunity Assessment By Type
- Market Opportunity Assessment By Colour
- Market Opportunity Assessment By Chemistry
- Market Opportunity Assessment By Grade
- Market Opportunity Assessment By Form
- Market Opportunity Assessment By Application
- Oman Inorganic Pigments Top Companies Market Share
- Oman Inorganic Pigments Competitive Benchmarking By Technical and Operational Parameters
- Oman Inorganic Pigments Company Profiles
- Oman Inorganic Pigments Key Strategic Recommendations
Oman Inorganic Pigments Market - Frequently Asked Questions
The growth is primarily driven by the burgeoning construction and automotive sectors, which demand high-performance pigments for their applications.
The market is projected to grow from USD 169 Million in 2025 to USD 234 Million by 2032, reflecting a CAGR of 4.8% from 2026 to 2032, bolstered by technological advancements and increasing demand.
Key challenges include ensuring color consistency and stability, complying with environmental regulations, and meeting the evolving performance standards set by industries.
Yes, the Omani government has introduced policies to promote high-quality, eco-friendly pigment production, offering financial incentives and regulatory standards.
Technological innovations are enhancing pigment production processes, improving quality, and allowing manufacturers to meet industry standards while reducing environmental impact.
Opportunities lie in expanding manufacturing capabilities, exploring new applications in the automotive sector, and developing sustainable pigment solutions to meet changing consumer preferences.
6Wresearch actively monitors the Oman Inorganic Pigments Market and publishes its comprehensive annual report, highlighting emerging trends, growth drivers, revenue analysis, and forecast outlook. Our insights help businesses to make data-backed strategic decisions with ongoing market dynamics. Our analysts track relevent industries related to the Oman Inorganic Pigments Market, allowing our clients with actionable intelligence and reliable forecasts tailored to emerging regional needs.
Yes, we provide customisation as per your requirements. To learn more, feel free to contact us on sales@6wresearch.com
1 Executive Summary |
2 Introduction |
2.1 Key Highlights of the Report |
2.2 Report Description |
2.3 Market Scope & Segmentation |
2.4 Research Methodology |
2.5 Assumptions |
3 Oman Inorganic Pigments Market Overview |
3.1 Oman Country Macro Economic Indicators |
3.2 Oman Inorganic Pigments Market Revenues & Volume, 2022 & 2032F |
3.3 Oman Inorganic Pigments Market - Industry Life Cycle |
3.4 Oman Inorganic Pigments Market - Porter's Five Forces |
3.5 Oman Inorganic Pigments Market Revenues & Volume Share, By Type, 2022 & 2032F |
3.6 Oman Inorganic Pigments Market Revenues & Volume Share, By Colour, 2022 & 2032F |
3.7 Oman Inorganic Pigments Market Revenues & Volume Share, By Chemistry, 2022 & 2032F |
3.8 Oman Inorganic Pigments Market Revenues & Volume Share, By Grade, 2022 & 2032F |
3.9 Oman Inorganic Pigments Market Revenues & Volume Share, By Form, 2022 & 2032F |
3.10 Oman Inorganic Pigments Market Revenues & Volume Share, By Application, 2022 & 2032F |
4 Oman Inorganic Pigments Market Dynamics |
4.1 Impact Analysis |
4.2 Market Drivers |
4.2.1 Growing demand for inorganic pigments in various industries such as construction, automotive, and packaging |
4.2.2 Increasing investments in infrastructure projects in Oman |
4.2.3 Rising focus on eco-friendly and sustainable pigments |
4.3 Market Restraints |
4.3.1 Fluctuating raw material prices |
4.3.2 Stringent regulations related to the use of certain inorganic pigments |
4.3.3 Competition from alternative organic pigments |
5 Oman Inorganic Pigments Market Trends |
6 Oman Inorganic Pigments Market, By Types |
6.1 Oman Inorganic Pigments Market, By Type |
6.1.1 Overview and Analysis |
6.1.2 Oman Inorganic Pigments Market Revenues & Volume, By Type, 2022-2032F |
6.1.3 Oman Inorganic Pigments Market Revenues & Volume, By Titanium Dioxide, 2022-2032F |
6.1.4 Oman Inorganic Pigments Market Revenues & Volume, By Iron Oxide, Cadmium, 2022-2032F |
6.1.5 Oman Inorganic Pigments Market Revenues & Volume, By Carbon Blank, 2022-2032F |
6.1.6 Oman Inorganic Pigments Market Revenues & Volume, By Lead Chromate, 2022-2032F |
6.1.7 Oman Inorganic Pigments Market Revenues & Volume, By Chromium Oxide, 2022-2032F |
6.1.8 Oman Inorganic Pigments Market Revenues & Volume, By Others, 2022-2032F |
6.2 Oman Inorganic Pigments Market, By Colour |
6.2.1 Overview and Analysis |
6.2.2 Oman Inorganic Pigments Market Revenues & Volume, By Red, 2022-2032F |
6.2.3 Oman Inorganic Pigments Market Revenues & Volume, By Yellow, 2022-2032F |
6.2.4 Oman Inorganic Pigments Market Revenues & Volume, By Orange, 2022-2032F |
6.2.5 Oman Inorganic Pigments Market Revenues & Volume, By Green, 2022-2032F |
6.2.6 Oman Inorganic Pigments Market Revenues & Volume, By Blue, 2022-2032F |
6.2.7 Oman Inorganic Pigments Market Revenues & Volume, By Black, 2022-2032F |
6.2.8 Oman Inorganic Pigments Market Revenues & Volume, By Others, 2022-2032F |
6.2.9 Oman Inorganic Pigments Market Revenues & Volume, By Others, 2022-2032F |
6.3 Oman Inorganic Pigments Market, By Chemistry |
6.3.1 Overview and Analysis |
6.3.2 Oman Inorganic Pigments Market Revenues & Volume, By Oxide, 2022-2032F |
6.3.3 Oman Inorganic Pigments Market Revenues & Volume, By Silicate, 2022-2032F |
6.3.4 Oman Inorganic Pigments Market Revenues & Volume, By Carbonate, 2022-2032F |
6.3.5 Oman Inorganic Pigments Market Revenues & Volume, By Sulphate, 2022-2032F |
6.3.6 Oman Inorganic Pigments Market Revenues & Volume, By Sulphide, 2022-2032F |
6.3.7 Oman Inorganic Pigments Market Revenues & Volume, By Others, 2022-2032F |
6.4 Oman Inorganic Pigments Market, By Grade |
6.4.1 Overview and Analysis |
6.4.2 Oman Inorganic Pigments Market Revenues & Volume, By Food Grade, 2022-2032F |
6.4.3 Oman Inorganic Pigments Market Revenues & Volume, By Pharmaceutical Grade, 2022-2032F |
6.4.4 Oman Inorganic Pigments Market Revenues & Volume, By Industrial Grade, 2022-2032F |
6.4.5 Oman Inorganic Pigments Market Revenues & Volume, By Others, 2022-2032F |
6.5 Oman Inorganic Pigments Market, By Form |
6.5.1 Overview and Analysis |
6.5.2 Oman Inorganic Pigments Market Revenues & Volume, By Powder, 2022-2032F |
6.5.3 Oman Inorganic Pigments Market Revenues & Volume, By Liquid, 2022-2032F |
6.6 Oman Inorganic Pigments Market, By Application |
6.6.1 Overview and Analysis |
6.6.2 Oman Inorganic Pigments Market Revenues & Volume, By Plastics, 2022-2032F |
6.6.3 Oman Inorganic Pigments Market Revenues & Volume, By Paints & Coatings, 2022-2032F |
6.6.4 Oman Inorganic Pigments Market Revenues & Volume, By Printing Inks, 2022-2032F |
6.6.5 Oman Inorganic Pigments Market Revenues & Volume, By Glass & Ceramics, 2022-2032F |
6.6.6 Oman Inorganic Pigments Market Revenues & Volume, By Cosmetics, 2022-2032F |
6.6.7 Oman Inorganic Pigments Market Revenues & Volume, By Paper Industry, 2022-2032F |
6.6.8 Oman Inorganic Pigments Market Revenues & Volume, By Others, 2022-2032F |
6.6.9 Oman Inorganic Pigments Market Revenues & Volume, By Others, 2022-2032F |
7 Oman Inorganic Pigments Market Import-Export Trade Statistics |
7.1 Oman Inorganic Pigments Market Export to Major Countries |
7.2 Oman Inorganic Pigments Market Imports from Major Countries |
8 Oman Inorganic Pigments Market Key Performance Indicators |
8.1 Research and development investment in new pigment technologies |
8.2 Number of strategic partnerships and collaborations in the pigment industry |
8.3 Adoption rate of sustainable and eco-friendly pigment products |
8.4 Number of patents filed for innovative pigment formulations |
8.5 Growth rate of end-user industries consuming inorganic pigments |
9 Oman Inorganic Pigments Market - Opportunity Assessment |
9.1 Oman Inorganic Pigments Market Opportunity Assessment, By Type, 2022 & 2032F |
9.2 Oman Inorganic Pigments Market Opportunity Assessment, By Colour, 2022 & 2032F |
9.3 Oman Inorganic Pigments Market Opportunity Assessment, By Chemistry, 2022 & 2032F |
9.4 Oman Inorganic Pigments Market Opportunity Assessment, By Grade, 2022 & 2032F |
9.5 Oman Inorganic Pigments Market Opportunity Assessment, By Form, 2022 & 2032F |
9.6 Oman Inorganic Pigments Market Opportunity Assessment, By Application, 2022 & 2032F |
10 Oman Inorganic Pigments Market - Competitive Landscape |
10.1 Oman Inorganic Pigments Market Revenue Share, By Companies, 2025 |
10.2 Oman Inorganic Pigments Market Competitive Benchmarking, By Operating and Technical Parameters |
11 Company Profiles |
12 Recommendations |
13 Disclaimer |
Global Go To Market Strategy - 2030
Export potential enables firms to identify high-growth global markets with greater confidence by combining advanced trade intelligence with a structured quantitative methodology. The framework analyzes emerging demand trends and country-level import patterns while integrating macroeconomic and trade datasets such as GDP and population forecasts, bilateral import–export flows, tariff structures, elasticity differentials between developed and developing economies, geographic distance, and import demand projections. Using weighted trade values from 2020–2024 as the base period to project country-to-country export potential for 2030, these inputs are operationalized through calculated drivers such as gravity model parameters, tariff impact factors, and projected GDP per-capita growth. Through an analysis of hidden potentials, demand hotspots, and market conditions that are most favorable to success, this method enables firms to focus on target countries, maximize returns, and global expansion with data, backed by accuracy.
By factoring in the projected importer demand gap that is currently unmet and could be potential opportunity, it identifies the potential for the Exporter (Country) among 190 countries, against the general trade analysis, which identifies the biggest importer or exporter.
To discover high-growth global markets and optimize your business strategy:
Click Here
Pricing
- Single User License$ 1,995
- Department License$ 2,400
- Site License$ 3,120
- Global License$ 3,795

Leadership Perspectives from Industry Events
Search
Thought Leadership and Analyst Meet


Our Clients
6WResearch In News
- India Air Conditioner Market Set for Strong Rebound in 2026 After Weather-Led Correction and GST-Driven Recovery: 6Wresearch
- ADAS in India: How Automatic Emergency Braking, Blind Spot Detection & Driver Monitoring are Transforming Road Safety
- Doha a strategic location for EV manufacturing hub: IPA Qatar
- Demand for luxury TVs surging in the GCC, says Samsung
- Empowering Growth: The Thriving Journey of Bangladesh’s Cable Industry
- Demand for luxury TVs surging in the GCC, says Samsung
Latest Reports
- Nicaragua RPG Gaming Market (2026-2032)
- New Zealand RPG Gaming Market (2026-2032)
- Netherlands RPG Gaming Market (2026-2032)
- Nauru RPG Gaming Market (2026-2032)
- Namibia RPG Gaming Market (2026-2032)
- Mozambique RPG Gaming Market (2026-2032)
- Montenegro RPG Gaming Market (2026-2032)
- Mongolia RPG Gaming Market (2026-2032)
- Monaco RPG Gaming Market (2026-2032)
- Micronesia RPG Gaming Market (2026-2032)
Industry Events and Analyst Meet

HIMTEX 2026

India Refining Summit 2026

India EV Show 2026

EV tech India Expo 2026

Auto Tech Asia 2026
Whitepaper
- Middle East & Africa Commercial Security Market Click here to view more.
- Middle East & Africa Fire Safety Systems & Equipment Market Click here to view more.
- GCC Drone Market Click here to view more.
- Middle East Lighting Fixture Market Click here to view more.
- GCC Physical & Perimeter Security Market Click here to view more.