Oman Power Supply Market (2026-2032) | Trends, Companies, Forecast, Industry, Value, Revenue, Size, Analysis, Growth, Share & Outlook
Market Forecast By Output Power (Power Supply With Low Output (500 W and Below), Power Supply With Medium Output (500–1,000 W), Power Supply With High Output (More Than 1,000 W)), By Type (AC-DC Power Supply, DC-DC Power Supply), By Vertical (Medical & Healthcare, Military & Aerospace, Telecommunications, Consumer Electronics, Transportation, Lighting, Food & Beverages, Industrial) And Competitive Landscape
| Product Code: ETC014223 | Publication Date: Oct 2020 | Updated Date: Jun 2026 | Product Type: Report | |
| Publisher: 6Wresearch | Author: Ravi Bhandari | No. of Pages: 70 | No. of Figures: 35 | No. of Tables: 5 |
Oman Power Supply Market Summary
The oman power supply market was estimated at USD 656 Million in 2025 and is projected to reach USD 951 Million by 2032, growing at a CAGR of 6.2% from 2026 to 2032.
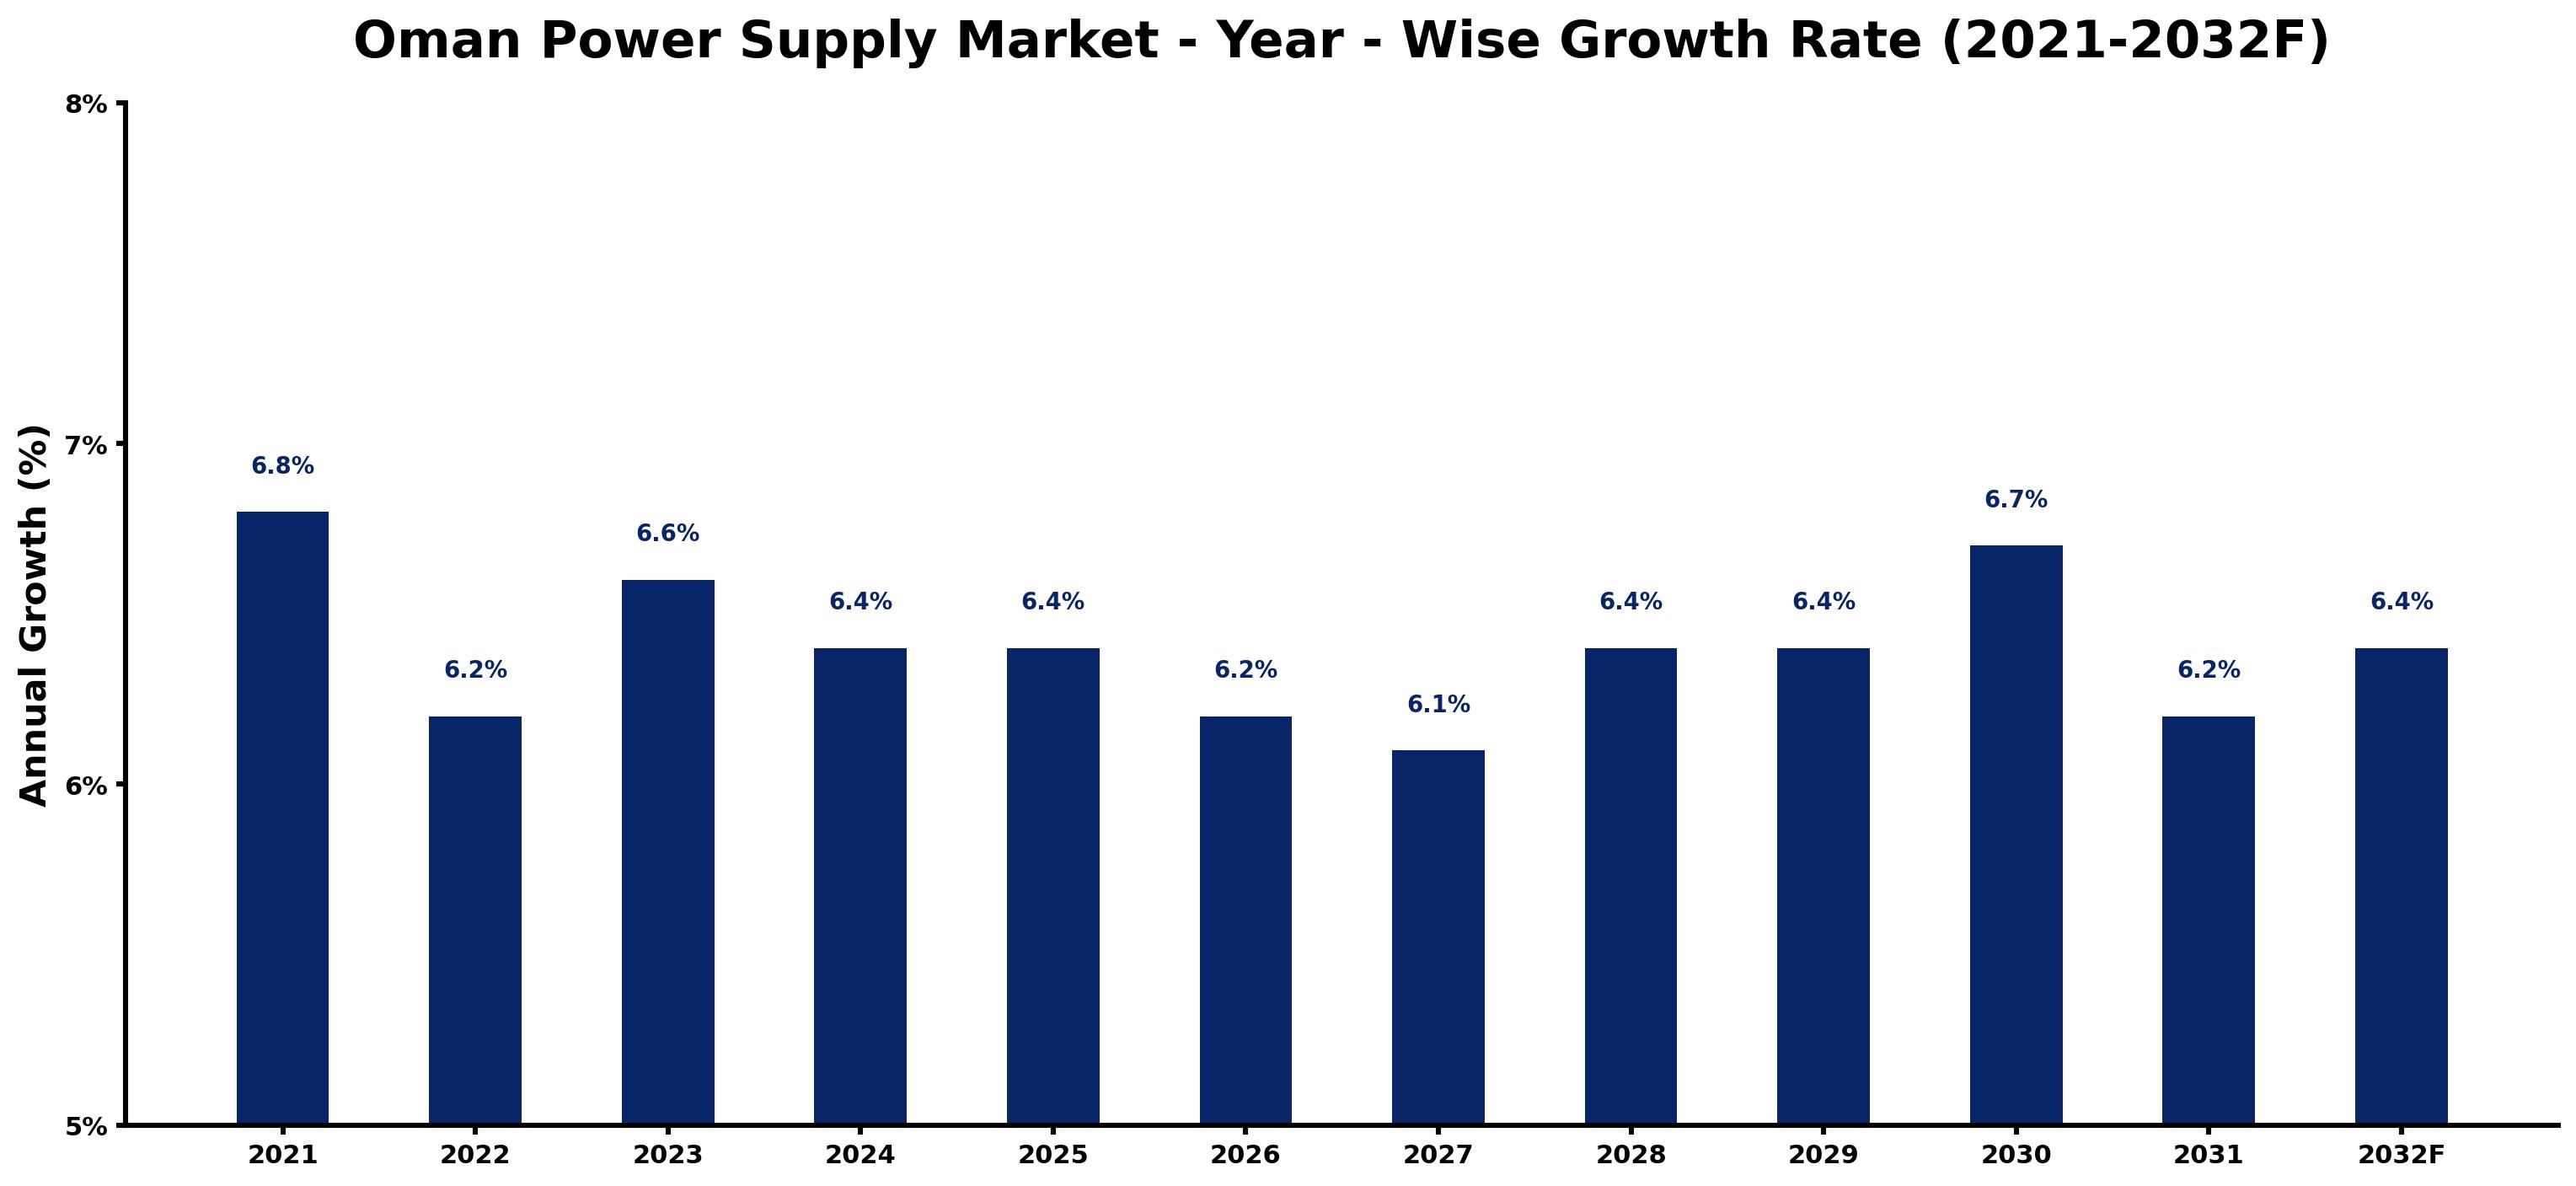
Oman Power Supply Market Growth Rate Analysis (2021-2032)
The Oman Power Supply Market has demonstrated resilience, marked by annual growth rates of 6.8% in 2021 and a gradual decline to 6.2% in 2022, followed by a rebound to 6.6% in 2023. This trend illustrates the market's stable nature, underpinned by robust consumer demand and strategic investments in infrastructure. Factors such as the government's commitment to energy transition initiatives and advancements in digital technology have bolstered the sector. Between 2024 and 2026, growth rates remain steady at approximately 6.4% to 6.2%, reflecting a balanced approach to energy supply alongside evolving industrial needs. Looking ahead, the forecast for 2030 shows a slight uptick to 6.7%, driven by ongoing enhancements in energy efficiency and policy support.
Oman Power Supply Market Year-wise Growth Rate and Key Drivers
This graph highlights how the Oman Power Supply Market has steadily grown over the past five years, supported by major growth factors.
The table below presents the year wise growth rates along with the key drivers influencing the market
| Year | Growth Rate | Major Drivers |
| 2021 | 6.8% | Solar power installations began gaining momentum, reflecting a shift toward renewables. |
| 2022 | 6.2% | Increased investments in infrastructure projects have spurred demand for reliable power supply. |
| 2023 | 6.6% | Growing industrial activities in Oman require upgraded energy solutions and efficient distribution. |
| 2024 | 6.4% | Emerging smart grid technologies are enhancing the management of energy resources effectively. |
| 2025 | 6.4% | Diverse energy portfolios are becoming critical as Oman diversifies its power generation mix. |
| 2026 | 6.2% | Collaborations with international firms are enhancing local capabilities in energy technologies. |
| 2027 | 6.1% | Increasing urbanization leads to higher residential energy consumption, boosting the market size. |
| 2028 | 6.4% | Renewable energy targets set by the government will drive new project opportunities. |
| 2029 | 6.4% | Electric vehicle market growth necessitates infrastructure upgrades for charging stations nationwide. |
| 2030 | 6.7% | Research and development in energy storage solutions support steady supply during peak demand. |
| 2031 | 6.2% | Expansion of desalination plants requires reliable power sources for water production. |
| 2032 | 6.4% | The regional integration of power grids promises enhanced energy security and collaboration. |
Note - Market size estimations and growth projections presented in this report are based on 6Wresearch's advanced forecasting approach, validated with industry datasets as of June 2026.
Oman Power Supply Market Synopsis
The Oman Power Supply Market is projected to reach 6.2% and witness significant growth during the forecast period (2026-2032). This growth can be attributed to the increasing electricity demand driven by urbanization, infrastructure projects, and industrial expansion. The power supply solutions, encompassing transformers, switchgears, and distribution panels, play a critical role in ensuring reliable electricity distribution across all sectors of the economy. As Oman continues to develop, the demand for these essential components is set to rise, necessitating advancements in the power supply market.
Oman Power Supply Market Growth Drivers
The Oman Power Supply Market is influenced by several key drivers that are shaping its trajectory. Firstly, the rapid urbanization in Oman is significantly escalating the demand for electricity across various sectors.
- The growing population in urban areas leads to an increase in residential electricity requirements, with more households needing reliable power supply solutions to support modern living standards.
- Infrastructure development initiatives, including roads, hospitals, and schools, necessitate enhanced power supply systems, driving demand for innovative power solutions.
- Industrialization is another significant driver, as Oman aims to bolster its economic sectors through new manufacturing and processing facilities that require robust energy supply for operations.
- Government efforts to enhance energy security, alongside a growing focus on renewable energy, have positioned the power supply market for substantial growth.
- Investment in smart grid technology aims to improve efficiency in electricity distribution, further promoting the expansion of the power supply market.
Oman Power Supply Market Challenges and Restraints
Despite the positive growth outlook for the Oman Power Supply Market, several challenges are hindering its expansion.
- Supply chain disruptions remain a critical issue, as they can impact the availability of essential power supply components, affecting project timelines and operational stability.
- Fluctuating prices of raw materials can strain budgets and increase costs for energy projects, making it difficult for companies to predict expenses accurately.
- The market also faces pressure to conform to stringent energy efficiency standards, necessitating ongoing innovation in product development and technology.
- Oman's reliance on imported power supply components can create vulnerabilities, particularly in times of global supply shortages.
- The absence of a strong local manufacturing base for power supply equipment restricts the market's ability to leverage domestic production capabilities.
Oman Power Supply Market Government Investment and Initiatives
The government of Oman plays a pivotal role in the development of the power supply market through various investment initiatives and regulatory frameworks.
- Significant investments in electricity generation infrastructure aim to bolster capacity and ensure stable power supply, which is vital for national development.
- Government subsidies for renewable energy installations are boosting interest in greener power solutions, supporting the transition towards sustainable energy sources.
- Regulatory efforts are being made to enhance the reliability and stability of the electrical grid, ensuring safe and uninterrupted power delivery to end users.
- The establishment of strategic partnerships with international entities for technology transfer is enhancing local capabilities in the power supply sector.
- Long-term development plans are focused on upgrading existing infrastructure and expanding the electrification of rural areas, thereby widening access to reliable power.
Oman Power Supply Market Latest Developments (May 2025 - June 2026)
In the period from May 2025 to June 2026, the Oman Power Supply Market has witnessed key developments reflecting its evolving landscape. Efforts toward enhancing grid stability and reliability have been prioritized, resulting in investments in advanced technology solutions. Furthermore, there has been a notable increase in public-private partnerships aimed at facilitating infrastructure projects, thereby enhancing the overall capacity of the power supply system. Additionally, the government has intensified its focus on renewable energy integration, leading to pilot projects that showcase innovation in solar and wind energy sectors. These initiatives not only contribute to energy diversification but also support compliance with global sustainability goals. Overall, the market is positioning itself for a future that aligns with both national energy security and environmental responsibility.
Oman Power Supply Market - Key Attractiveness of the Report
- 10 Years of Market Numbers
- Historical Data Starting from 2022 to 2025
- Base Year: 2025
- Forecast Data until 2032
- Key Performance Indicators Impacting the Market
- Major Upcoming Developments and Projects
Key Highlights of the Report:
- Oman Power Supply Market Outlook
- Market Size of Oman Power Supply Market, 2025
- Forecast of Oman Power Supply Market, 2032
- Historical Data and Forecast of Oman Power Supply Revenues & Volume for the Period 2022-2032F
- Oman Power Supply Market Trend Evolution
- Oman Power Supply Market Drivers and Challenges
- Oman Power Supply Price Trends
- Oman Power Supply Porter's Five Forces
- Oman Power Supply Industry Life Cycle
- Historical Data and Forecast of Oman Power Supply Market Revenues & Volume By Output Power for the Period 2022-2032F
- Historical Data and Forecast of Oman Power Supply Market Revenues & Volume By Power Supply With Low Output (500 W and Below) for the Period 2022-2032F
- Historical Data and Forecast of Oman Power Supply Market Revenues & Volume By Power Supply With Medium Output (500?1,000 W) for the Period 2022-2032F
- Historical Data and Forecast of Oman Power Supply Market Revenues & Volume By Power Supply With High Output (More Than 1,000 W) for the Period 2022-2032F
- Historical Data and Forecast of Oman Power Supply Market Revenues & Volume By Type for the Period 2022-2032F
- Historical Data and Forecast of Oman Power Supply Market Revenues & Volume By AC-DC Power Supply for the Period 2022-2032F
- Historical Data and Forecast of Oman Power Supply Market Revenues & Volume By DC-DC Power Supply for the Period 2022-2032F
- Historical Data and Forecast of Oman Power Supply Market Revenues & Volume By Vertical for the Period 2022-2032F
- Historical Data and Forecast of Oman Power Supply Market Revenues & Volume By Medical & Healthcare for the Period 2022-2032F
- Historical Data and Forecast of Oman Power Supply Market Revenues & Volume By Military & Aerospace for the Period 2022-2032F
- Historical Data and Forecast of Oman Power Supply Market Revenues & Volume By Telecommunications for the Period 2022-2032F
- Historical Data and Forecast of Oman Power Supply Market Revenues & Volume By Consumer Electronics for the Period 2022-2032F
- Historical Data and Forecast of Oman Power Supply Market Revenues & Volume By Transportation for the Period 2022-2032F
- Historical Data and Forecast of Oman Power Supply Market Revenues & Volume By Lighting for the Period 2022-2032F
- Historical Data and Forecast of Oman Power Supply Market Revenues & Volume By Food & Beverages for the Period 2022-2032F
- Historical Data and Forecast of Oman Power Supply Market Revenues & Volume By Industrial for the Period 2022-2032F
- Oman Power Supply Import Export Trade Statistics
- Market Opportunity Assessment By Output Power
- Market Opportunity Assessment By Type
- Market Opportunity Assessment By Vertical
- Oman Power Supply Top Companies Market Share
- Oman Power Supply Competitive Benchmarking By Technical and Operational Parameters
- Oman Power Supply Company Profiles
- Oman Power Supply Key Strategic Recommendations
Frequently Asked Questions About the Market Study (FAQs):
The growth is driven by increasing electricity demand due to urbanization, infrastructure development, industrialization, and government initiatives promoting energy security and renewable sources.
Challenges include supply chain disruptions, fluctuating raw material prices, the need for ongoing innovation, reliance on imports, and the lack of a robust local manufacturing base.
The government supports the market through investments in generation infrastructure, subsidies for renewable projects, regulatory frameworks for grid stability, and partnerships for technology enhancement.
Recent developments include advancements in grid stability solutions, increased public-private partnerships, focus on renewable energy projects, and efforts to enhance overall power supply capacity.
6Wresearch actively monitors the Oman Power Supply Market and publishes its comprehensive annual report, highlighting emerging trends, growth drivers, revenue analysis, and forecast outlook. Our insights help businesses to make data-backed strategic decisions with ongoing market dynamics. Our analysts track relevent industries related to the Oman Power Supply Market, allowing our clients with actionable intelligence and reliable forecasts tailored to emerging regional needs.
Yes, we provide customisation as per your requirements. To learn more, feel free to contact us on sales@6wresearch.com
1 Executive Summary |
2 Introduction |
2.1 Key Highlights of the Report |
2.2 Report Description |
2.3 Market Scope & Segmentation |
2.4 Research Methodology |
2.5 Assumptions |
3 Oman Power Supply Market Overview |
3.1 Oman Country Macro Economic Indicators |
3.2 Oman Power Supply Market Revenues & Volume, 2022 & 2032F |
3.3 Oman Power Supply Market - Industry Life Cycle |
3.4 Oman Power Supply Market - Porter's Five Forces |
3.5 Oman Power Supply Market Revenues & Volume Share, By Output Power, 2022 & 2032F |
3.6 Oman Power Supply Market Revenues & Volume Share, By Type, 2022 & 2032F |
3.7 Oman Power Supply Market Revenues & Volume Share, By Vertical, 2022 & 2032F |
4 Oman Power Supply Market Dynamics |
4.1 Impact Analysis |
4.2 Market Drivers |
4.3 Market Restraints |
5 Oman Power Supply Market Trends |
6 Oman Power Supply Market, By Types |
6.1 Oman Power Supply Market, By Output Power |
6.1.1 Overview and Analysis |
6.1.2 Oman Power Supply Market Revenues & Volume, By Output Power, 2022-2032F |
6.1.3 Oman Power Supply Market Revenues & Volume, By Power Supply With Low Output (500 W and Below), 2022-2032F |
6.1.4 Oman Power Supply Market Revenues & Volume, By Power Supply With Medium Output (500?1,000 W), 2022-2032F |
6.1.5 Oman Power Supply Market Revenues & Volume, By Power Supply With High Output (More Than 1,000 W), 2022-2032F |
6.2 Oman Power Supply Market, By Type |
6.2.1 Overview and Analysis |
6.2.2 Oman Power Supply Market Revenues & Volume, By AC-DC Power Supply, 2022-2032F |
6.2.3 Oman Power Supply Market Revenues & Volume, By DC-DC Power Supply, 2022-2032F |
6.3 Oman Power Supply Market, By Vertical |
6.3.1 Overview and Analysis |
6.3.2 Oman Power Supply Market Revenues & Volume, By Medical & Healthcare, 2022-2032F |
6.3.3 Oman Power Supply Market Revenues & Volume, By Military & Aerospace, 2022-2032F |
6.3.4 Oman Power Supply Market Revenues & Volume, By Telecommunications, 2022-2032F |
6.3.5 Oman Power Supply Market Revenues & Volume, By Consumer Electronics, 2022-2032F |
6.3.6 Oman Power Supply Market Revenues & Volume, By Transportation, 2022-2032F |
6.3.7 Oman Power Supply Market Revenues & Volume, By Lighting, 2022-2032F |
6.3.8 Oman Power Supply Market Revenues & Volume, By Industrial, 2022-2032F |
6.3.9 Oman Power Supply Market Revenues & Volume, By Industrial, 2022-2032F |
7 Oman Power Supply Market Import-Export Trade Statistics |
7.1 Oman Power Supply Market Export to Major Countries |
7.2 Oman Power Supply Market Imports from Major Countries |
8 Oman Power Supply Market Key Performance Indicators |
9 Oman Power Supply Market - Opportunity Assessment |
9.1 Oman Power Supply Market Opportunity Assessment, By Output Power, 2022 & 2032F |
9.2 Oman Power Supply Market Opportunity Assessment, By Type, 2022 & 2032F |
9.3 Oman Power Supply Market Opportunity Assessment, By Vertical, 2022 & 2032F |
10 Oman Power Supply Market - Competitive Landscape |
10.1 Oman Power Supply Market Revenue Share, By Companies, 2025 |
10.2 Oman Power Supply Market Competitive Benchmarking, By Operating and Technical Parameters |
11 Company Profiles |
12 Recommendations |
13 Disclaimer |
Global Go To Market Strategy - 2030
Export potential enables firms to identify high-growth global markets with greater confidence by combining advanced trade intelligence with a structured quantitative methodology. The framework analyzes emerging demand trends and country-level import patterns while integrating macroeconomic and trade datasets such as GDP and population forecasts, bilateral import–export flows, tariff structures, elasticity differentials between developed and developing economies, geographic distance, and import demand projections. Using weighted trade values from 2020–2024 as the base period to project country-to-country export potential for 2030, these inputs are operationalized through calculated drivers such as gravity model parameters, tariff impact factors, and projected GDP per-capita growth. Through an analysis of hidden potentials, demand hotspots, and market conditions that are most favorable to success, this method enables firms to focus on target countries, maximize returns, and global expansion with data, backed by accuracy.
By factoring in the projected importer demand gap that is currently unmet and could be potential opportunity, it identifies the potential for the Exporter (Country) among 190 countries, against the general trade analysis, which identifies the biggest importer or exporter.
To discover high-growth global markets and optimize your business strategy:
Click Here
Pricing
- Single User License$ 1,995
- Department License$ 2,400
- Site License$ 3,120
- Global License$ 3,795

Leadership Perspectives from Industry Events
Search
Thought Leadership and Analyst Meet


Our Clients
6WResearch In News
- India Air Conditioner Market Set for Strong Rebound in 2026 After Weather-Led Correction and GST-Driven Recovery: 6Wresearch
- ADAS in India: How Automatic Emergency Braking, Blind Spot Detection & Driver Monitoring are Transforming Road Safety
- Doha a strategic location for EV manufacturing hub: IPA Qatar
- Demand for luxury TVs surging in the GCC, says Samsung
- Empowering Growth: The Thriving Journey of Bangladesh’s Cable Industry
- Demand for luxury TVs surging in the GCC, says Samsung
Latest Reports
- Poland Fire Protection Systems Market (2026-2032)
- Cape Verde Portable Hand-Thrown Extinguisher Market (2026-2032)
- Canada Portable Hand-Thrown Extinguisher Market (2026-2032)
- Cameroon Portable Hand-Thrown Extinguisher Market (2026-2032)
- Burundi Portable Hand-Thrown Extinguisher Market (2026-2032)
- Burkina Faso Portable Hand-Thrown Extinguisher Market (2026-2032)
- Bulgaria Portable Hand-Thrown Extinguisher Market (2026-2032)
- Brunei Portable Hand-Thrown Extinguisher Market (2026-2032)
- Botswana Portable Hand-Thrown Extinguisher Market (2026-2032)
- Bosnia and Herzegovina Portable Hand-Thrown Extinguisher Market (2026-2032)
Industry Events and Analyst Meet

HIMTEX 2026

India Refining Summit 2026

India EV Show 2026

EV tech India Expo 2026

Auto Tech Asia 2026
Whitepaper
- Middle East & Africa Commercial Security Market Click here to view more.
- Middle East & Africa Fire Safety Systems & Equipment Market Click here to view more.
- GCC Drone Market Click here to view more.
- Middle East Lighting Fixture Market Click here to view more.
- GCC Physical & Perimeter Security Market Click here to view more.