Oman Urea Formaldehyde Market Outlook | Growth, Share, Size, Trends, Revenue, Forecast, Industry, Companies, Analysis, COVID-19 IMPACT & Value
Market Forecast By End-users (Automobiles, Electrical Appliances, Home Appliances (Furniture), Agriculture, Others), By Applications (Adhesives, Particle board, Plywood, Roofing mats, Others) And Competitive Landscape
| Product Code: ETC093122 | Publication Date: Jun 2021 | Updated Date: Jun 2026 | Product Type: Report | |
| Publisher: 6Wresearch | Author: Ravi Bhandari | No. of Pages: 70 | No. of Figures: 35 | No. of Tables: 5 |
Oman Urea Formaldehyde Market Size, Share & Growth Rate
The Oman Urea Formaldehyde Market was estimated at USD 383 Million in 2025 and is projected to reach USD 532 Million by 2032, growing at a CAGR of 4.8% from 2026 to 2032. This growth trajectory is underpinned by the increasing demand for robust adhesive solutions across various sectors, including woodworking, construction, and automotive. As industries in Oman seek cost-effective and durable materials, urea formaldehyde continues to gain traction due to its superior bonding capabilities.
Oman Urea Formaldehyde Market Growth Rate Analysis (2021-2032)
The Oman Urea Formaldehyde market has been experiencing steady growth, with a reported rise of 6.0% in 2021, followed by 5.7% in 2022. This upward trend is largely attributed to increasing demand from the construction industry and the growing adoption of sustainable building materials. However, growth slightly moderated to 5.4% in 2024 and 2026, reflecting temporary fluctuations in raw material costs and supply chain disruptions. By 2025, the market rebounded to 6.0%, driven by enhanced industrial investments and advancements in manufacturing technologies. Looking toward 2030, the market is expected to maintain a growth rate of around 5.8% as consumer demand for eco-friendly products continues to rise.
Oman Urea Formaldehyde Market Year-wise Growth Rate and Key Drivers
This graph highlights how the Oman Urea Formaldehyde Market has steadily grown over the past five years, supported by major growth factors.
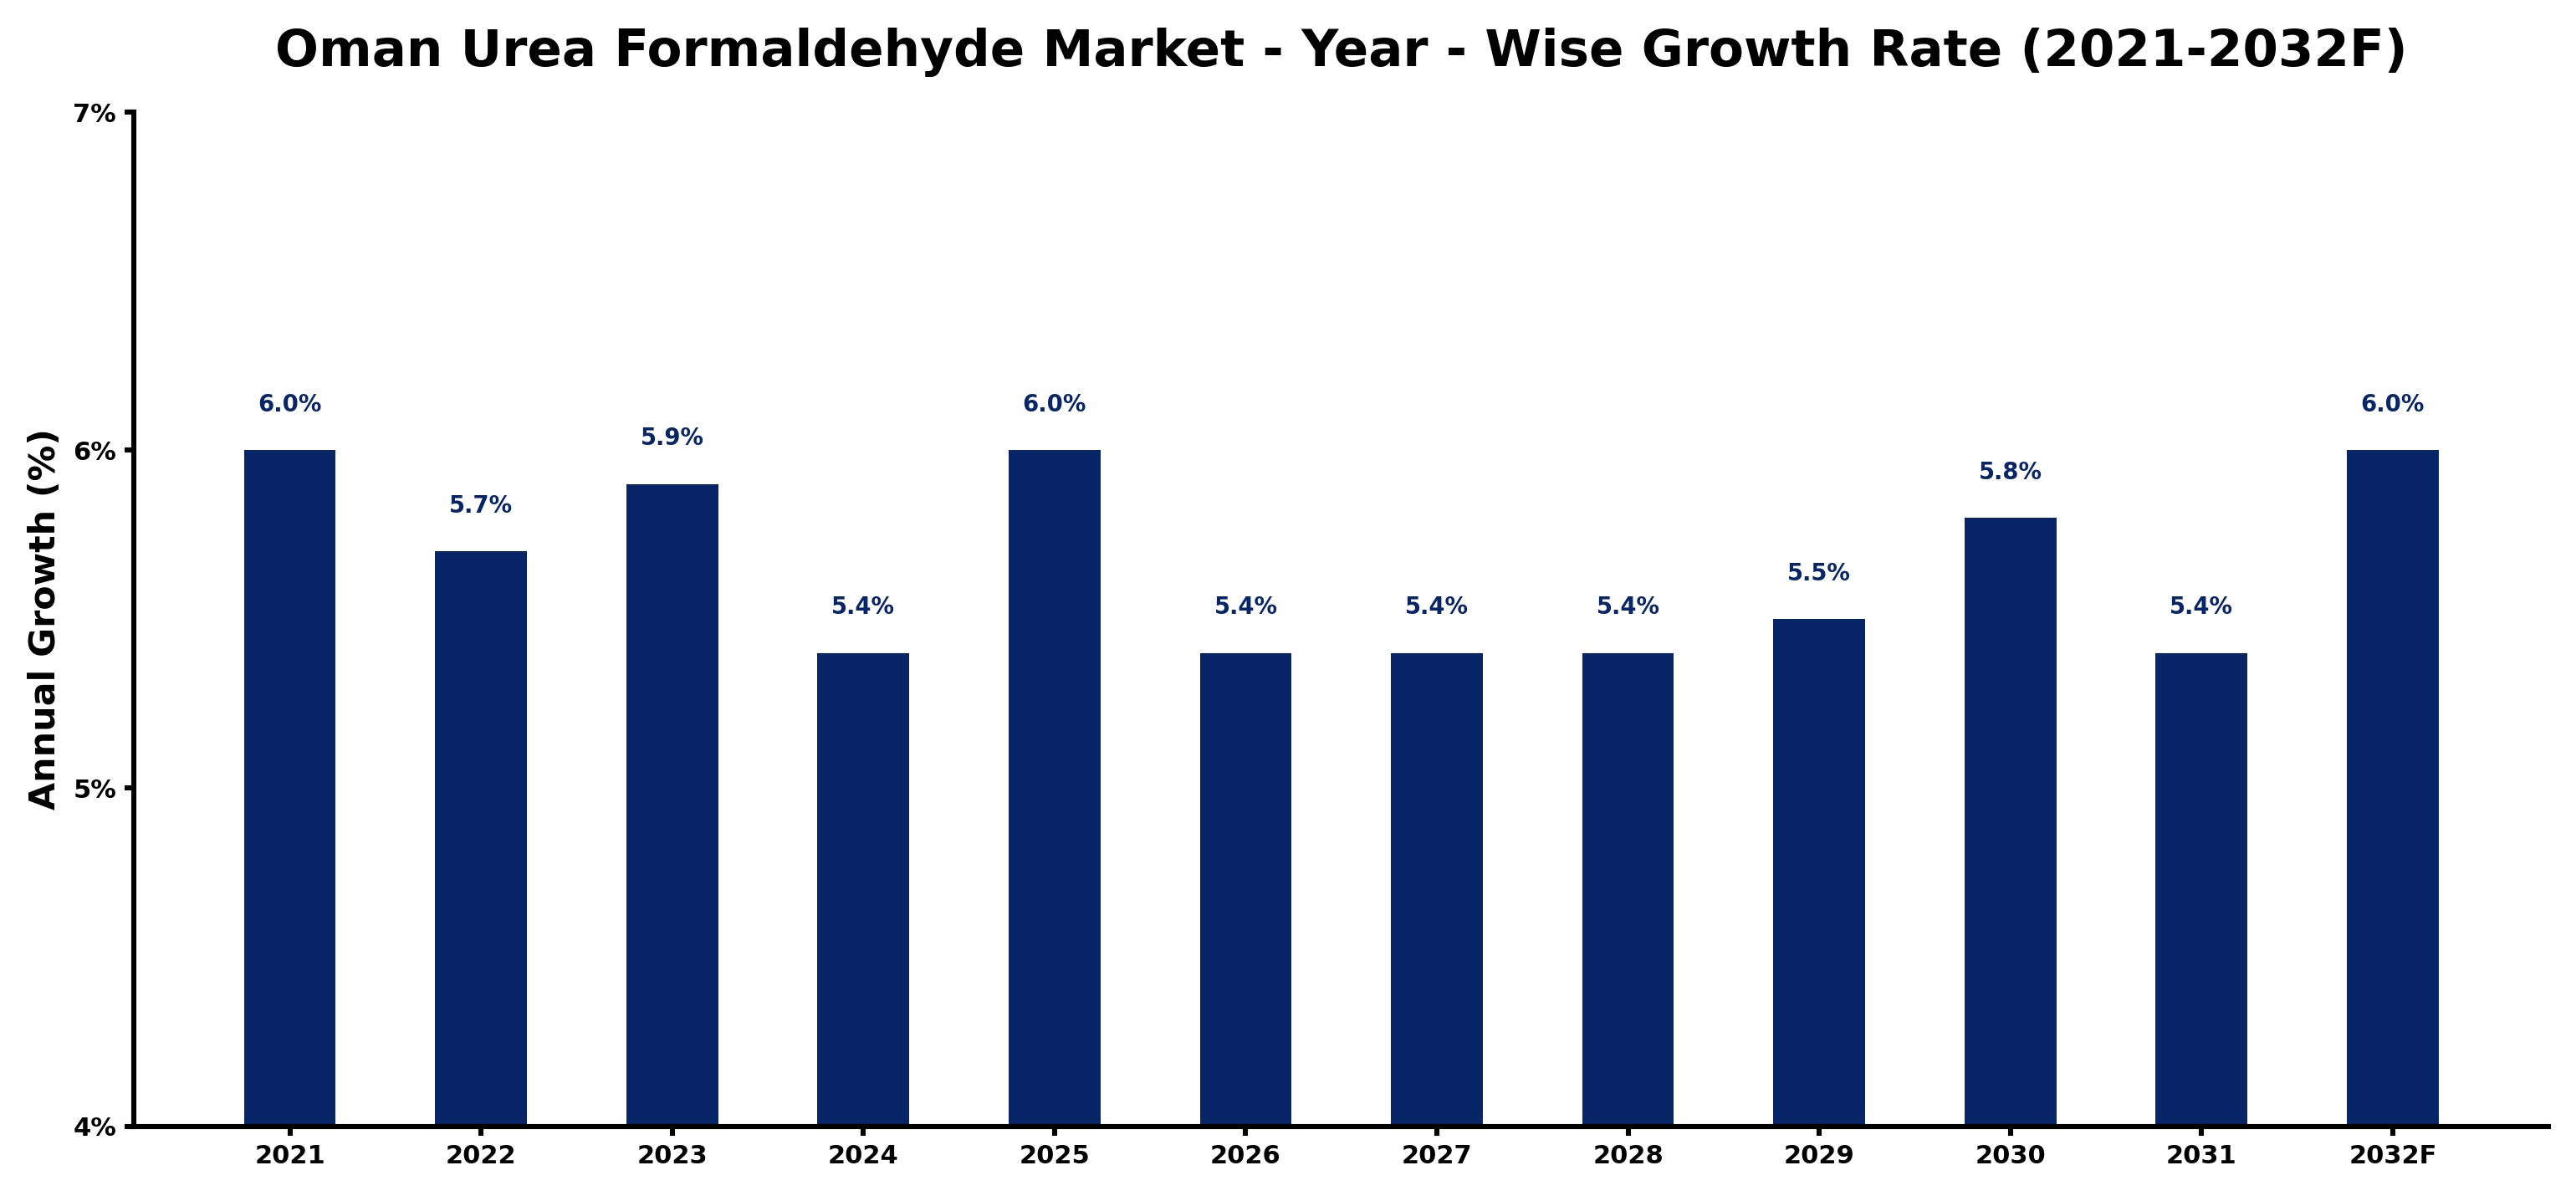
The table below presents the year‑wise growth rates along with the key drivers influencing the market
| Year | Growth Rate | Major Drivers |
| 2021 | 6.0% | New urea formaldehyde plants boost local manufacturing and exports |
| 2022 | 5.7% | Local chemical manufacturers adopt advanced processes to boost efficiency |
| 2023 | 5.9% | Export driven investments boosted urea formaldehyde production capacity utilization |
| 2024 | 5.4% | Technological upgrades in production boost urea formaldehyde efficiency |
| 2025 | 6.0% | Domestic urea formaldehyde production expansion drives regional export opportunities |
| 2026 | 5.4% | Improved technology integration enhanced urea formaldehyde production efficiency |
| 2027 | 5.4% | Local manufacturers invest in advanced technology for urea formaldehyde production |
| 2028 | 5.4% | New urea formaldehyde production facility boosts regional supply capacity |
| 2029 | 5.5% | Modernized urea formaldehyde production enhanced export competitiveness significantly |
| 2030 | 5.8% | Export agreements boosted urea formaldehyde production and supply chain efficiency |
| 2031 | 5.4% | Optimized urea formaldehyde production processes bolstered regional supply chains |
| 2032 | 6.0% | Manufacturing investments in advanced technologies drive urea formaldehyde production efficiency |
Note - Market size estimations and growth projections presented in this report are based on 6Wresearch’s advanced forecasting approach, validated with industry datasets as of June 2026.
Oman Urea Formaldehyde Market Synopsis
In Oman, the wood and furniture industries are pivotal drivers of urea formaldehyde consumption, with manufacturers increasingly opting for this resin to enhance product durability. This compound's unique properties cater to the growing needs for efficient adhesives in high-demand sectors, further propelling market expansion.
Despite facing competition from alternative adhesive solutions, the adaptability and cost-effectiveness of urea formaldehyde continue to appeal to local manufacturers. The ongoing urbanization and infrastructure development in Oman are likely to bolster the demand for urea formaldehyde in construction applications, further securing its market position.
Oman Urea Formaldehyde Market Key Takeaways
- The market is projected to witness steady growth fueled by the demand from the woodworking and furniture sectors.
- Health concerns related to formaldehyde emissions are prompting a shift towards regulatory compliance and safer alternatives.
- Oman's economic diversification initiatives are creating new opportunities for urea formaldehyde applications in construction and automotive sectors.
- The market is facing challenges in sourcing raw materials, which can impact pricing and supply stability.
- Innovation in manufacturing processes is essential to address environmental concerns while maintaining product performance.
Evaluation of Restraints in Oman Urea Formaldehyde Market
The Oman Urea Formaldehyde Market is significantly influenced by stringent health and environmental regulations due to the hazardous nature of formaldehyde emissions. Such regulations not only impact production practices but also compel manufacturers to invest in advanced technologies that mitigate risks. Additionally, the fluctuating availability of raw materials introduces unpredictability, while limited local production capacities hinder rapid innovation. This combination of factors places pressure on producers to adapt swiftly or risk losing market share to alternative resins.
Oman Urea Formaldehyde Market Trends
Emerging trends within the Oman Urea Formaldehyde Market highlight a growing preference for eco-friendly adhesive solutions. With consumers becoming more environmentally conscious, manufacturers are increasingly exploring bio-based alternatives that meet sustainability criteria. Furthermore, advancements in manufacturing technologies aimed at enhancing the safety and efficiency of urea formaldehyde products are on the rise, allowing for better compliance with regulatory standards. These trends reflect a shift towards a more responsible approach in the production and use of urea formaldehyde in Oman.
Oman Urea Formaldehyde Market Opportunities
Significant growth opportunities exist within the Oman Urea Formaldehyde Market as government initiatives focus on urban development and industrial expansion. The increasing demand for construction materials provides a fertile ground for innovative applications of urea formaldehyde in building and construction projects. Additionally, investment in research and development of low-emission resins is likely to open new avenues for market players to cater to environmentally conscious consumers, ensuring their competitive edge in an evolving marketplace.
Government Initiatives in the Oman Urea Formaldehyde Market
Omani government policies are progressively aimed at regulating the production and usage of urea formaldehyde resins, focusing on both product safety and environmental sustainability. These initiatives include stringent standards for resin composition and emissions, encouraging manufacturers to adopt safer practices. Furthermore, the government is likely to provide incentives to stimulate the research and development of alternative resins, promoting innovation while ensuring compliance with health regulations.
Future Insights of the Oman Urea Formaldehyde Market
Looking ahead to 2026-2032, the Oman Urea Formaldehyde Market is poised for notable growth driven by ongoing urbanization and infrastructure projects. As demand increases for stronger and more economical adhesive solutions, the market will need to balance production capabilities with compliance to health regulations. The ability to innovate in product development and adapt to market shifts will be critical for stakeholders, positioning them to capitalize on the growth potential in both traditional and emerging applications.
Oman Urea Formaldehyde Market Latest Developments (May 2025 - June 2026)
In the last year, the Oman Urea Formaldehyde Market has witnessed a shift towards enhanced safety protocols following new government regulations. Manufacturers are increasingly investing in technology upgrades to ensure compliance with emissions standards while maintaining product integrity. Collaborative efforts between industry stakeholders aim to foster innovation in adhesive formulations, catering to both traditional markets and newer eco-friendly segments.
Oman Urea Formaldehyde Market - Key Attractiveness of the Report
- 10 Years of Market Numbers
- Historical Data Starting from 2022 to 2025
- Base Year: 2025
- Forecast Data until 2032
- Key Performance Indicators Impacting the Market
- Major Upcoming Developments and Projects
Key Highlights of the Report:
- Oman Urea Formaldehyde Market Outlook
- Market Size of Oman Urea Formaldehyde Market, 2025
- Forecast of Oman Urea Formaldehyde Market, 2032
- Historical Data and Forecast of Oman Urea Formaldehyde Revenues & Volume for the Period 2022-2032F
- Oman Urea Formaldehyde Market Trend Evolution
- Oman Urea Formaldehyde Market Drivers and Challenges
- Oman Urea Formaldehyde Price Trends
- Oman Urea Formaldehyde Porter's Five Forces
- Oman Urea Formaldehyde Industry Life Cycle
- Historical Data and Forecast of Oman Urea Formaldehyde Market Revenues & Volume By End-users for the Period 2022-2032F
- Historical Data and Forecast of Oman Urea Formaldehyde Market Revenues & Volume By Automobiles for the Period 2022-2032F
- Historical Data and Forecast of Oman Urea Formaldehyde Market Revenues & Volume By Electrical Appliances for the Period 2022-2032F
- Historical Data and Forecast of Oman Urea Formaldehyde Market Revenues & Volume By Home Appliances (Furniture) for the Period 2022-2032F
- Historical Data and Forecast of Oman Urea Formaldehyde Market Revenues & Volume By Agriculture for the Period 2022-2032F
- Historical Data and Forecast of Oman Urea Formaldehyde Market Revenues & Volume By Others for the Period 2022-2032F
- Historical Data and Forecast of Oman Urea Formaldehyde Market Revenues & Volume By Applications for the Period 2022-2032F
- Historical Data and Forecast of Oman Urea Formaldehyde Market Revenues & Volume By Adhesives for the Period 2022-2032F
- Historical Data and Forecast of Oman Urea Formaldehyde Market Revenues & Volume By Particle board for the Period 2022-2032F
- Historical Data and Forecast of Oman Urea Formaldehyde Market Revenues & Volume By Plywood for the Period 2022-2032F
- Historical Data and Forecast of Oman Urea Formaldehyde Market Revenues & Volume By Roofing mats for the Period 2022-2032F
- Historical Data and Forecast of Oman Urea Formaldehyde Market Revenues & Volume By Others for the Period 2022-2032F
- Oman Urea Formaldehyde Import Export Trade Statistics
- Market Opportunity Assessment By End-users
- Market Opportunity Assessment By Applications
- Oman Urea Formaldehyde Top Companies Market Share
- Oman Urea Formaldehyde Competitive Benchmarking By Technical and Operational Parameters
- Oman Urea Formaldehyde Company Profiles
- Oman Urea Formaldehyde Key Strategic Recommendations
Oman Urea Formaldehyde Market - Frequently Asked Questions
The growth is largely driven by the demand for durable and economical adhesive solutions in the woodworking and furniture sectors, alongside expansion in construction activities.
The Oman Urea Formaldehyde Market was estimated at USD 383 Million in 2025 and is projected to reach USD 532 Million by 2032, reflecting a CAGR of 4.8% from 2026 to 2032.
Key challenges include health concerns over formaldehyde emissions, regulatory compliance pressures, and fluctuations in raw material availability, all of which affect production strategies.
Yes, the government is implementing policies to promote safer production methods and may offer incentives to encourage research into alternative, environmentally-friendly resins.
Trends include a shift towards eco-friendly adhesives and innovations in manufacturing processes that prioritize safety and efficiency, aligning with consumer demands for sustainable products.
6Wresearch actively monitors the Oman Urea Formaldehyde Market and publishes its comprehensive annual report, highlighting emerging trends, growth drivers, revenue analysis, and forecast outlook. Our insights help businesses to make data-backed strategic decisions with ongoing market dynamics. Our analysts track relevent industries related to the Oman Urea Formaldehyde Market, allowing our clients with actionable intelligence and reliable forecasts tailored to emerging regional needs.
Yes, we provide customisation as per your requirements. To learn more, feel free to contact us on sales@6wresearch.com
1 Executive Summary |
2 Introduction |
2.1 Key Highlights of the Report |
2.2 Report Description |
2.3 Market Scope & Segmentation |
2.4 Research Methodology |
2.5 Assumptions |
3 Oman Urea Formaldehyde Market Overview |
3.1 Oman Country Macro Economic Indicators |
3.2 Oman Urea Formaldehyde Market Revenues & Volume, 2022 & 2032F |
3.3 Oman Urea Formaldehyde Market - Industry Life Cycle |
3.4 Oman Urea Formaldehyde Market - Porter's Five Forces |
3.5 Oman Urea Formaldehyde Market Revenues & Volume Share, By End-users, 2022 & 2032F |
3.6 Oman Urea Formaldehyde Market Revenues & Volume Share, By Applications, 2022 & 2032F |
4 Oman Urea Formaldehyde Market Dynamics |
4.1 Impact Analysis |
4.2 Market Drivers |
4.3 Market Restraints |
5 Oman Urea Formaldehyde Market Trends |
6 Oman Urea Formaldehyde Market, By Types |
6.1 Oman Urea Formaldehyde Market, By End-users |
6.1.1 Overview and Analysis |
6.1.2 Oman Urea Formaldehyde Market Revenues & Volume, By End-users, 2022-2032F |
6.1.3 Oman Urea Formaldehyde Market Revenues & Volume, By Automobiles, 2022-2032F |
6.1.4 Oman Urea Formaldehyde Market Revenues & Volume, By Electrical Appliances, 2022-2032F |
6.1.5 Oman Urea Formaldehyde Market Revenues & Volume, By Home Appliances (Furniture), 2022-2032F |
6.1.6 Oman Urea Formaldehyde Market Revenues & Volume, By Agriculture, 2022-2032F |
6.1.7 Oman Urea Formaldehyde Market Revenues & Volume, By Others, 2022-2032F |
6.2 Oman Urea Formaldehyde Market, By Applications |
6.2.1 Overview and Analysis |
6.2.2 Oman Urea Formaldehyde Market Revenues & Volume, By Adhesives, 2022-2032F |
6.2.3 Oman Urea Formaldehyde Market Revenues & Volume, By Particle board, 2022-2032F |
6.2.4 Oman Urea Formaldehyde Market Revenues & Volume, By Plywood, 2022-2032F |
6.2.5 Oman Urea Formaldehyde Market Revenues & Volume, By Roofing mats, 2022-2032F |
6.2.6 Oman Urea Formaldehyde Market Revenues & Volume, By Others, 2022-2032F |
7 Oman Urea Formaldehyde Market Import-Export Trade Statistics |
7.1 Oman Urea Formaldehyde Market Export to Major Countries |
7.2 Oman Urea Formaldehyde Market Imports from Major Countries |
8 Oman Urea Formaldehyde Market Key Performance Indicators |
9 Oman Urea Formaldehyde Market - Opportunity Assessment |
9.1 Oman Urea Formaldehyde Market Opportunity Assessment, By End-users, 2022 & 2032F |
9.2 Oman Urea Formaldehyde Market Opportunity Assessment, By Applications, 2022 & 2032F |
10 Oman Urea Formaldehyde Market - Competitive Landscape |
10.1 Oman Urea Formaldehyde Market Revenue Share, By Companies, 2025 |
10.2 Oman Urea Formaldehyde Market Competitive Benchmarking, By Operating and Technical Parameters |
11 Company Profiles |
12 Recommendations |
13 Disclaimer |
Global Go To Market Strategy - 2030
Export potential enables firms to identify high-growth global markets with greater confidence by combining advanced trade intelligence with a structured quantitative methodology. The framework analyzes emerging demand trends and country-level import patterns while integrating macroeconomic and trade datasets such as GDP and population forecasts, bilateral import–export flows, tariff structures, elasticity differentials between developed and developing economies, geographic distance, and import demand projections. Using weighted trade values from 2020–2024 as the base period to project country-to-country export potential for 2030, these inputs are operationalized through calculated drivers such as gravity model parameters, tariff impact factors, and projected GDP per-capita growth. Through an analysis of hidden potentials, demand hotspots, and market conditions that are most favorable to success, this method enables firms to focus on target countries, maximize returns, and global expansion with data, backed by accuracy.
By factoring in the projected importer demand gap that is currently unmet and could be potential opportunity, it identifies the potential for the Exporter (Country) among 190 countries, against the general trade analysis, which identifies the biggest importer or exporter.
To discover high-growth global markets and optimize your business strategy:
Click Here
Pricing
- Single User License$ 1,995
- Department License$ 2,400
- Site License$ 3,120
- Global License$ 3,795

Leadership Perspectives from Industry Events
Search
Thought Leadership and Analyst Meet


Our Clients
6WResearch In News
- India Air Conditioner Market Set for Strong Rebound in 2026 After Weather-Led Correction and GST-Driven Recovery: 6Wresearch
- ADAS in India: How Automatic Emergency Braking, Blind Spot Detection & Driver Monitoring are Transforming Road Safety
- Doha a strategic location for EV manufacturing hub: IPA Qatar
- Demand for luxury TVs surging in the GCC, says Samsung
- Empowering Growth: The Thriving Journey of Bangladesh’s Cable Industry
- Demand for luxury TVs surging in the GCC, says Samsung
Latest Reports
- Poland Fire Protection Systems Market (2026-2032)
- Cape Verde Portable Hand-Thrown Extinguisher Market (2026-2032)
- Canada Portable Hand-Thrown Extinguisher Market (2026-2032)
- Cameroon Portable Hand-Thrown Extinguisher Market (2026-2032)
- Burundi Portable Hand-Thrown Extinguisher Market (2026-2032)
- Burkina Faso Portable Hand-Thrown Extinguisher Market (2026-2032)
- Bulgaria Portable Hand-Thrown Extinguisher Market (2026-2032)
- Brunei Portable Hand-Thrown Extinguisher Market (2026-2032)
- Botswana Portable Hand-Thrown Extinguisher Market (2026-2032)
- Bosnia and Herzegovina Portable Hand-Thrown Extinguisher Market (2026-2032)
Industry Events and Analyst Meet

HIMTEX 2026

India Refining Summit 2026

India EV Show 2026

EV tech India Expo 2026

Auto Tech Asia 2026
Whitepaper
- Middle East & Africa Commercial Security Market Click here to view more.
- Middle East & Africa Fire Safety Systems & Equipment Market Click here to view more.
- GCC Drone Market Click here to view more.
- Middle East Lighting Fixture Market Click here to view more.
- GCC Physical & Perimeter Security Market Click here to view more.