Philippines Computer Power Cable Assemblies Market (2026-2032) | Analysis, Trends, Share, Size, Industry, Forecast, Companies, Outlook, Growth, Value, Revenue
Market Forecast By Types (4-Pin Molex, 20-Pin ATX, 26-Pin MDR, 26-Pin SDR), By Applications (PC, Laptop, Super Computer, Others) And Competitive Landscape
| Product Code: ETC032449 | Publication Date: Jul 2023 | Updated Date: Jun 2026 | Product Type: Report | |
| Publisher: 6Wresearch | Author: Ravi Bhandari | No. of Pages: 70 | No. of Figures: 35 | No. of Tables: 5 |
Philippines Computer Power Cable Assemblies Market Summary
The philippines computer power cable assemblies market was estimated at USD 496 Million in 2025 and is projected to reach USD 690 Million by 2032, growing at a CAGR of 5.9% from 2026 to 2032.
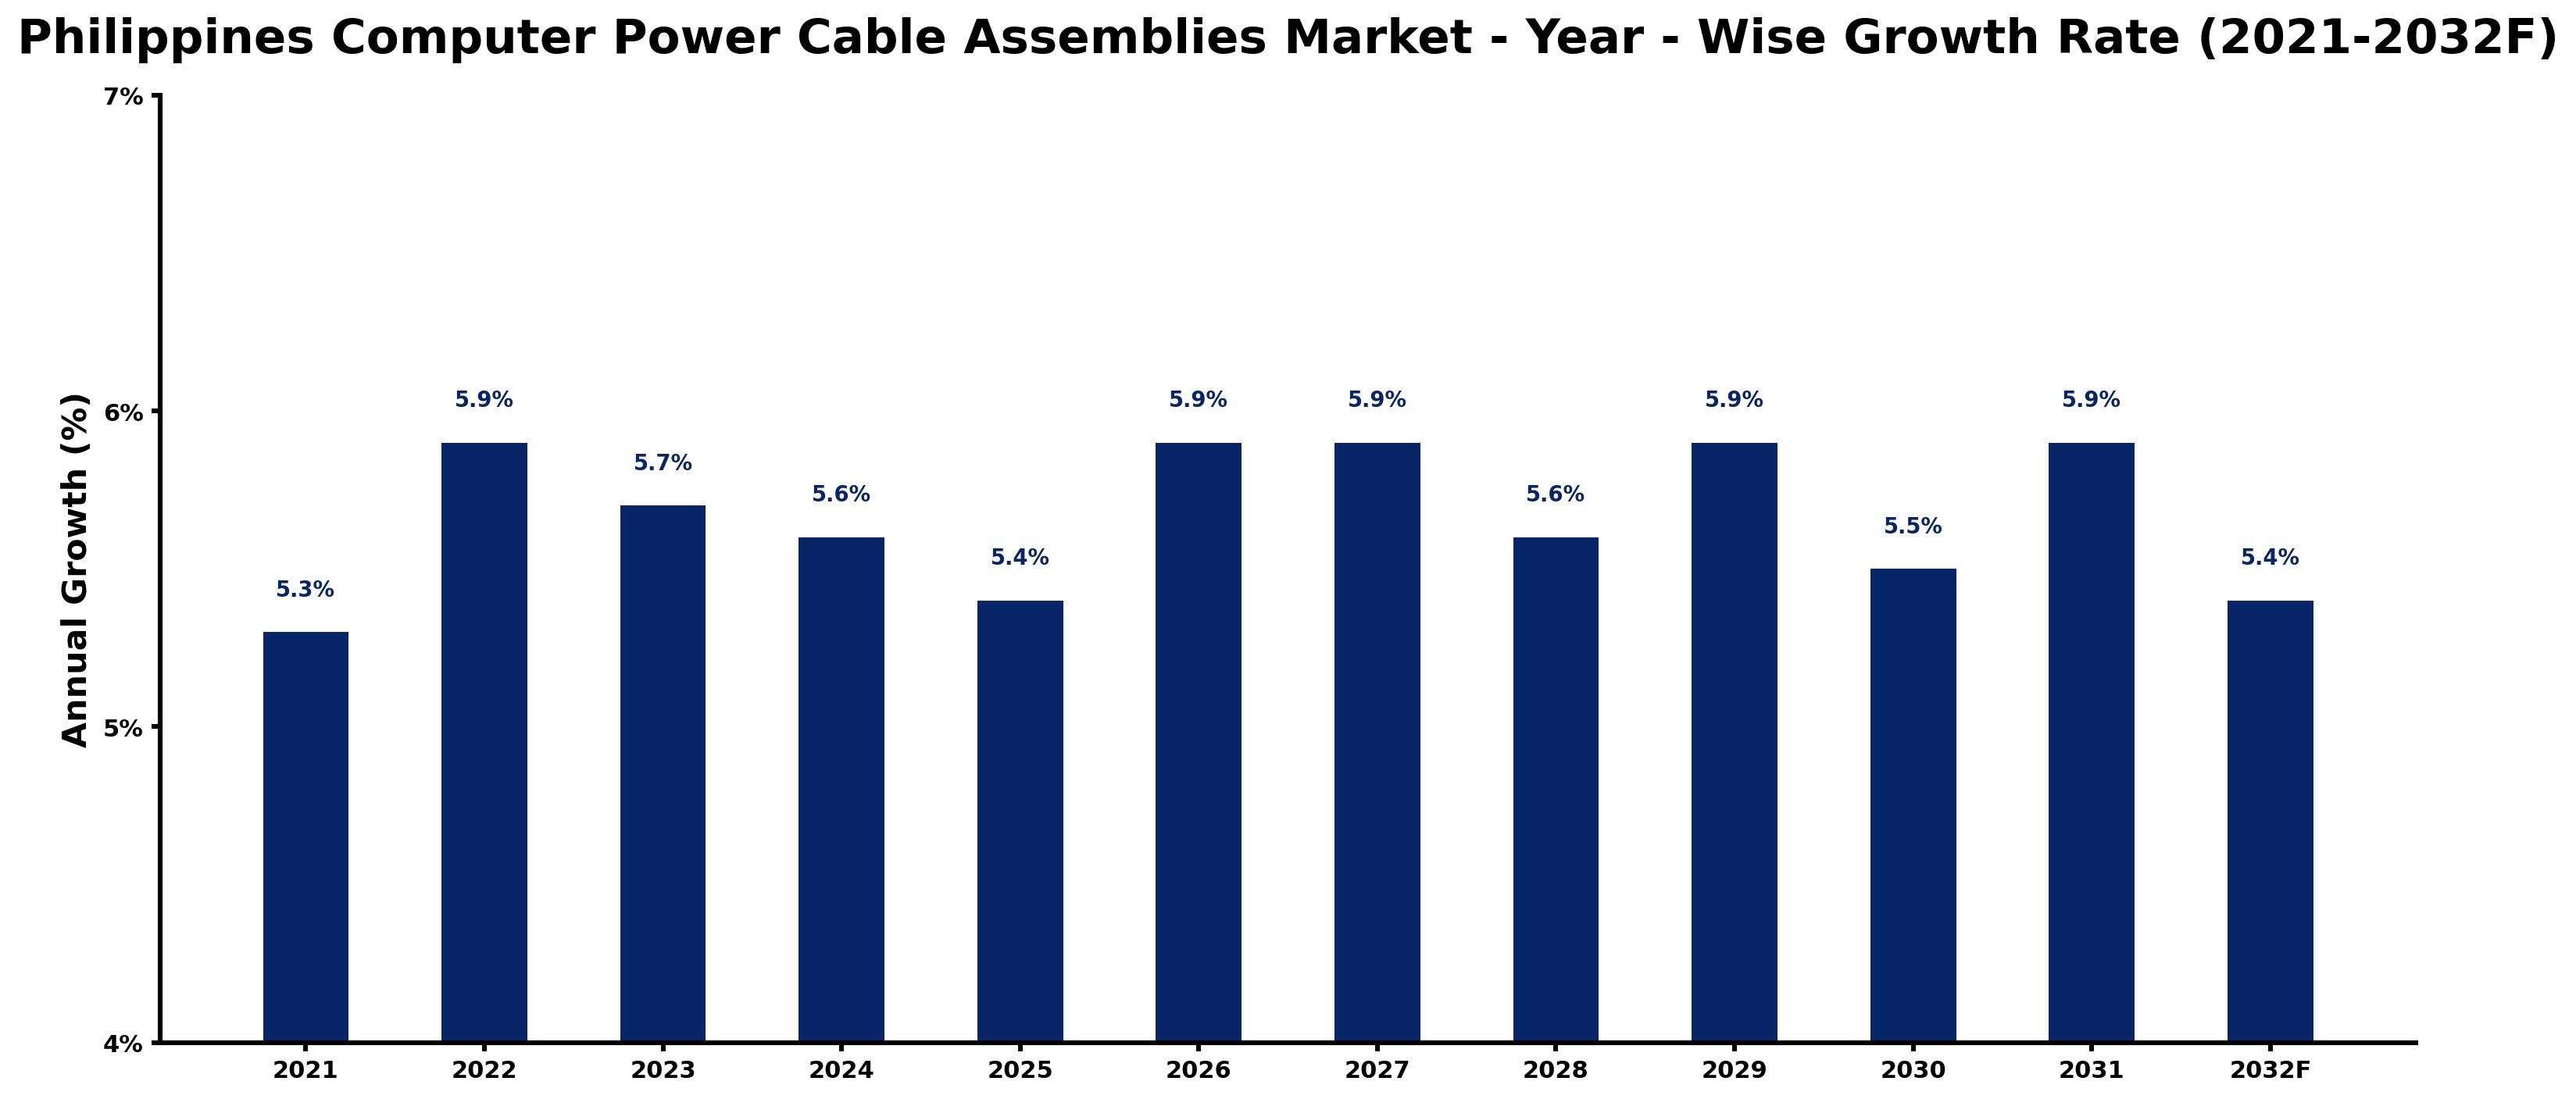
Philippines Computer Power Cable Assemblies Market Growth Rate Analysis (2021-2032)
The Philippine Computer Power Cable Assemblies market has exhibited steady growth, marked by a yearly increase of 5.3% in 2021, peaking at 5.9% in 2022 and again in 2026 and 2027. This growth can be largely attributed to rising consumer demand driven by the accelerated digitalization across various sectors, which has prompted significant investments in infrastructure and technology upgrades. Although growth slightly moderated to 5.4% in 2025, it remains stable, reflecting ongoing industrial developments and government policies supporting energy transition initiatives. The anticipated compound growth rate of around 5.6% to 5.9% through 2032 indicates a robust market maintained by continuous innovations and energy efficiency demands.
Philippines Computer Power Cable Assemblies Market Year-wise Growth Rate and Key Drivers
This graph highlights how the Philippines Computer Power Cable Assemblies Market has steadily grown over the past five years, supported by major growth factors.
The table below presents the year wise growth rates along with the key drivers influencing the market
| Year | Growth Rate | Major Drivers |
| 2021 | 5.3% | Post-lockdown retail projects stimulated demand for reliable power cable assemblies. |
| 2022 | 5.9% | Emerging tech firms recognized the need for high-performance electrical infrastructure. |
| 2023 | 5.7% | Local manufacturers prioritized quality standards, boosting market competitiveness significantly. |
| 2024 | 5.6% | Infrastructure upgrades in urban areas created new opportunities for cable assembly suppliers. |
| 2025 | 5.4% | Emerging industries, like renewable energy, increased reliance on specialized power cables. |
| 2026 | 5.9% | Retail sectors investing in automation technology led to higher power assembly requirements. |
| 2027 | 5.9% | Consumer electronics expansion highlighted the necessity for robust cable assembly solutions. |
| 2028 | 5.6% | E-commerce growth prompted logistics hubs to improve electrical distribution systems significantly. |
| 2029 | 5.9% | Rural electrification projects necessitated durable and affordable power cable assemblies. |
| 2030 | 5.5% | Technological shifts towards electric vehicles influenced demand for specialized power solutions. |
| 2031 | 5.9% | Smart city initiatives prompted innovations in energy efficiency and infrastructure design. |
| 2032 | 5.4% | Increased foreign investments in manufacturing boosted demand for high-quality cable assemblies. |
Note - Market size estimations and growth projections presented in this report are based on 6Wresearch's advanced forecasting approach, validated with industry datasets as of June 2026.
Philippines Computer Power Cable Assemblies Market Synopsis
The Philippines Computer Power Cable Assemblies Market is projected to reach 5.9% and witness significant growth during the forecast period (2026-2032). The market is primarily driven by the increasing demand for consumer electronics and IT products, which is expected to surge due to the growing number of data centers and the rising government initiatives aimed at digitalization. This dynamic environment positions the Philippines as an emerging hub for computer power cable assemblies, catering to a diverse range of applications.
Philippines Computer Power Cable Assemblies Market Growth Drivers
The growth of the Philippines Computer Power Cable Assemblies Market is influenced by several key factors:
- The rising adoption of portable electronic devices such as laptops, tablets, and smartphones has propelled the demand for power cables in the Philippines. This trend is largely attributable to technological advancements that have made these devices more affordable and accessible.
- The extensive range of product choices available from various brands allows consumers to select their preferred power cable assemblies based on budget and quality, leading to an increase in sales figures.
- The exponential growth in cloud services usage globally has led to the establishment of multiple data centers within the Philippines, prompting businesses to transition their manual operations to digital platforms for enhanced efficiency.
- Government initiatives supporting digitalization further stimulate the market demand, as improved infrastructure attracts investments in IT solutions, including computer power cable assemblies.
- An increasing focus on sustainability and energy efficiency among consumers drives demand for innovative power cable solutions that meet modern standards.
Philippines Computer Power Cable Assemblies Market Challenges and Restraints
Despite the optimistic outlook for the Philippines Computer Power Cable Assemblies Market, several challenges need to be addressed:
- The fluctuating costs of raw materials, including PVC compounds and copper wires, have negatively impacted profit margins for manufacturers, creating hesitation in capital investments.
- Supply chain disruptions, exacerbated by global events, can lead to delays in production and delivery timelines, affecting the overall market growth.
- Competition from low-cost imports presents a significant challenge, as local manufacturers struggle to maintain pricing while ensuring quality standards.
- Technological advancements require continuous upgrades and innovations in product offerings, demanding ongoing investments in research and development from manufacturers.
- The need for adherence to international quality standards can pose operational challenges for local players, particularly for those lacking the necessary certifications.
Philippines Computer Power Cable Assemblies Market Government Investment and Initiatives
The Philippine government has been proactive in fostering an environment conducive to the growth of the computer power cable assemblies market. Key initiatives include:
- Investment in digital infrastructure has been prioritized, with significant public spending aimed at enhancing connectivity and technology access in both urban and rural areas.
- Policies encouraging foreign direct investment (FDI) into the technology and manufacturing sectors are designed to attract global players to set up operations in the Philippines, bolstering local production capabilities.
- The government's commitment to improving the education and skills development of the workforce is aimed at supporting the growing IT and electronics sectors, including the production of computer power cable assemblies.
- Regulatory frameworks are being established to promote environmentally friendly practices within the manufacturing industry, aligning with global sustainability goals.
- Public-private partnerships (PPPs) are being encouraged to promote innovation and technology transfer in the local market, further enhancing the competitiveness of domestic manufacturers.
Philippines Computer Power Cable Assemblies Market Latest Developments (May 2025 - June 2026)
Recent developments in the Philippines Computer Power Cable Assemblies Market indicate a shift towards more advanced manufacturing processes and sustainable material use. Innovations in power cable design aim to enhance energy efficiency and reduce environmental impact. Furthermore, collaborations between local and international firms are on the rise, fostering technology transfer and skills development within the industry. Regulatory updates are pushing for stricter compliance with international quality and safety standards, which could reshape procurement strategies among local manufacturers. As the market adapts to these changes, overall market sentiment remains positive, with expectations for continued investment and growth in the sector.
Philippines Computer Power Cable Assemblies Market - Key Attractiveness of the Report
- 10 Years of Market Numbers
- Historical Data Starting from 2022 to 2025
- Base Year: 2025
- Forecast Data until 2032
- Key Performance Indicators Impacting the Market
- Major Upcoming Developments and Projects
Key Highlights of the Report:
- Philippines Computer Power Cable Assemblies Market Outlook
- Market Size of Philippines Computer Power Cable Assemblies Market, 2025
- Forecast of Philippines Computer Power Cable Assemblies Market, 2032
- Historical Data and Forecast of Philippines Computer Power Cable Assemblies Revenues & Volume for the Period 2022-2032F
- Philippines Computer Power Cable Assemblies Market Trend Evolution
- Philippines Computer Power Cable Assemblies Market Drivers and Challenges
- Philippines Computer Power Cable Assemblies Price Trends
- Philippines Computer Power Cable Assemblies Porter's Five Forces
- Philippines Computer Power Cable Assemblies Industry Life Cycle
- Historical Data and Forecast of Philippines Computer Power Cable Assemblies Market Revenues & Volume By Types for the Period 2022-2032F
- Historical Data and Forecast of Philippines Computer Power Cable Assemblies Market Revenues & Volume By 4-Pin Molex for the Period 2022-2032F
- Historical Data and Forecast of Philippines Computer Power Cable Assemblies Market Revenues & Volume By 20-Pin ATX for the Period 2022-2032F
- Historical Data and Forecast of Philippines Computer Power Cable Assemblies Market Revenues & Volume By 26-Pin MDR for the Period 2022-2032F
- Historical Data and Forecast of Philippines Computer Power Cable Assemblies Market Revenues & Volume By 26-Pin SDR for the Period 2022-2032F
- Historical Data and Forecast of Philippines Computer Power Cable Assemblies Market Revenues & Volume By Applications for the Period 2022-2032F
- Historical Data and Forecast of Philippines Computer Power Cable Assemblies Market Revenues & Volume By PC for the Period 2022-2032F
- Historical Data and Forecast of Philippines Computer Power Cable Assemblies Market Revenues & Volume By Laptop for the Period 2022-2032F
- Historical Data and Forecast of Philippines Computer Power Cable Assemblies Market Revenues & Volume By Super Computer for the Period 2022-2032F
- Historical Data and Forecast of Philippines Computer Power Cable Assemblies Market Revenues & Volume By Others for the Period 2022-2032F
- Philippines Computer Power Cable Assemblies Import Export Trade Statistics
- Market Opportunity Assessment By Types
- Market Opportunity Assessment By Applications
- Philippines Computer Power Cable Assemblies Top Companies Market Share
- Philippines Computer Power Cable Assemblies Competitive Benchmarking By Technical and Operational Parameters
- Philippines Computer Power Cable Assemblies Company Profiles
- Philippines Computer Power Cable Assemblies Key Strategic Recommendations
Frequently Asked Questions About the Market Study (FAQs):
A1: The growth is primarily driven by the increasing demand for consumer electronics, the rise of data centers, and government initiatives for digitalization.
A2: Key challenges include rising raw material costs, competition from low-cost imports, and the need for adherence to international quality standards.
A3: The government is actively investing in digital infrastructure and creating policies to encourage foreign investment, contributing to the growth of the market.
A4: Recent developments include advancements in manufacturing processes, a focus on sustainable materials, and increased collaboration between local and international firms.
6Wresearch actively monitors the Philippines Computer Power Cable Assemblies Market and publishes its comprehensive annual report, highlighting emerging trends, growth drivers, revenue analysis, and forecast outlook. Our insights help businesses to make data-backed strategic decisions with ongoing market dynamics. Our analysts track relevent industries related to the Philippines Computer Power Cable Assemblies Market, allowing our clients with actionable intelligence and reliable forecasts tailored to emerging regional needs.
Yes, we provide customisation as per your requirements. To learn more, feel free to contact us on sales@6wresearch.com
1 Executive Summary |
2 Introduction |
2.1 Key Highlights of the Report |
2.2 Report Description |
2.3 Market Scope & Segmentation |
2.4 Research Methodology |
2.5 Assumptions |
3 Philippines Computer Power Cable Assemblies Market Overview |
3.1 Philippines Country Macro Economic Indicators |
3.2 Philippines Computer Power Cable Assemblies Market Revenues & Volume, 2022 & 2032F |
3.3 Philippines Computer Power Cable Assemblies Market - Industry Life Cycle |
3.4 Philippines Computer Power Cable Assemblies Market - Porter's Five Forces |
3.5 Philippines Computer Power Cable Assemblies Market Revenues & Volume Share, By Types, 2022 & 2032F |
3.6 Philippines Computer Power Cable Assemblies Market Revenues & Volume Share, By Applications, 2022 & 2032F |
4 Philippines Computer Power Cable Assemblies Market Dynamics |
4.1 Impact Analysis |
4.2 Market Drivers |
4.3 Market Restraints |
5 Philippines Computer Power Cable Assemblies Market Trends |
6 Philippines Computer Power Cable Assemblies Market, By Types |
6.1 Philippines Computer Power Cable Assemblies Market, By Types |
6.1.1 Overview and Analysis |
6.1.2 Philippines Computer Power Cable Assemblies Market Revenues & Volume, By Types, 2022-2032F |
6.1.3 Philippines Computer Power Cable Assemblies Market Revenues & Volume, By 4-Pin Molex, 2022-2032F |
6.1.4 Philippines Computer Power Cable Assemblies Market Revenues & Volume, By 20-Pin ATX, 2022-2032F |
6.1.5 Philippines Computer Power Cable Assemblies Market Revenues & Volume, By 26-Pin MDR, 2022-2032F |
6.1.6 Philippines Computer Power Cable Assemblies Market Revenues & Volume, By 26-Pin SDR, 2022-2032F |
6.2 Philippines Computer Power Cable Assemblies Market, By Applications |
6.2.1 Overview and Analysis |
6.2.2 Philippines Computer Power Cable Assemblies Market Revenues & Volume, By PC, 2022-2032F |
6.2.3 Philippines Computer Power Cable Assemblies Market Revenues & Volume, By Laptop, 2022-2032F |
6.2.4 Philippines Computer Power Cable Assemblies Market Revenues & Volume, By Super Computer, 2022-2032F |
6.2.5 Philippines Computer Power Cable Assemblies Market Revenues & Volume, By Others, 2022-2032F |
7 Philippines Computer Power Cable Assemblies Market Import-Export Trade Statistics |
7.1 Philippines Computer Power Cable Assemblies Market Export to Major Countries |
7.2 Philippines Computer Power Cable Assemblies Market Imports from Major Countries |
8 Philippines Computer Power Cable Assemblies Market Key Performance Indicators |
9 Philippines Computer Power Cable Assemblies Market - Opportunity Assessment |
9.1 Philippines Computer Power Cable Assemblies Market Opportunity Assessment, By Types, 2022 & 2032F |
9.2 Philippines Computer Power Cable Assemblies Market Opportunity Assessment, By Applications, 2022 & 2032F |
10 Philippines Computer Power Cable Assemblies Market - Competitive Landscape |
10.1 Philippines Computer Power Cable Assemblies Market Revenue Share, By Companies, 2025 |
10.2 Philippines Computer Power Cable Assemblies Market Competitive Benchmarking, By Operating and Technical Parameters |
11 Company Profiles |
12 Recommendations |
13 Disclaimer |
Global Go To Market Strategy - 2030
Export potential enables firms to identify high-growth global markets with greater confidence by combining advanced trade intelligence with a structured quantitative methodology. The framework analyzes emerging demand trends and country-level import patterns while integrating macroeconomic and trade datasets such as GDP and population forecasts, bilateral import–export flows, tariff structures, elasticity differentials between developed and developing economies, geographic distance, and import demand projections. Using weighted trade values from 2020–2024 as the base period to project country-to-country export potential for 2030, these inputs are operationalized through calculated drivers such as gravity model parameters, tariff impact factors, and projected GDP per-capita growth. Through an analysis of hidden potentials, demand hotspots, and market conditions that are most favorable to success, this method enables firms to focus on target countries, maximize returns, and global expansion with data, backed by accuracy.
By factoring in the projected importer demand gap that is currently unmet and could be potential opportunity, it identifies the potential for the Exporter (Country) among 190 countries, against the general trade analysis, which identifies the biggest importer or exporter.
To discover high-growth global markets and optimize your business strategy:
Click Here
Pricing
- Single User License$ 1,995
- Department License$ 2,400
- Site License$ 3,120
- Global License$ 3,795

Leadership Perspectives from Industry Events
Search
Thought Leadership and Analyst Meet


Our Clients
6WResearch In News
- Doha a strategic location for EV manufacturing hub: IPA Qatar
- Demand for luxury TVs surging in the GCC, says Samsung
- Empowering Growth: The Thriving Journey of Bangladesh’s Cable Industry
- Demand for luxury TVs surging in the GCC, says Samsung
- Video call with a traditional healer? Once unthinkable, it’s now common in South Africa
- Intelligent Buildings To Smooth GCC’s Path To Net Zero
Latest Reports
- Cape Verde Portable Hand-Thrown Extinguisher Market (2026-2032)
- Canada Portable Hand-Thrown Extinguisher Market (2026-2032)
- Cameroon Portable Hand-Thrown Extinguisher Market (2026-2032)
- Burundi Portable Hand-Thrown Extinguisher Market (2026-2032)
- Burkina Faso Portable Hand-Thrown Extinguisher Market (2026-2032)
- Bulgaria Portable Hand-Thrown Extinguisher Market (2026-2032)
- Brunei Portable Hand-Thrown Extinguisher Market (2026-2032)
- Botswana Portable Hand-Thrown Extinguisher Market (2026-2032)
- Bosnia and Herzegovina Portable Hand-Thrown Extinguisher Market (2026-2032)
- Bolivia Portable Hand-Thrown Extinguisher Market (2026-2032)
Industry Events and Analyst Meet

HIMTEX 2026

India Refining Summit 2026

India EV Show 2026

EV tech India Expo 2026

Auto Tech Asia 2026
Whitepaper
- Middle East & Africa Commercial Security Market Click here to view more.
- Middle East & Africa Fire Safety Systems & Equipment Market Click here to view more.
- GCC Drone Market Click here to view more.
- Middle East Lighting Fixture Market Click here to view more.
- GCC Physical & Perimeter Security Market Click here to view more.