Philippines Power Supply Market (2026-2032) | Trends, Outlook, Companies, Analysis, Revenue, Growth, Value, Industry, Forecast, Size & Share
Market Forecast By Output Power (Power Supply With Low Output (500 W and Below), Power Supply With Medium Output (500–1,000 W), Power Supply With High Output (More Than 1,000 W)), By Type (AC-DC Power Supply, DC-DC Power Supply), By Vertical (Medical & Healthcare, Military & Aerospace, Telecommunications, Consumer Electronics, Transportation, Lighting, Food & Beverages, Industrial) And Competitive Landscape
| Product Code: ETC014209 | Publication Date: Jul 2023 | Updated Date: Jun 2026 | Product Type: Report | |
| Publisher: 6Wresearch | Author: Ravi Bhandari | No. of Pages: 70 | No. of Figures: 35 | No. of Tables: 5 |
Philippines Power Supply Market Summary
The philippines power supply market was estimated at USD 867 Million in 2025 and is projected to reach USD 1252 Million by 2032, growing at a CAGR of 6.2% from 2026 to 2032.
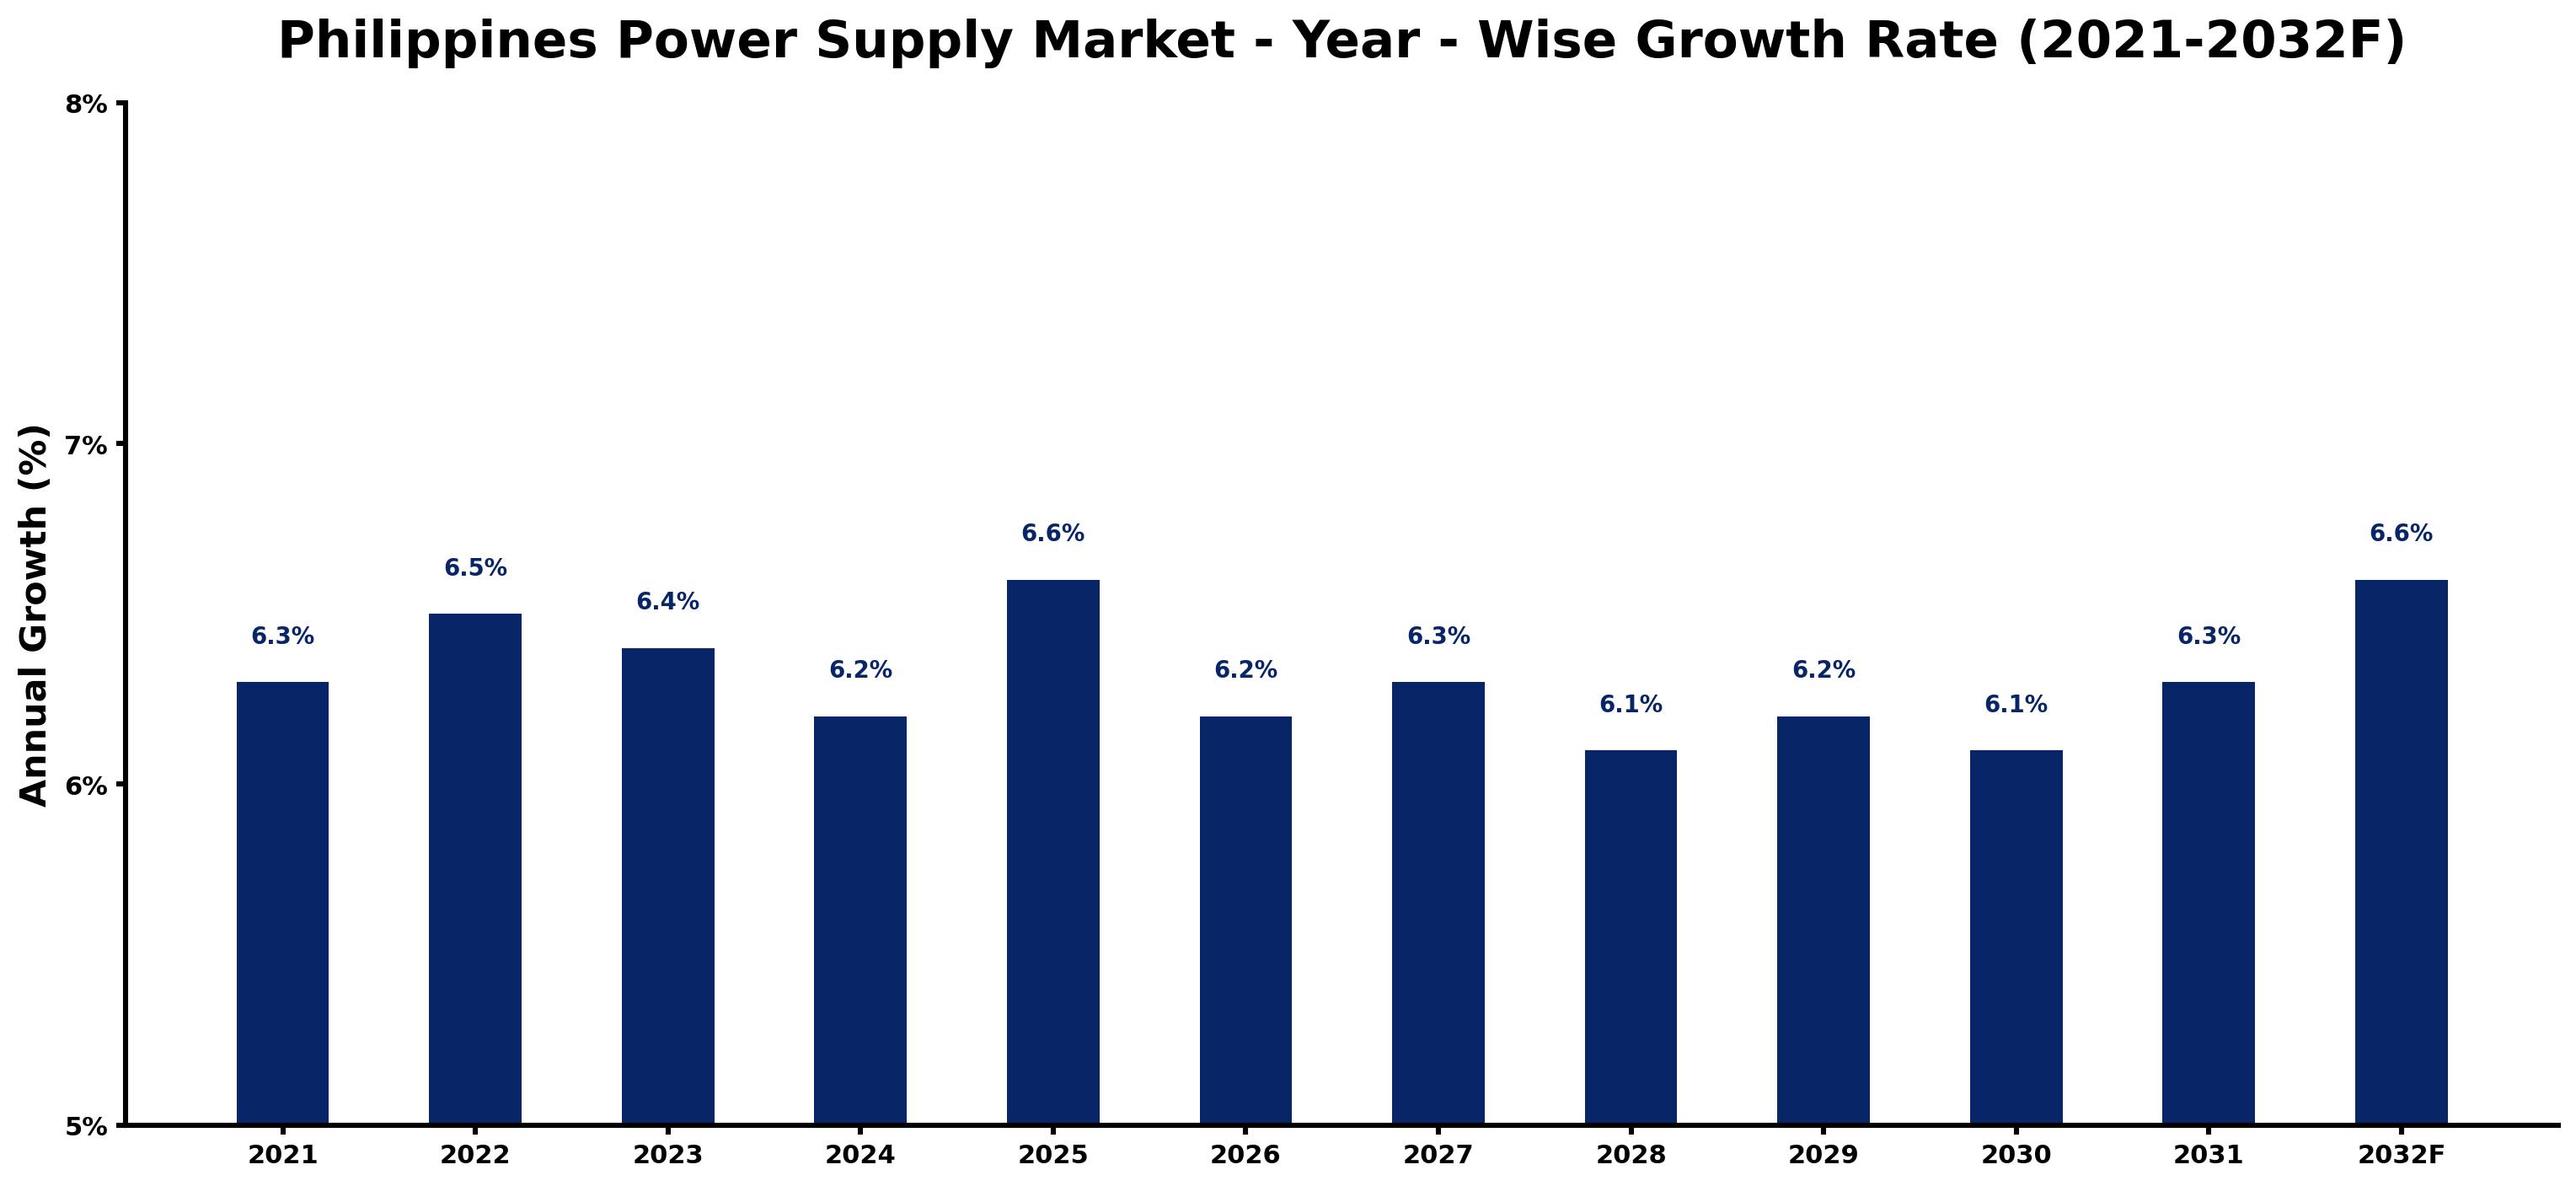
Philippines Power Supply Market Growth Rate Analysis (2021-2032)
The Philippines Power Supply Market has showcased stable annual growth, with rates of 6.3% in 2021, increasing to 6.5% in 2022. Despite a slight dip to 6.4% in 2023, the market rebounded in 2025 with a projected growth of 6.6%, driven by significant investments in renewable energy infrastructure and technology integration. The government's push for energy transition continues to spur demand, particularly as consumer awareness and demand for sustainable solutions grow. However, fluctuations, such as the anticipated 6.1% growth in 2028, may arise from regulatory adjustments and external economic conditions. Overall, a steady commitment to modernizing the power supply framework suggests a resilient growth path moving forward.
Philippines Power Supply Market Year-wise Growth Rate and Key Drivers
This graph highlights how the Philippines Power Supply Market has steadily grown over the past five years, supported by major growth factors.
The table below presents the year wise growth rates along with the key drivers influencing the market
| Year | Growth Rate | Major Drivers |
| 2021 | 6.3% | Domestic energy consumption patterns began shifting towards renewable sources across sectors. |
| 2022 | 6.5% | International investments attracted players interested in expanding electricity generation capacity. |
| 2023 | 6.4% | Public-private partnerships initiated large-scale infrastructure projects addressing power generation gaps. |
| 2024 | 6.2% | Technological innovations in solar energy applications significantly enhanced adoption rates nationwide. |
| 2025 | 6.6% | Rural electrification projects gained momentum, improving access for underserved communities. |
| 2026 | 6.2% | Consumer awareness regarding sustainable energy options prompted market diversification strategies. |
| 2027 | 6.3% | Local manufacturing of renewable energy solutions emerged as a key economic driver. |
| 2028 | 6.1% | Supply chain efficiencies in power distribution networks significantly reduced operational costs. |
| 2029 | 6.2% | Emerging energy storage technologies enhanced reliability and stability of renewable sources. |
| 2030 | 6.1% | Corporate social responsibility initiatives increasingly prioritized sustainable energy sourcing practices. |
| 2031 | 6.3% | Energy transition discussions highlighted the importance of balancing economic growth with sustainability. |
| 2032 | 6.6% | Digital transformation in energy management systems optimized consumption and efficiency across industries. |
Note - Market size estimations and growth projections presented in this report are based on 6Wresearch's advanced forecasting approach, validated with industry datasets as of June 2026.
Philippines Power Supply Market Synopsis
The Philippines Power Supply Market is projected to reach 6.2% and witness significant growth during the forecast period (2026-2032). This anticipated expansion is primarily driven by the burgeoning population and accelerated industrialization within the country, which have led to a marked increase in energy demand. Coupled with the government's proactive stance towards renewable energy sources, including solar, wind, and biomass, this market is well-positioned for substantial development. The ongoing investments by various entities in green energy solutions are expected to play a crucial role in advancing the Philippines' energy landscape, aligning with global commitments to combat climate change under the Paris Agreement.
Philippines Power Supply Market Growth Drivers
Several factors are propelling the growth of the Philippines Power Supply Market. The critical drivers include:
- The rapid increase in population has created a pressing demand for reliable and sustainable energy solutions to cater to residential and commercial needs.
- Industrialization is at an all-time high, further intensifying the demand for electricity across various sectors including manufacturing, services, and agriculture.
- Government initiatives promoting renewable energy sources inspire investor confidence, leading to an influx of funding into the sector.
- Technological advancements in energy generation and storage solutions are making renewable options more feasible and cost-effective for various stakeholders.
- The need for energy security and independence from foreign energy sources is driving interest in domestic energy production.
Philippines Power Supply Market Trends and Opportunities
The Philippines Power Supply Market is evolving with key trends that present numerous opportunities for growth. These include:
- An increasing focus on diversifying energy sources, particularly through the adoption of solar and wind power, is forecasted to create a more resilient energy framework.
- The integration of smart grid technology is anticipated to enhance energy efficiency and reliability across the country.
- Partnerships between public institutions and private stakeholders are becoming more common, creating synergies that benefit the energy sector.
- Research and development investments are fostering innovation in energy solutions, leading to the emergence of more effective renewable technologies.
- Environmental sustainability initiatives are encouraging businesses to adopt green practices, which can be capitalized upon by energy suppliers.
Philippines Power Supply Market Challenges and Restraints
While the Philippines Power Supply Market exhibits significant growth potential, it also faces certain challenges that could hinder progress. Key restraints include:
- Infrastructure deficits, particularly in rural areas, continue to pose a challenge for the distribution of electricity to all regions.
- Regulatory hurdles and policy inconsistencies can deter potential investors and slow down project implementation.
- Volatility in global energy prices could pose financial risks to renewable energy initiatives and overall market stability.
- Public skepticism about renewable energy technologies may impede widespread adoption among consumers.
- Competition from traditional energy sources, particularly fossil fuels, remains a substantial barrier to the growth of renewable alternatives.
Philippines Power Supply Market Government Investment and Initiatives
The Philippine government has adopted a proactive approach towards stimulating the Power Supply Market through various investment initiatives and policies. Key actions include:
- The Department of Energy (DOE) actively promotes investment in the renewable sector through various incentive programs and grants aimed to attract both local and foreign investors.
- Policy measures such as the Renewable Energy Act encourage the development and utilization of renewable energy resources to meet the country's growing demands.
- The government's commitment to achieving energy self-sufficiency is evident in its efforts to support the establishment of more energy generation facilities across the nation.
- Initiatives aimed at improving energy efficiency in both public and private sectors are being enforced, which helps reduce overall energy consumption.
- Collaborative projects with international bodies and NGOs are underway to enhance technical expertise and funding capabilities in the renewable energy sector.
Philippines Power Supply Market Latest Developments (May 2025 - June 2026)
Recent developments in the Philippines Power Supply Market indicate an ongoing transformation towards a more sustainable energy framework. During the specified period, several notable industry movements include:
- Increased government action towards establishing regulatory frameworks that facilitate smoother integration of renewable energy sources into the existing grid.
- A rise in public-private partnerships aimed at financing large-scale renewable projects, which is enhancing overall energy infrastructure.
- Growing investments in battery storage technologies that enable better management of intermittent renewable energy supplies.
- Heightened awareness and educational campaigns regarding the benefits of renewable energy among the Filipino population, leading to increased public participation.
- Strategic collaborations between local communities and developers to ensure that renewable projects meet local energy needs and contribute to sustainable development goals.
Philippines Power Supply Market - Key Attractiveness of the Report
- 10 Years of Market Numbers
- Historical Data Starting from 2022 to 2025
- Base Year: 2025
- Forecast Data until 2032
- Key Performance Indicators Impacting the Market
- Major Upcoming Developments and Projects
Key Highlights of the Report:
- Philippines Power Supply Market Outlook
- Market Size of Philippines Power Supply Market, 2025
- Forecast of Philippines Power Supply Market, 2032F
- Historical Data and Forecast of Philippines Power Supply Revenues & Volume for the Period 2022-2032F
- Philippines Power Supply Market Trend Evolution
- Philippines Power Supply Market Drivers and Challenges
- Philippines Power Supply Price Trends
- Philippines Power Supply Porter's Five Forces
- Philippines Power Supply Industry Life Cycle
- Historical Data and Forecast of Philippines Power Supply Market Revenues & Volume By Output Power for the Period 2022-2032F
- Historical Data and Forecast of Philippines Power Supply Market Revenues & Volume By Power Supply With Low Output (500 W and Below) for the Period 2022-2032F
- Historical Data and Forecast of Philippines Power Supply Market Revenues & Volume By Power Supply With Medium Output (500?1,000 W) for the Period 2022-2032F
- Historical Data and Forecast of Philippines Power Supply Market Revenues & Volume By Power Supply With High Output (More Than 1,000 W) for the Period 2022-2032F
- Historical Data and Forecast of Philippines Power Supply Market Revenues & Volume By Type for the Period 2022-2032F
- Historical Data and Forecast of Philippines Power Supply Market Revenues & Volume By AC-DC Power Supply for the Period 2022-2032F
- Historical Data and Forecast of Philippines Power Supply Market Revenues & Volume By DC-DC Power Supply for the Period 2022-2032F
- Historical Data and Forecast of Philippines Power Supply Market Revenues & Volume By Vertical for the Period 2022-2032F
- Historical Data and Forecast of Philippines Power Supply Market Revenues & Volume By Medical & Healthcare for the Period 2022-2032F
- Historical Data and Forecast of Philippines Power Supply Market Revenues & Volume By Military & Aerospace for the Period 2022-2032F
- Historical Data and Forecast of Philippines Power Supply Market Revenues & Volume By Telecommunications for the Period 2022-2032F
- Historical Data and Forecast of Philippines Power Supply Market Revenues & Volume By Consumer Electronics for the Period 2022-2032F
- Historical Data and Forecast of Philippines Power Supply Market Revenues & Volume By Transportation for the Period 2022-2032F
- Historical Data and Forecast of Philippines Power Supply Market Revenues & Volume By Lighting for the Period 2022-2032F
- Historical Data and Forecast of Philippines Power Supply Market Revenues & Volume By Food & Beverages for the Period 2022-2032F
- Historical Data and Forecast of Philippines Power Supply Market Revenues & Volume By Industrial for the Period 2022-2032F
- Philippines Power Supply Import Export Trade Statistics
- Market Opportunity Assessment By Output Power
- Market Opportunity Assessment By Type
- Market Opportunity Assessment By Vertical
- Philippines Power Supply Top Companies Market Share
- Philippines Power Supply Competitive Benchmarking By Technical and Operational Parameters
- Philippines Power Supply Company Profiles
- Philippines Power Supply Key Strategic Recommendations
Frequently Asked Questions About the Market Study (FAQs):
The growth is primarily driven by increasing population, industrialization, and a governmental push towards renewable energy sources.
The government plays a crucial role through investments, policy frameworks, and initiatives aimed at promoting renewable energy and improving overall energy infrastructure.
Key challenges include infrastructure deficits, regulatory complexities, and the competition posed by traditional energy sources.
Opportunities include advancements in renewable technologies, increased investments in energy storage, and public-private partnerships that enhance project viability.
6Wresearch actively monitors the Philippines Power Supply Market and publishes its comprehensive annual report, highlighting emerging trends, growth drivers, revenue analysis, and forecast outlook. Our insights help businesses to make data-backed strategic decisions with ongoing market dynamics. Our analysts track relevent industries related to the Philippines Power Supply Market, allowing our clients with actionable intelligence and reliable forecasts tailored to emerging regional needs.
Yes, we provide customisation as per your requirements. To learn more, feel free to contact us on sales@6wresearch.com
1 Executive Summary |
2 Introduction |
2.1 Key Highlights of the Report |
2.2 Report Description |
2.3 Market Scope & Segmentation |
2.4 Research Methodology |
2.5 Assumptions |
3 Philippines Power Supply Market Overview |
3.1 Philippines Country Macro Economic Indicators |
3.2 Philippines Power Supply Market Revenues & Volume, 2022 & 2032F |
3.3 Philippines Power Supply Market - Industry Life Cycle |
3.4 Philippines Power Supply Market - Porter's Five Forces |
3.5 Philippines Power Supply Market Revenues & Volume Share, By Output Power, 2022 & 2032F |
3.6 Philippines Power Supply Market Revenues & Volume Share, By Type, 2022 & 2032F |
3.7 Philippines Power Supply Market Revenues & Volume Share, By Vertical, 2022 & 2032F |
4 Philippines Power Supply Market Dynamics |
4.1 Impact Analysis |
4.2 Market Drivers |
4.3 Market Restraints |
5 Philippines Power Supply Market Trends |
6 Philippines Power Supply Market, By Types |
6.1 Philippines Power Supply Market, By Output Power |
6.1.1 Overview and Analysis |
6.1.2 Philippines Power Supply Market Revenues & Volume, By Output Power, 2022-2032F |
6.1.3 Philippines Power Supply Market Revenues & Volume, By Power Supply With Low Output (500 W and Below), 2022-2032F |
6.1.4 Philippines Power Supply Market Revenues & Volume, By Power Supply With Medium Output (500?1,000 W), 2022-2032F |
6.1.5 Philippines Power Supply Market Revenues & Volume, By Power Supply With High Output (More Than 1,000 W), 2022-2032F |
6.2 Philippines Power Supply Market, By Type |
6.2.1 Overview and Analysis |
6.2.2 Philippines Power Supply Market Revenues & Volume, By AC-DC Power Supply, 2022-2032F |
6.2.3 Philippines Power Supply Market Revenues & Volume, By DC-DC Power Supply, 2022-2032F |
6.3 Philippines Power Supply Market, By Vertical |
6.3.1 Overview and Analysis |
6.3.2 Philippines Power Supply Market Revenues & Volume, By Medical & Healthcare, 2022-2032F |
6.3.3 Philippines Power Supply Market Revenues & Volume, By Military & Aerospace, 2022-2032F |
6.3.4 Philippines Power Supply Market Revenues & Volume, By Telecommunications, 2022-2032F |
6.3.5 Philippines Power Supply Market Revenues & Volume, By Consumer Electronics, 2022-2032F |
6.3.6 Philippines Power Supply Market Revenues & Volume, By Transportation, 2022-2032F |
6.3.7 Philippines Power Supply Market Revenues & Volume, By Lighting, 2022-2032F |
6.3.8 Philippines Power Supply Market Revenues & Volume, By Industrial, 2022-2032F |
6.3.9 Philippines Power Supply Market Revenues & Volume, By Industrial, 2022-2032F |
7 Philippines Power Supply Market Import-Export Trade Statistics |
7.1 Philippines Power Supply Market Export to Major Countries |
7.2 Philippines Power Supply Market Imports from Major Countries |
8 Philippines Power Supply Market Key Performance Indicators |
9 Philippines Power Supply Market - Opportunity Assessment |
9.1 Philippines Power Supply Market Opportunity Assessment, By Output Power, 2022 & 2032F |
9.2 Philippines Power Supply Market Opportunity Assessment, By Type, 2022 & 2032F |
9.3 Philippines Power Supply Market Opportunity Assessment, By Vertical, 2022 & 2032F |
10 Philippines Power Supply Market - Competitive Landscape |
10.1 Philippines Power Supply Market Revenue Share, By Companies, 2025 |
10.2 Philippines Power Supply Market Competitive Benchmarking, By Operating and Technical Parameters |
11 Company Profiles |
12 Recommendations |
13 Disclaimer |
Global Go To Market Strategy - 2030
Export potential enables firms to identify high-growth global markets with greater confidence by combining advanced trade intelligence with a structured quantitative methodology. The framework analyzes emerging demand trends and country-level import patterns while integrating macroeconomic and trade datasets such as GDP and population forecasts, bilateral import–export flows, tariff structures, elasticity differentials between developed and developing economies, geographic distance, and import demand projections. Using weighted trade values from 2020–2024 as the base period to project country-to-country export potential for 2030, these inputs are operationalized through calculated drivers such as gravity model parameters, tariff impact factors, and projected GDP per-capita growth. Through an analysis of hidden potentials, demand hotspots, and market conditions that are most favorable to success, this method enables firms to focus on target countries, maximize returns, and global expansion with data, backed by accuracy.
By factoring in the projected importer demand gap that is currently unmet and could be potential opportunity, it identifies the potential for the Exporter (Country) among 190 countries, against the general trade analysis, which identifies the biggest importer or exporter.
To discover high-growth global markets and optimize your business strategy:
Click Here
Pricing
- Single User License$ 1,995
- Department License$ 2,400
- Site License$ 3,120
- Global License$ 3,795

Leadership Perspectives from Industry Events
Search
Thought Leadership and Analyst Meet


Our Clients
6WResearch In News
- India Air Conditioner Market Set for Strong Rebound in 2026 After Weather-Led Correction and GST-Driven Recovery: 6Wresearch
- ADAS in India: How Automatic Emergency Braking, Blind Spot Detection & Driver Monitoring are Transforming Road Safety
- Doha a strategic location for EV manufacturing hub: IPA Qatar
- Demand for luxury TVs surging in the GCC, says Samsung
- Empowering Growth: The Thriving Journey of Bangladesh’s Cable Industry
- Demand for luxury TVs surging in the GCC, says Samsung
Latest Reports
- Poland Fire Protection Systems Market (2026-2032)
- Cape Verde Portable Hand-Thrown Extinguisher Market (2026-2032)
- Canada Portable Hand-Thrown Extinguisher Market (2026-2032)
- Cameroon Portable Hand-Thrown Extinguisher Market (2026-2032)
- Burundi Portable Hand-Thrown Extinguisher Market (2026-2032)
- Burkina Faso Portable Hand-Thrown Extinguisher Market (2026-2032)
- Bulgaria Portable Hand-Thrown Extinguisher Market (2026-2032)
- Brunei Portable Hand-Thrown Extinguisher Market (2026-2032)
- Botswana Portable Hand-Thrown Extinguisher Market (2026-2032)
- Bosnia and Herzegovina Portable Hand-Thrown Extinguisher Market (2026-2032)
Industry Events and Analyst Meet

HIMTEX 2026

India Refining Summit 2026

India EV Show 2026

EV tech India Expo 2026

Auto Tech Asia 2026
Whitepaper
- Middle East & Africa Commercial Security Market Click here to view more.
- Middle East & Africa Fire Safety Systems & Equipment Market Click here to view more.
- GCC Drone Market Click here to view more.
- Middle East Lighting Fixture Market Click here to view more.
- GCC Physical & Perimeter Security Market Click here to view more.