Philippines Tables Market (2026-2032) | Size, Outlook, Trends, Growth, Share, Forecast, Revenue, Industry, Analysis, Value & Companies
Market Forecast By Types (Fabric, Leather, Metal, Wooden, Others), By Applications (Family, Office, Others) And Competitive Landscape
| Product Code: ETC034669 | Publication Date: Jul 2023 | Updated Date: Jun 2026 | Product Type: Report | |
| Publisher: 6Wresearch | Author: Ravi Bhandari | No. of Pages: 70 | No. of Figures: 35 | No. of Tables: 5 |
Philippines Tables Market Summary
The philippines tables market was estimated at USD 449 Million in 2025 and is projected to reach USD 650 Million by 2032, growing at a CAGR of 6.3% from 2026 to 2032.
Philippines Tables Market Growth Rate Analysis (2021-2032)
The Philippines tables market has exhibited stable growth, with an annual increase of 6.4% in 2021, slightly declining to 6.3% in 2022 before rebounding to 6.5% in 2023. This resilience in growth can be attributed to rising consumer demand driven by increasing urbanization and a growing middle class, coupled with favorable infrastructure development initiatives. In 2024, growth is projected to further strengthen at 6.6% as manufacturers invest in innovative designs and sustainable materials. Although a minor slowdown to 6.1% is expected in 2027, the overall trend remains robust, with a peak growth of 6.7% anticipated in 2031, driven by digitalization in retail and a heightened focus on eco-friendly products.
Philippines Tables Market Year-wise Growth Rate and Key Drivers
This graph highlights how the Philippines Tables Market has steadily grown over the past five years, supported by major growth factors.
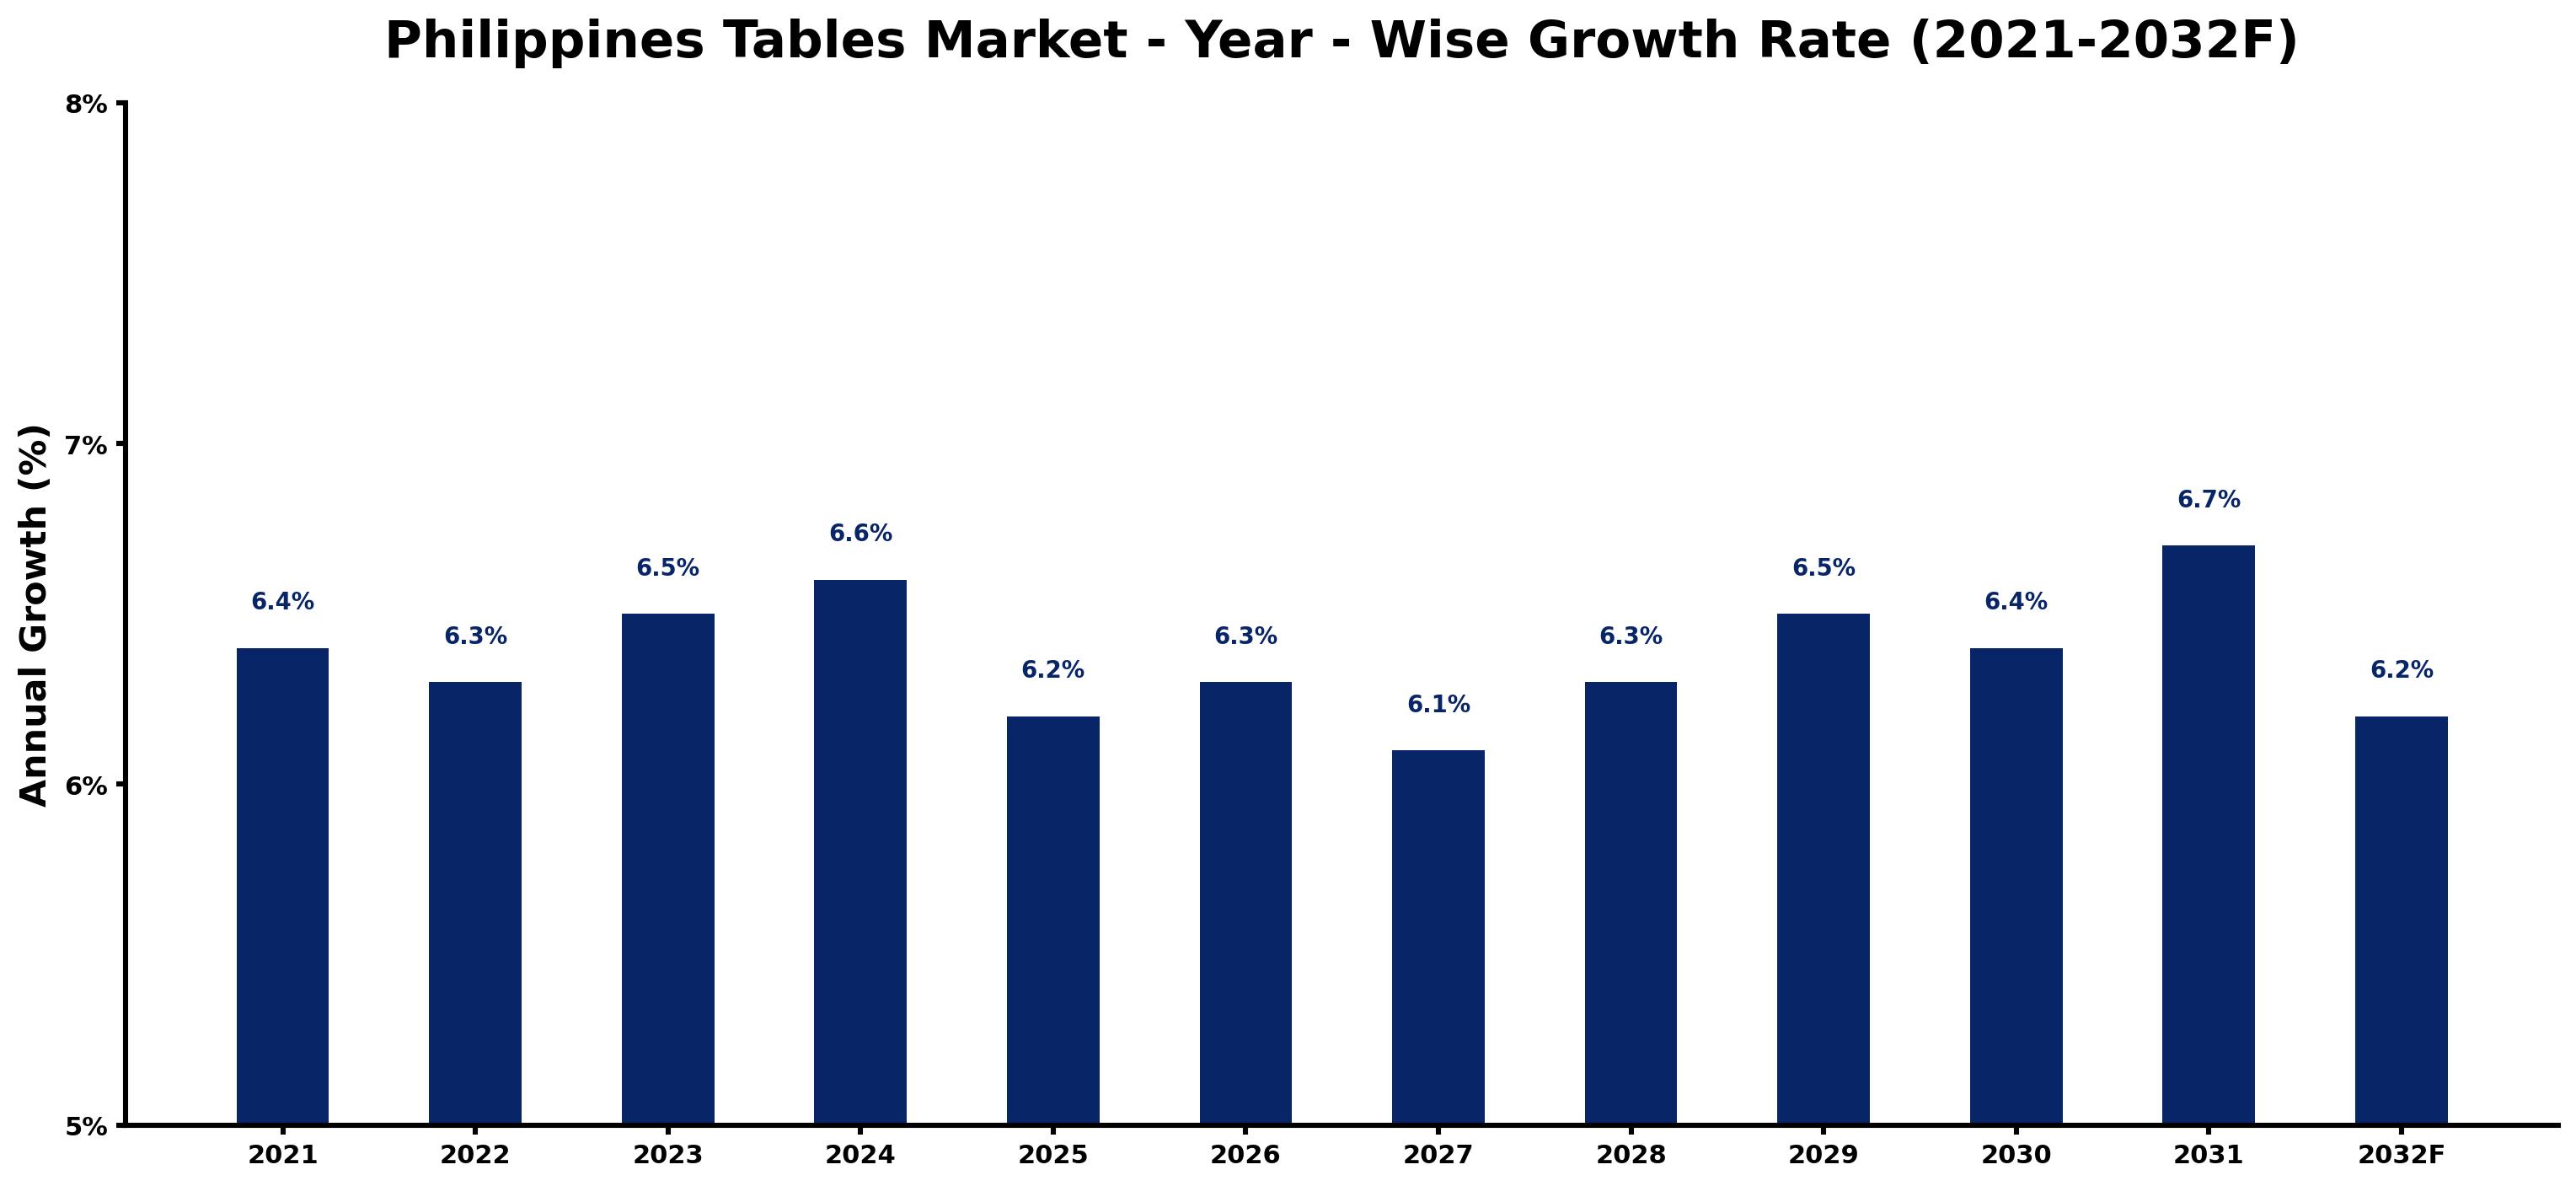
The table below presents the year wise growth rates along with the key drivers influencing the market
| Year | Growth Rate | Major Drivers |
| 2021 | 6.4% | Post-pandemic recovery sparked interest in home improvement and interior design. |
| 2022 | 6.3% | E-commerce platforms became key venues for purchasing diverse table designs. |
| 2023 | 6.5% | Urbanization trends prompted increased demand for space-efficient furniture solutions. |
| 2024 | 6.6% | Rising disposable incomes led consumers to invest in premium table materials. |
| 2025 | 6.2% | Influencer marketing strategies effectively showcased contemporary table styles and uses. |
| 2026 | 6.3% | Sustainability concerns guided consumers toward eco-friendly table production methods. |
| 2027 | 6.1% | Local artisans gained traction, highlighting unique cultural designs in furniture choices. |
| 2028 | 6.3% | Corporate investments in interior spaces correlated with growth in office table sales. |
| 2029 | 6.5% | School expansions increased demand for durable tables in educational settings. |
| 2030 | 6.4% | Advancements in manufacturing processes reduced costs and increased table variety. |
| 2031 | 6.7% | Home offices continued to shape consumer preferences for multi-functional table designs. |
| 2032 | 6.2% | Technological integration, like smart tables, emerged as a novel market segment. |
Note - Market size estimations and growth projections presented in this report are based on 6Wresearch's advanced forecasting approach, validated with industry datasets as of June 2026.
Philippines Tables Market Synopsis
The Philippines Tables Market is projected to reach 6.3% and witness significant growth during the forecast period (2026-2032). The market is anticipated to grow at a compound annual growth rate (CAGR) of 6.1%. This growth is primarily driven by an increasing population, rising disposable incomes, and evolving lifestyle trends that encourage the purchase of furniture, particularly tables. A heightened awareness of ergonomics and home décor has led consumers to seek stylish and functional designs, thereby enhancing demand for a variety of tables. Additionally, substantial investments in commercial infrastructure projects, such as hotels and restaurants, have further stimulated market growth.
Philippines Tables Market Growth Drivers
Several factors contribute to the growth of the Philippines Tables Market:
- The expanding population in urban areas is generating a higher demand for household furniture, including dining sets and other living room essentials.
- Rising disposable incomes are prompting consumers to invest more in home furnishings, leading to an increased preference for quality and designer tables.
- There is a growing trend toward home improvement and interior design, prompting consumers to purchase tables that enhance their living spaces.
- Significant government initiatives aimed at promoting local manufacturing have resulted in increased production capacity for domestic furniture companies.
- The robust growth of the tourism industry is providing fresh opportunities for the hospitality sector, demanding more restaurant and hotel furnishings.
Philippines Tables Market Challenges and Restraints
Despite its promising outlook, the Philippines Tables Market faces several challenges:
- Unfavorable economic conditions stemming from the COVID-19 pandemic have negatively impacted consumer spending on non-essential items.
- The pandemic has resulted in disruptions to supply chains, causing shortages that affect the availability of tables in the market.
- Fluctuations in price levels linked to global market dynamics may hinder consumers' purchasing power, particularly for higher-end products.
- Restrictions imposed during lockdown periods led to decreased physical store traffic, further affecting sales in the furniture sector.
- Potential shifts in consumer preferences toward sustainable furniture options may require adaptation from traditional manufacturers.
Philippines Tables Market Government Investment and Initiatives
The government of the Philippines has recognized the potential of the furniture industry, including the tables segment, and has initiated several key investments and policies:
- Implementation of favorable customs policies to incentivize local manufacturing and reduce reliance on imported goods.
- Support for small and medium enterprises in the furniture sector, helping them access funding and technical assistance to enhance production capabilities.
- Promotion of sustainable practices within the furniture manufacturing industry, encouraging the use of eco-friendly materials.
- Public spending on infrastructure projects is creating increased demand for furnishings in newly developed properties, including hotels and restaurants.
- Development of trade shows and exhibitions aimed at highlighting local craftsmanship and attracting both domestic and international buyers.
Philippines Tables Market Latest Developments (May 2025 - June 2026)
From May 2025 to June 2026, the Philippines Tables Market has experienced notable shifts, primarily influenced by ongoing economic recovery efforts post-COVID-19:
- Increased production activities have been observed as manufacturers adapt to meet the rising demand for tables in both residential and commercial sectors.
- Innovation in design has become a focal point, with companies introducing new styles and ergonomic options to cater to changing consumer preferences.
- Local manufacturers have begun collaborating more closely with interior designers to create bespoke table solutions tailored for specific market segments.
- Retail channels have diversified, with an uptick in online sales platforms enhancing customer accessibility to a wider array of table options.
- The government has intensified initiatives aimed at promoting sustainable furniture production, encouraging brands to adopt environmentally friendly practices.
Philippines Tables Market - Key Attractiveness of the Report
- 10 Years of Market Numbers
- Historical Data Starting from 2022 to 2025
- Base Year: 2025
- Forecast Data until 2032
- Key Performance Indicators Impacting the Market
- Major Upcoming Developments and Projects
Key Highlights of the Report:
- Philippines Tables Market Outlook
- Market Size of Philippines Tables Market, 2025
- Forecast of Philippines Tables Market, 2032
- Historical Data and Forecast of Philippines Tables Revenues & Volume for the Period 2022-2032F
- Philippines Tables Market Trend Evolution
- Philippines Tables Market Drivers and Challenges
- Philippines Tables Price Trends
- Philippines Tables Porter's Five Forces
- Philippines Tables Industry Life Cycle
- Historical Data and Forecast of Philippines Tables Market Revenues & Volume By Types for the Period 2022-2032F
- Historical Data and Forecast of Philippines Tables Market Revenues & Volume By Fabric for the Period 2022-2032F
- Historical Data and Forecast of Philippines Tables Market Revenues & Volume By Leather for the Period 2022-2032F
- Historical Data and Forecast of Philippines Tables Market Revenues & Volume By Metal for the Period 2022-2032F
- Historical Data and Forecast of Philippines Tables Market Revenues & Volume By Wooden for the Period 2022-2032F
- Historical Data and Forecast of Philippines Tables Market Revenues & Volume By Others for the Period 2022-2032F
- Historical Data and Forecast of Philippines Tables Market Revenues & Volume By Applications for the Period 2022-2032F
- Historical Data and Forecast of Philippines Tables Market Revenues & Volume By Family for the Period 2022-2032F
- Historical Data and Forecast of Philippines Tables Market Revenues & Volume By Office for the Period 2022-2032F
- Historical Data and Forecast of Philippines Tables Market Revenues & Volume By Others for the Period 2022-2032F
- Philippines Tables Import Export Trade Statistics
- Market Opportunity Assessment By Types
- Market Opportunity Assessment By Applications
- Philippines Tables Top Companies Market Share
- Philippines Tables Competitive Benchmarking By Technical and Operational Parameters
- Philippines Tables Company Profiles
- Philippines Tables Key Strategic Recommendations
Frequently Asked Questions About the Market Study (FAQs):
The growth is primarily driven by an increasing population, rising disposable incomes, and changing lifestyle preferences that favor stylish and functional tables.
The pandemic caused significant disruptions in supply chains and decreased consumer spending, negatively impacting sales and production in the tables market.
The government is promoting local manufacturing through favorable policies, supporting small enterprises, and advocating for sustainable practices in furniture production.
Recent trends include an increased focus on innovative design, collaboration between manufacturers and designers, and a rise in online sales channels.
6Wresearch actively monitors the Philippines Tables Market and publishes its comprehensive annual report, highlighting emerging trends, growth drivers, revenue analysis, and forecast outlook. Our insights help businesses to make data-backed strategic decisions with ongoing market dynamics. Our analysts track relevent industries related to the Philippines Tables Market, allowing our clients with actionable intelligence and reliable forecasts tailored to emerging regional needs.
Yes, we provide customisation as per your requirements. To learn more, feel free to contact us on sales@6wresearch.com
1 Executive Summary |
2 Introduction |
2.1 Key Highlights of the Report |
2.2 Report Description |
2.3 Market Scope & Segmentation |
2.4 Research Methodology |
2.5 Assumptions |
3 Philippines Tables Market Overview |
3.1 Philippines Country Macro Economic Indicators |
3.2 Philippines Tables Market Revenues & Volume, 2022 & 2032F |
3.3 Philippines Tables Market - Industry Life Cycle |
3.4 Philippines Tables Market - Porter's Five Forces |
3.5 Philippines Tables Market Revenues & Volume Share, By Types, 2022 & 2032F |
3.6 Philippines Tables Market Revenues & Volume Share, By Applications, 2022 & 2032F |
4 Philippines Tables Market Dynamics |
4.1 Impact Analysis |
4.2 Market Drivers |
4.3 Market Restraints |
5 Philippines Tables Market Trends |
6 Philippines Tables Market, By Types |
6.1 Philippines Tables Market, By Types |
6.1.1 Overview and Analysis |
6.1.2 Philippines Tables Market Revenues & Volume, By Types, 2022-2032F |
6.1.3 Philippines Tables Market Revenues & Volume, By Fabric, 2022-2032F |
6.1.4 Philippines Tables Market Revenues & Volume, By Leather, 2022-2032F |
6.1.5 Philippines Tables Market Revenues & Volume, By Metal, 2022-2032F |
6.1.6 Philippines Tables Market Revenues & Volume, By Wooden, 2022-2032F |
6.1.7 Philippines Tables Market Revenues & Volume, By Others, 2022-2032F |
6.2 Philippines Tables Market, By Applications |
6.2.1 Overview and Analysis |
6.2.2 Philippines Tables Market Revenues & Volume, By Family, 2022-2032F |
6.2.3 Philippines Tables Market Revenues & Volume, By Office, 2022-2032F |
6.2.4 Philippines Tables Market Revenues & Volume, By Others, 2022-2032F |
7 Philippines Tables Market Import-Export Trade Statistics |
7.1 Philippines Tables Market Export to Major Countries |
7.2 Philippines Tables Market Imports from Major Countries |
8 Philippines Tables Market Key Performance Indicators |
9 Philippines Tables Market - Opportunity Assessment |
9.1 Philippines Tables Market Opportunity Assessment, By Types, 2022 & 2032F |
9.2 Philippines Tables Market Opportunity Assessment, By Applications, 2022 & 2032F |
10 Philippines Tables Market - Competitive Landscape |
10.1 Philippines Tables Market Revenue Share, By Companies, 2025 |
10.2 Philippines Tables Market Competitive Benchmarking, By Operating and Technical Parameters |
11 Company Profiles |
12 Recommendations |
13 Disclaimer |
Global Go To Market Strategy - 2030
Export potential enables firms to identify high-growth global markets with greater confidence by combining advanced trade intelligence with a structured quantitative methodology. The framework analyzes emerging demand trends and country-level import patterns while integrating macroeconomic and trade datasets such as GDP and population forecasts, bilateral import–export flows, tariff structures, elasticity differentials between developed and developing economies, geographic distance, and import demand projections. Using weighted trade values from 2020–2024 as the base period to project country-to-country export potential for 2030, these inputs are operationalized through calculated drivers such as gravity model parameters, tariff impact factors, and projected GDP per-capita growth. Through an analysis of hidden potentials, demand hotspots, and market conditions that are most favorable to success, this method enables firms to focus on target countries, maximize returns, and global expansion with data, backed by accuracy.
By factoring in the projected importer demand gap that is currently unmet and could be potential opportunity, it identifies the potential for the Exporter (Country) among 190 countries, against the general trade analysis, which identifies the biggest importer or exporter.
To discover high-growth global markets and optimize your business strategy:
Click Here
Pricing
- Single User License$ 1,995
- Department License$ 2,400
- Site License$ 3,120
- Global License$ 3,795

Leadership Perspectives from Industry Events
Search
Thought Leadership and Analyst Meet


Our Clients
6WResearch In News
- India Air Conditioner Market Set for Strong Rebound in 2026 After Weather-Led Correction and GST-Driven Recovery: 6Wresearch
- ADAS in India: How Automatic Emergency Braking, Blind Spot Detection & Driver Monitoring are Transforming Road Safety
- Doha a strategic location for EV manufacturing hub: IPA Qatar
- Demand for luxury TVs surging in the GCC, says Samsung
- Empowering Growth: The Thriving Journey of Bangladesh’s Cable Industry
- Demand for luxury TVs surging in the GCC, says Samsung
Latest Reports
- Poland Fire Protection Systems Market (2026-2032)
- Cape Verde Portable Hand-Thrown Extinguisher Market (2026-2032)
- Canada Portable Hand-Thrown Extinguisher Market (2026-2032)
- Cameroon Portable Hand-Thrown Extinguisher Market (2026-2032)
- Burundi Portable Hand-Thrown Extinguisher Market (2026-2032)
- Burkina Faso Portable Hand-Thrown Extinguisher Market (2026-2032)
- Bulgaria Portable Hand-Thrown Extinguisher Market (2026-2032)
- Brunei Portable Hand-Thrown Extinguisher Market (2026-2032)
- Botswana Portable Hand-Thrown Extinguisher Market (2026-2032)
- Bosnia and Herzegovina Portable Hand-Thrown Extinguisher Market (2026-2032)
Industry Events and Analyst Meet

HIMTEX 2026

India Refining Summit 2026

India EV Show 2026

EV tech India Expo 2026

Auto Tech Asia 2026
Whitepaper
- Middle East & Africa Commercial Security Market Click here to view more.
- Middle East & Africa Fire Safety Systems & Equipment Market Click here to view more.
- GCC Drone Market Click here to view more.
- Middle East Lighting Fixture Market Click here to view more.
- GCC Physical & Perimeter Security Market Click here to view more.