Poland Balance Shaft Market (2025-2031) Outlook | Trends, Value, Share, Size, Revenue, Analysis, Companies, Growth, Forecast & Industry
Market Forecast By Engine Type (Inline-3 Cylinder, Inline-4 Cylinder, Inline-5 Cylinder, V-6 Cylinder), By Manufacturing Process (Forged , Cast Balance Shaft) And Competitive Landscape
| Product Code: ETC4576156 | Publication Date: Jul 2023 | Updated Date: Mar 2026 | Product Type: Report | |
| Publisher: 6Wresearch | Author: Ravi Bhandari | No. of Pages: 85 | No. of Figures: 45 | No. of Tables: 25 |
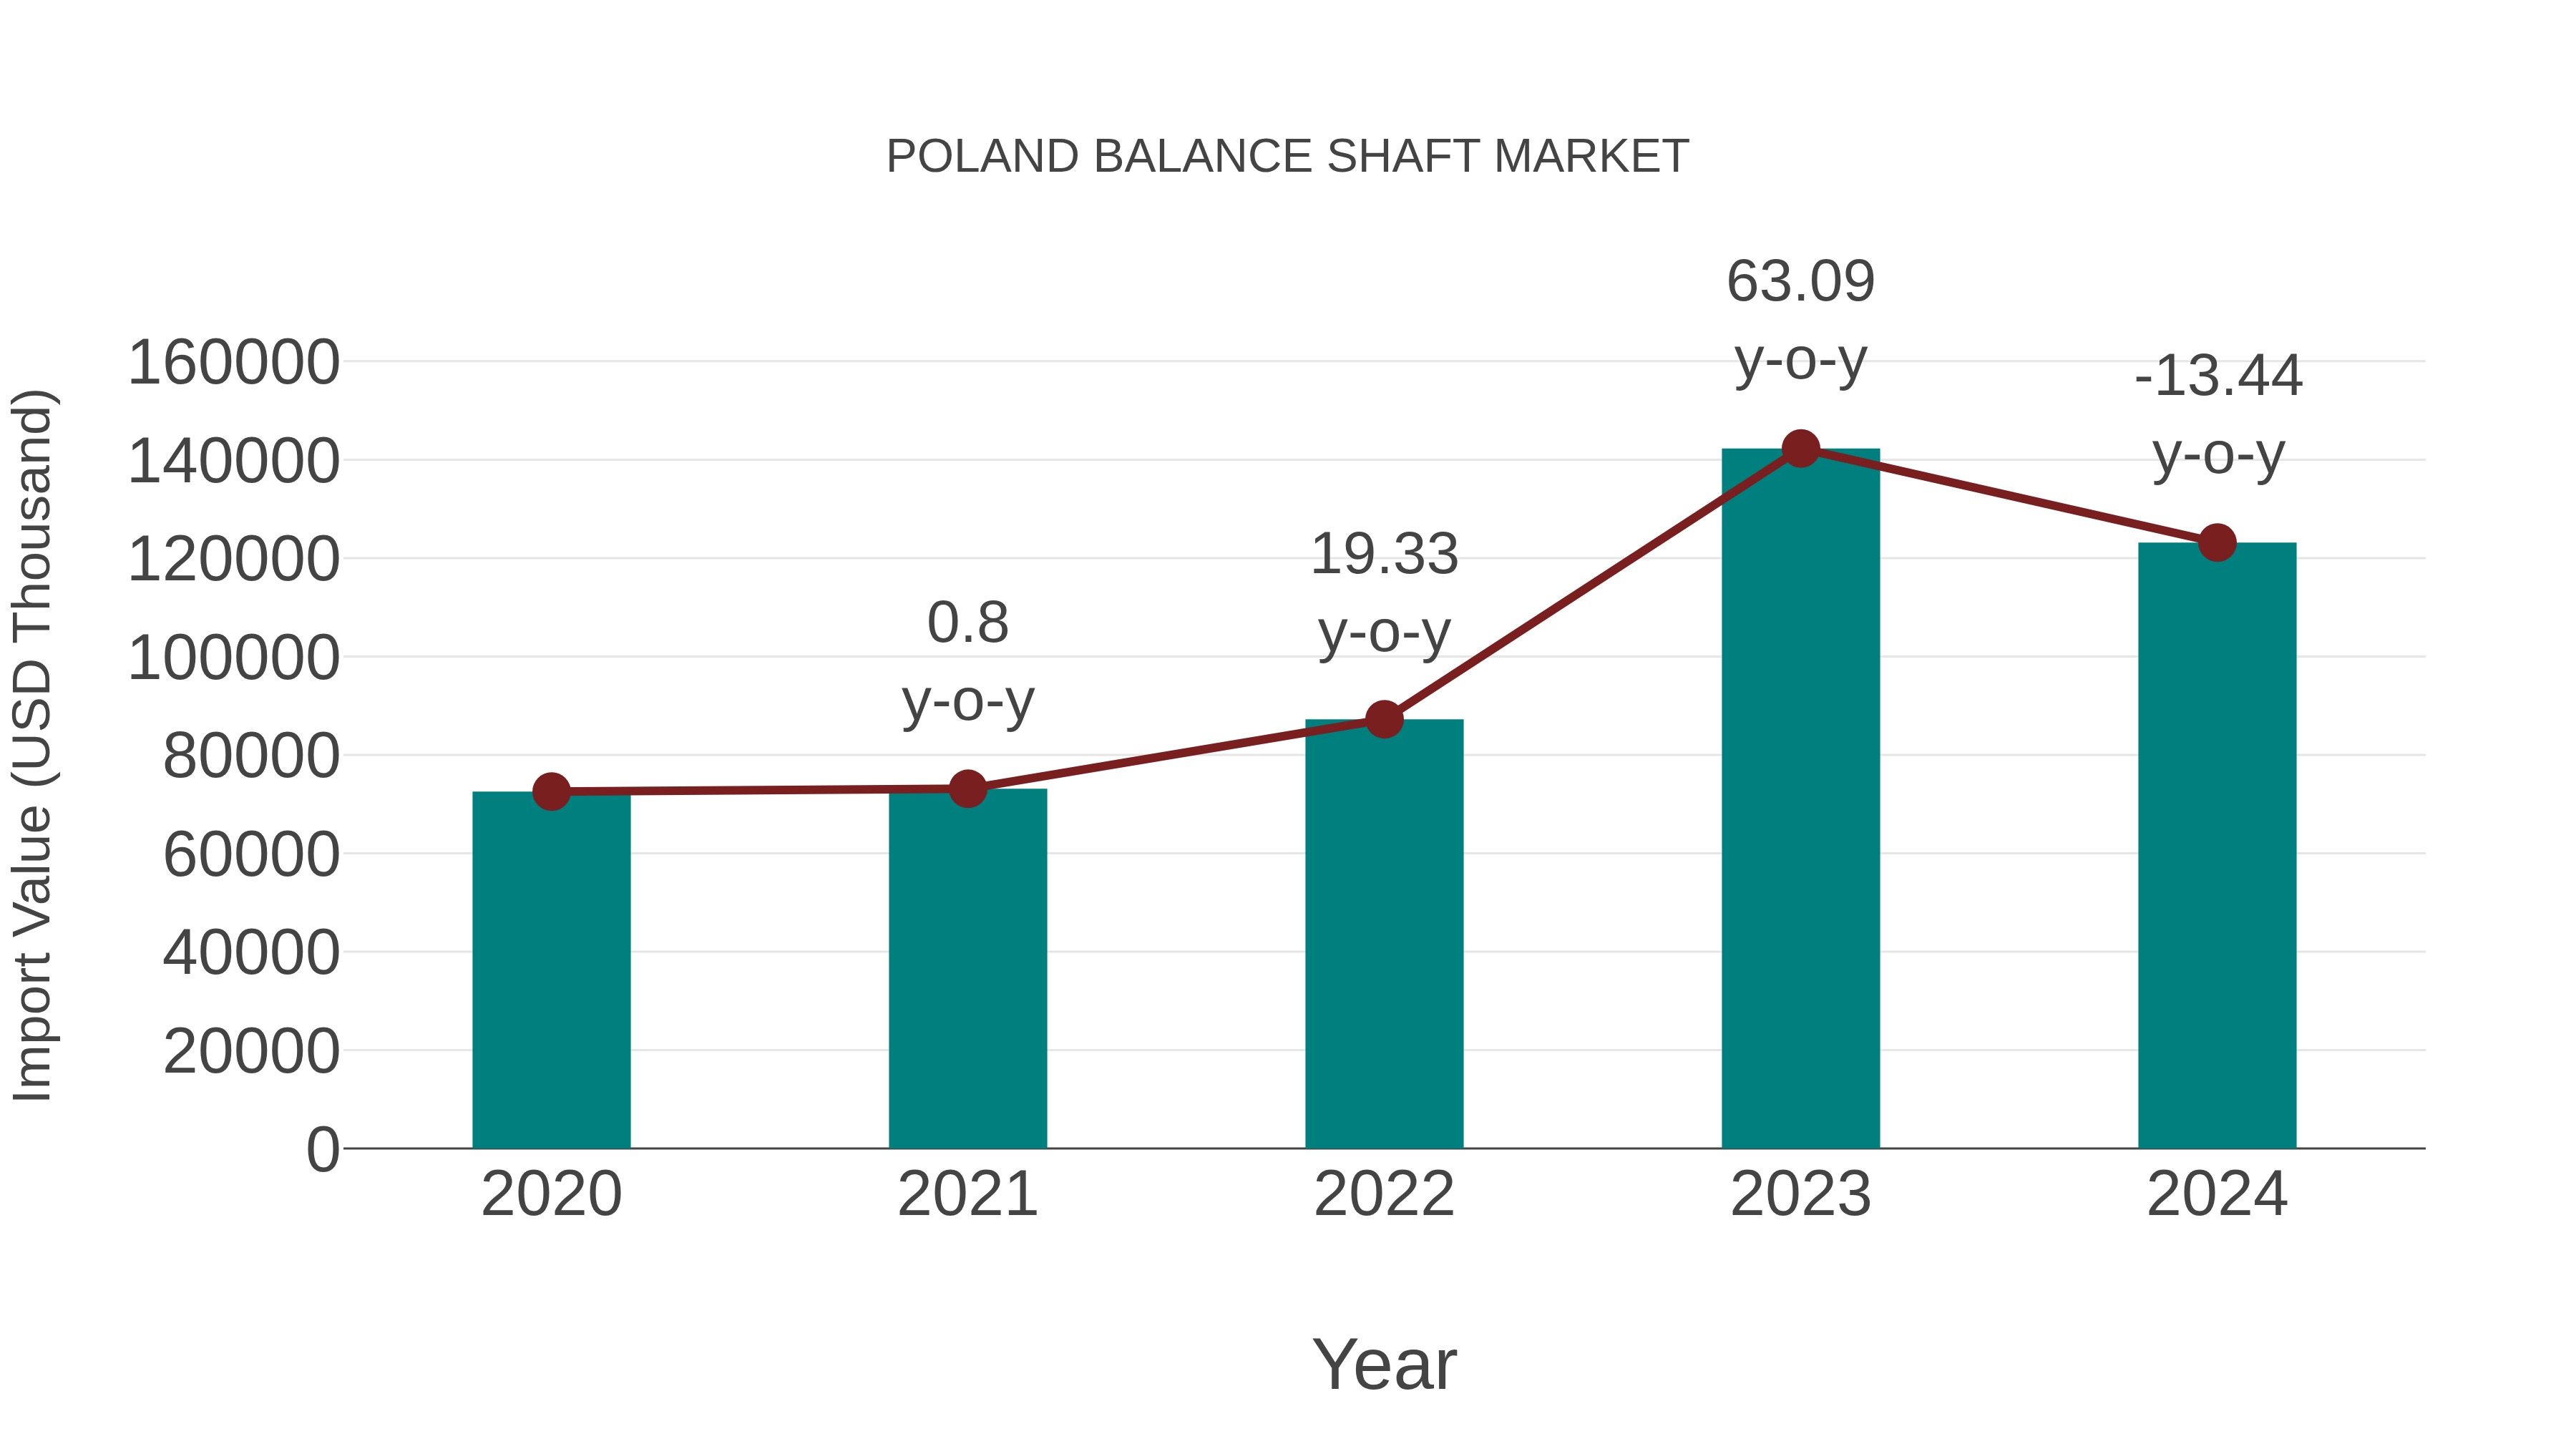
Poland Balance Shaft Market: Import Trend Analysis
In the Poland balance shaft market, the import trend experienced a decline from 2023 to 2024, with a growth rate of -13.44%. However, the compound annual growth rate (CAGR) for imports from 2020 to 2024 stood at a positive 14.15%. This dip in import momentum in 2024 could be attributed to shifting demand dynamics or changes in trade policies affecting market stability.
Key Highlights of the Report:
- Poland Balance Shaft Market Outlook
- Market Size of Poland Balance Shaft Market, 2024
- Forecast of Poland Balance Shaft Market, 2031
- Historical Data and Forecast of Poland Balance Shaft Revenues & Volume for the Period 2021 - 2031
- Poland Balance Shaft Market Trend Evolution
- Poland Balance Shaft Market Drivers and Challenges
- Poland Balance Shaft Price Trends
- Poland Balance Shaft Porter's Five Forces
- Poland Balance Shaft Industry Life Cycle
- Historical Data and Forecast of Poland Balance Shaft Market Revenues & Volume By Engine Type for the Period 2021 - 2031
- Historical Data and Forecast of Poland Balance Shaft Market Revenues & Volume By Inline-3 Cylinder for the Period 2021 - 2031
- Historical Data and Forecast of Poland Balance Shaft Market Revenues & Volume By Inline-4 Cylinder for the Period 2021 - 2031
- Historical Data and Forecast of Poland Balance Shaft Market Revenues & Volume By Inline-5 Cylinder for the Period 2021 - 2031
- Historical Data and Forecast of Poland Balance Shaft Market Revenues & Volume By V-6 Cylinder for the Period 2021 - 2031
- Historical Data and Forecast of Poland Balance Shaft Market Revenues & Volume By Manufacturing Process for the Period 2021 - 2031
- Historical Data and Forecast of Poland Balance Shaft Market Revenues & Volume By Forged for the Period 2021 - 2031
- Historical Data and Forecast of Poland Balance Shaft Market Revenues & Volume By Cast Balance Shaft for the Period 2021 - 2031
- Poland Balance Shaft Import Export Trade Statistics
- Market Opportunity Assessment By Engine Type
- Market Opportunity Assessment By Manufacturing Process
- Poland Balance Shaft Top Companies Market Share
- Poland Balance Shaft Competitive Benchmarking By Technical and Operational Parameters
- Poland Balance Shaft Company Profiles
- Poland Balance Shaft Key Strategic Recommendations
Poland Balance Shaft Market (2025-2031): FAQs
The increasing production of automobiles by companies like Volkswagen, Fiat, and Opel in Poland, coupled with the rising demand for fuel-efficient vehicles, is driving the growth of the balance shaft market in the country.
There are significant opportunities for companies like Thyssenkrupp AG, which has a strong presence in Poland, to expand their operations in the balance shaft market. Additionally, with the growing demand for lightweight and fuel-efficient vehicles in the region, there is a need for innovative technologies and solutions that can be capitalized on by new entrants and existing players like Daido Metal Co., Ltd.
The Poland balance shaft market is expected to witness steady growth in the coming years, driven by increasing demand from automotive manufacturers like Fiat Chrysler Automobiles and Opel, who are continuously innovating to enhance engine performance and fuel efficiency. Additionally, advancements in technologies such as the adoption of lightweight materials and the shift towards electric vehicles are likely to shape the market's direction.
The Poland balance shaft market is primarily driven by the increasing demand for fuel-efficient vehicles, with companies like Volkswagen and BMW integrating advanced balance shaft technologies to enhance engine performance. However, challenges such as stringent emission regulations and the growing trend towards electric vehicles are reshaping the market dynamics, pushing companies like Ford and Toyota to innovate and develop alternative solutions to maintain competitiveness.
The Poland balance shaft market is highly competitive with players like Thyssenkrupp AG, Schaeffler Group, and Linamar Corporation dominating the market due to their strong product portfolio, technological advancements, and strategic partnerships with automotive manufacturers in the region. Thyssenkrupp AG, for instance, is known for its innovative balance shaft technologies, while the Schaeffler Group focuses on providing high-quality components for various automotive applications. Linamar Corporation, on the other hand, has a strong presence in the market due to its global reach and diversified product offerings, making it a formidable competitor in the Poland balance shaft market.
6Wresearch actively monitors the Poland Balance Shaft Market and publishes its comprehensive annual report, highlighting emerging trends, growth drivers, revenue analysis, and forecast outlook. Our insights help businesses to make data-backed strategic decisions with ongoing market dynamics. Our analysts track relevent industries related to the Poland Balance Shaft Market, allowing our clients with actionable intelligence and reliable forecasts tailored to emerging regional needs.
Yes, we provide customisation as per your requirements. To learn more, feel free to contact us on sales@6wresearch.com
1 Executive Summary |
2 Introduction |
2.1 Key Highlights of the Report |
2.2 Report Description |
2.3 Market Scope & Segmentation |
2.4 Research Methodology |
2.5 Assumptions |
3 Poland Balance Shaft Market Overview |
3.1 Poland Country Macro Economic Indicators |
3.2 Poland Balance Shaft Market Revenues & Volume, 2021 & 2031F |
3.3 Poland Balance Shaft Market - Industry Life Cycle |
3.4 Poland Balance Shaft Market - Porter's Five Forces |
3.5 Poland Balance Shaft Market Revenues & Volume Share, By Engine Type, 2021 & 2031F |
3.6 Poland Balance Shaft Market Revenues & Volume Share, By Manufacturing Process, 2021 & 2031F |
4 Poland Balance Shaft Market Dynamics |
4.1 Impact Analysis |
4.2 Market Drivers |
4.2.1 Increasing demand for fuel-efficient vehicles driving the growth of the Poland balance shaft market. |
4.2.2 Growing automotive industry in Poland leading to higher adoption of balance shafts in vehicles. |
4.2.3 Stringent emission regulations pushing automakers to use balance shafts for reducing emissions. |
4.3 Market Restraints |
4.3.1 Fluctuating raw material prices impacting the production cost of balance shafts. |
4.3.2 Slowdown in the automotive industry affecting the overall demand for balance shafts in Poland. |
5 Poland Balance Shaft Market Trends |
6 Poland Balance Shaft Market, By Types |
6.1 Poland Balance Shaft Market, By Engine Type |
6.1.1 Overview and Analysis |
6.1.2 Poland Balance Shaft Market Revenues & Volume, By Engine Type, 2021 - 2031F |
6.1.3 Poland Balance Shaft Market Revenues & Volume, By Inline-3 Cylinder, 2021 - 2031F |
6.1.4 Poland Balance Shaft Market Revenues & Volume, By Inline-4 Cylinder, 2021 - 2031F |
6.1.5 Poland Balance Shaft Market Revenues & Volume, By Inline-5 Cylinder, 2021 - 2031F |
6.1.6 Poland Balance Shaft Market Revenues & Volume, By V-6 Cylinder, 2021 - 2031F |
6.2 Poland Balance Shaft Market, By Manufacturing Process |
6.2.1 Overview and Analysis |
6.2.2 Poland Balance Shaft Market Revenues & Volume, By Forged , 2021 - 2031F |
6.2.3 Poland Balance Shaft Market Revenues & Volume, By Cast Balance Shaft, 2021 - 2031F |
7 Poland Balance Shaft Market Import-Export Trade Statistics |
7.1 Poland Balance Shaft Market Export to Major Countries |
7.2 Poland Balance Shaft Market Imports from Major Countries |
8 Poland Balance Shaft Market Key Performance Indicators |
8.1 Average fuel efficiency improvement achieved by vehicles using balance shafts. |
8.2 Adoption rate of balance shafts in different vehicle segments in Poland. |
8.3 Number of new emission regulations compliant with balance shaft usage implemented in the country. |
9 Poland Balance Shaft Market - Opportunity Assessment |
9.1 Poland Balance Shaft Market Opportunity Assessment, By Engine Type, 2021 & 2031F |
9.2 Poland Balance Shaft Market Opportunity Assessment, By Manufacturing Process, 2021 & 2031F |
10 Poland Balance Shaft Market - Competitive Landscape |
10.1 Poland Balance Shaft Market Revenue Share, By Companies, 2024 |
10.2 Poland Balance Shaft Market Competitive Benchmarking, By Operating and Technical Parameters |
11 Company Profiles |
12 Recommendations |
13 Disclaimer |
Global Go To Market Strategy - 2030
Export potential enables firms to identify high-growth global markets with greater confidence by combining advanced trade intelligence with a structured quantitative methodology. The framework analyzes emerging demand trends and country-level import patterns while integrating macroeconomic and trade datasets such as GDP and population forecasts, bilateral import–export flows, tariff structures, elasticity differentials between developed and developing economies, geographic distance, and import demand projections. Using weighted trade values from 2020–2024 as the base period to project country-to-country export potential for 2030, these inputs are operationalized through calculated drivers such as gravity model parameters, tariff impact factors, and projected GDP per-capita growth. Through an analysis of hidden potentials, demand hotspots, and market conditions that are most favorable to success, this method enables firms to focus on target countries, maximize returns, and global expansion with data, backed by accuracy.
By factoring in the projected importer demand gap that is currently unmet and could be potential opportunity, it identifies the potential for the Exporter (Country) among 190 countries, against the general trade analysis, which identifies the biggest importer or exporter.
To discover high-growth global markets and optimize your business strategy:
Click Here
Pricing
- Single User License$ 1,995
- Department License$ 2,400
- Site License$ 3,120
- Global License$ 3,795

Leadership Perspectives from Industry Events
Search
Thought Leadership and Analyst Meet


Our Clients
6WResearch In News
- India Export Attractiveness Tracker 2026
- India Air Conditioner Market Set for Strong Rebound in 2026 After Weather-Led Correction and GST-Driven Recovery: 6Wresearch
- ADAS in India: How Automatic Emergency Braking, Blind Spot Detection & Driver Monitoring are Transforming Road Safety
- Doha a strategic location for EV manufacturing hub: IPA Qatar
- Demand for luxury TVs surging in the GCC, says Samsung
- Empowering Growth: The Thriving Journey of Bangladesh’s Cable Industry
Latest Reports
- Qatar Access and Home Network Market (2026-2032)
- Nicaragua RPG Gaming Market (2026-2032)
- New Zealand RPG Gaming Market (2026-2032)
- Netherlands RPG Gaming Market (2026-2032)
- Nauru RPG Gaming Market (2026-2032)
- Namibia RPG Gaming Market (2026-2032)
- Mozambique RPG Gaming Market (2026-2032)
- Montenegro RPG Gaming Market (2026-2032)
- Mongolia RPG Gaming Market (2026-2032)
- Monaco RPG Gaming Market (2026-2032)
Industry Events and Analyst Meet

EV India Expo 2026

HIMTEX 2026

India Refining Summit 2026

India EV Show 2026

EV tech India Expo 2026
Whitepaper
- Middle East & Africa Commercial Security Market Click here to view more.
- Middle East & Africa Fire Safety Systems & Equipment Market Click here to view more.
- GCC Drone Market Click here to view more.
- Middle East Lighting Fixture Market Click here to view more.
- GCC Physical & Perimeter Security Market Click here to view more.