Poland Control Valve Market (2026-2032) Outlook | Share, Growth, Value, Companies, Industry, Size, Revenue, Trends, Forecast & Analysis
Market Forecast By Component (Actuators, Valve Body), By Type (Rotary , Linear), By Industry (Oil & Gas, Water & Wastewater Treatment, Energy & Power, Chemicals) And Competitive Landscape
| Product Code: ETC4584496 | Publication Date: Jul 2023 | Updated Date: Mar 2026 | Product Type: Report | |
| Publisher: 6Wresearch | Author: Summon Dutta | No. of Pages: 85 | No. of Figures: 45 | No. of Tables: 25 |
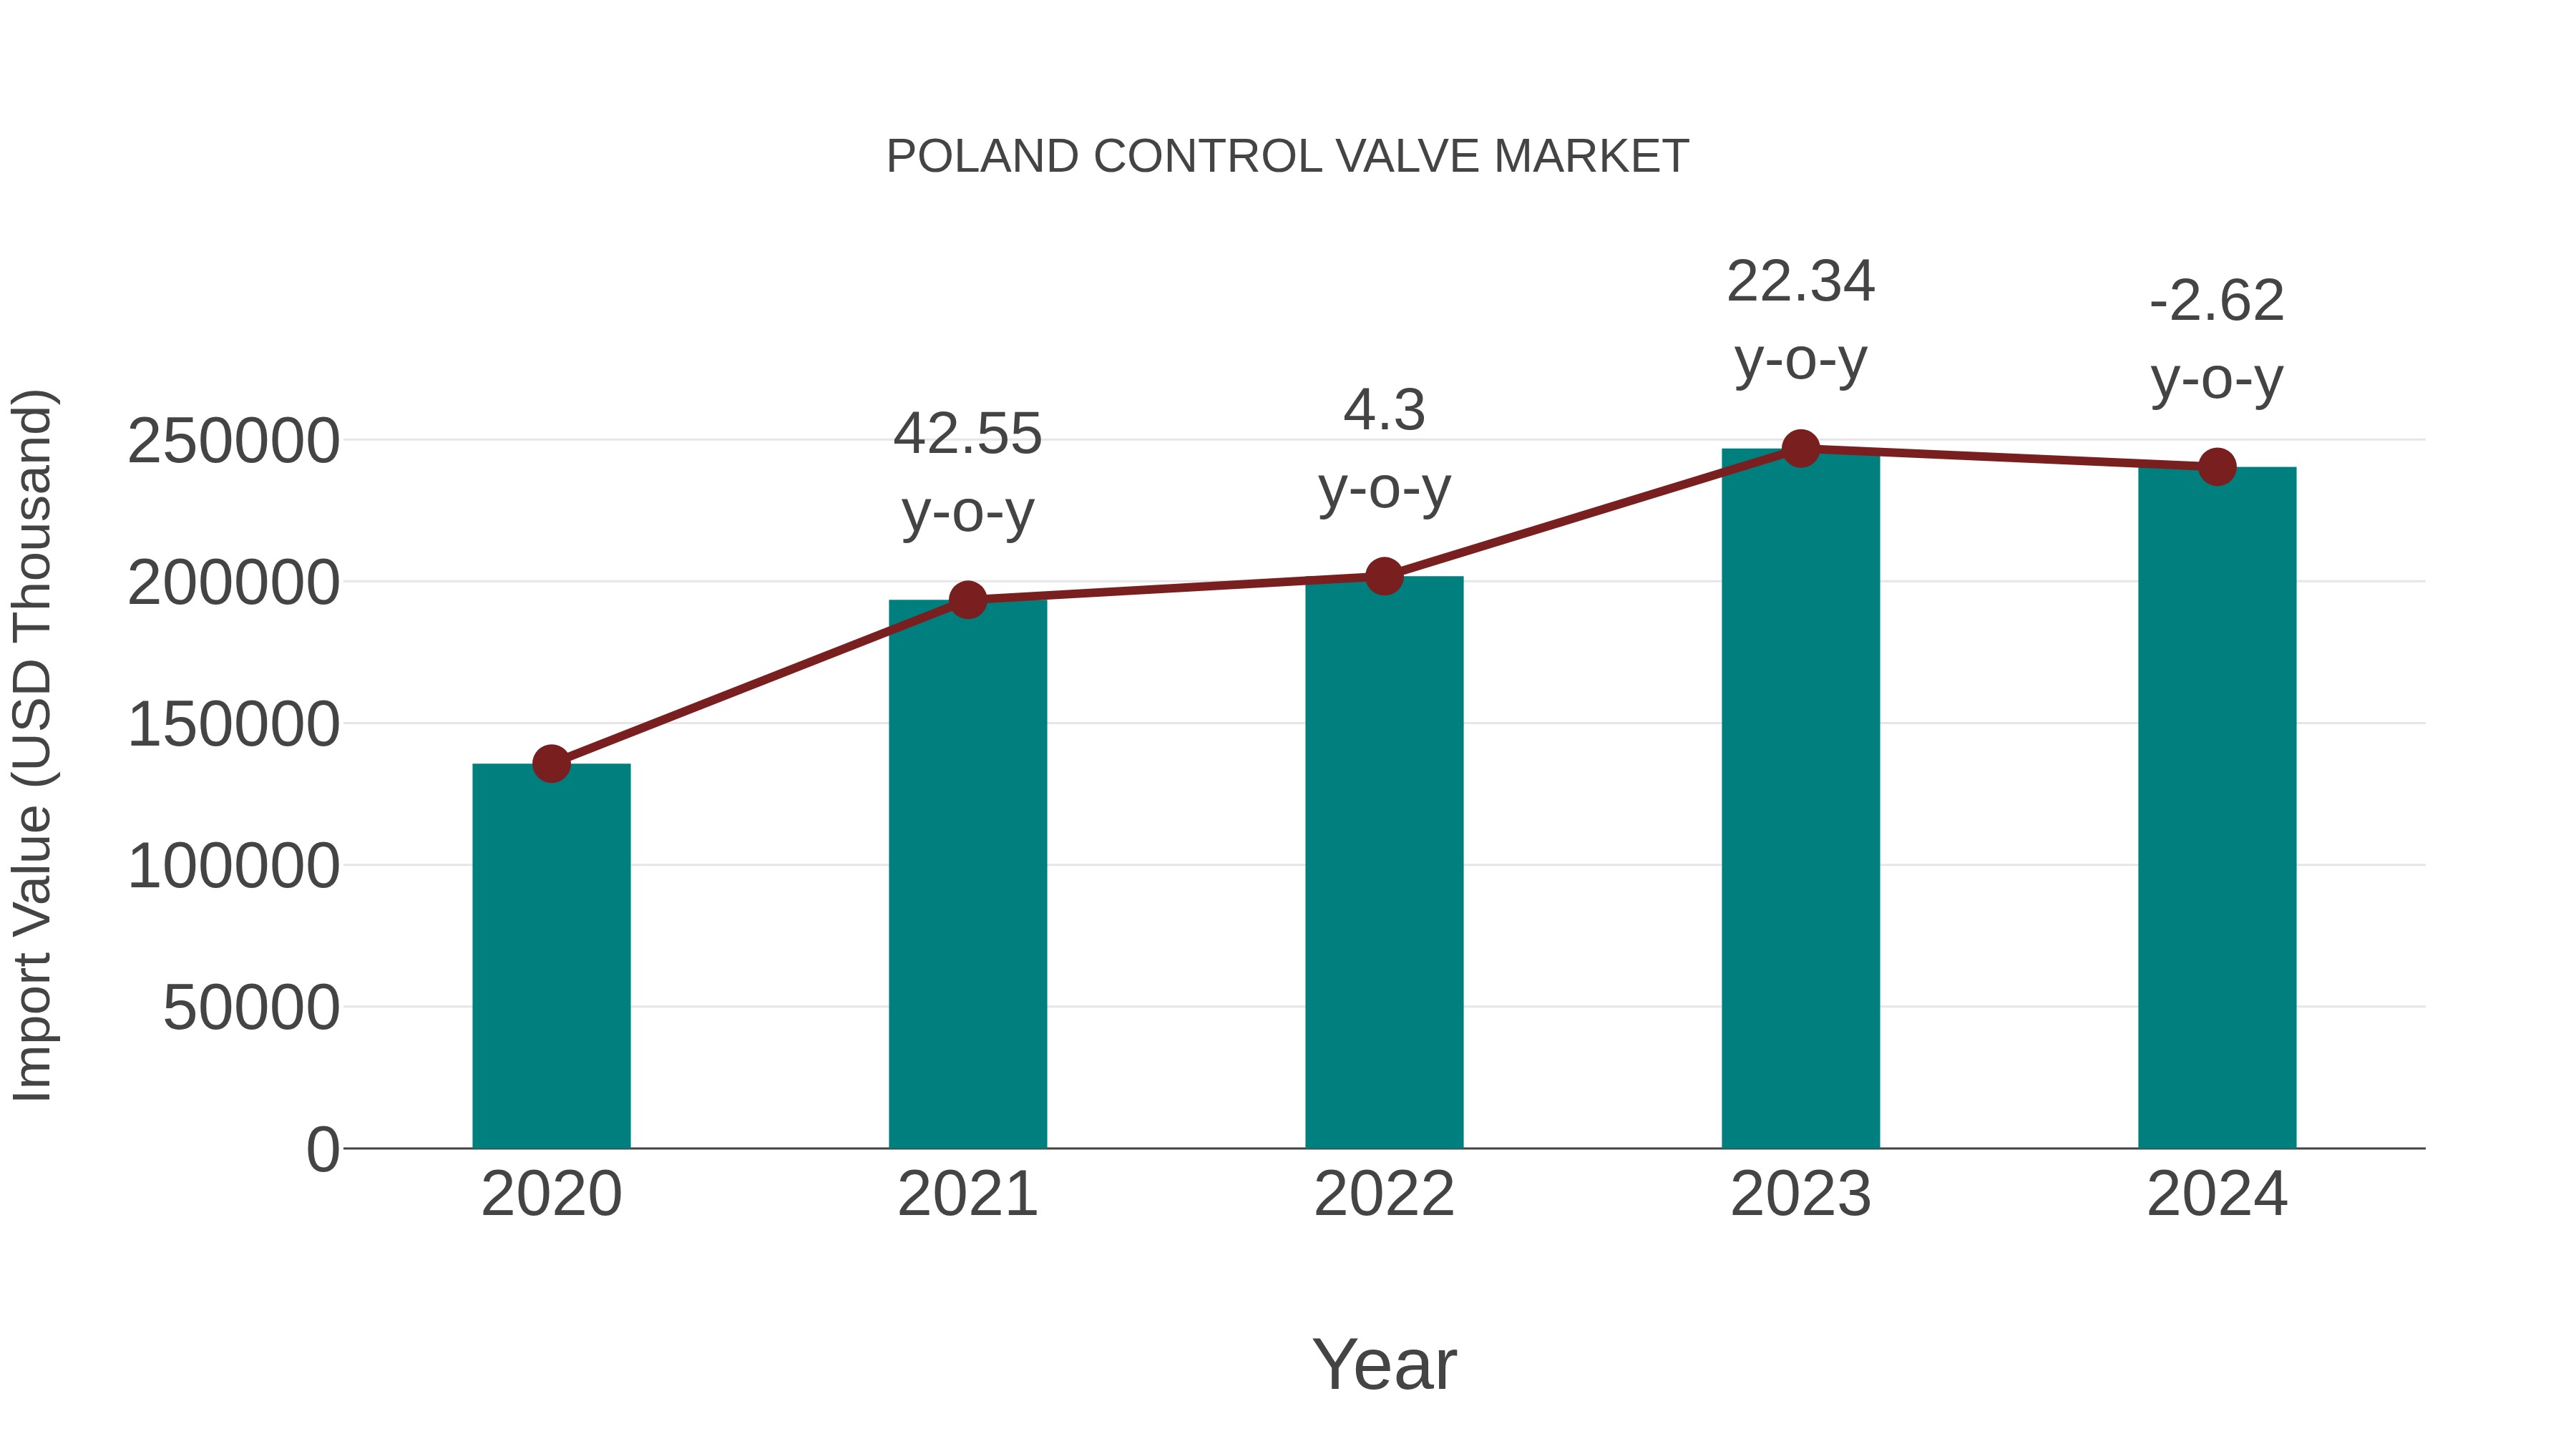
Poland Control Valve Market: Import Trend Analysis
In 2024, Poland import trend for the control valve market experienced a decline, with a growth rate of -2.62% compared to the previous year. However, the compound annual growth rate (CAGR) from 2020 to 2024 stood at a robust 15.36%. This dip in import momentum could be attributed to shifts in demand dynamics or changes in market stability.
Poland Control Valve Market Overview
The Poland Control Valve Market is benefiting from growing demand in industries such as oil and gas, water treatment, and power generation. Control valves play a crucial role in regulating fluid flow and pressure in industrial processes. As Poland continues to invest in infrastructure and industrial development, the demand for control valves is expected to rise.
Drivers of the market
The Poland Control Valve market is driven by the need for precise control and regulation of fluid flow in various industrial processes. Control valves are essential components in industries such as oil and gas, chemicals, and water treatment, where they manage the flow, pressure, and temperature of fluids. The rise in industrial automation, the growing demand for efficient and reliable process control, and the increasing focus on operational efficiency support market growth. Additionally, advancements in valve technologies and the need for regulatory compliance contribute to market expansion.
Challenges of the market
The control valve market in Poland faces challenges due to high manufacturing and maintenance costs, particularly for advanced control valve solutions. Fluctuations in raw material prices impact the overall cost structure of the market. Additionally, the need for continuous technological innovation to meet evolving industry standards adds to the operational complexities.
Government Policy of the market
For the Poland Control Valve Market, industrial policies promote the use of energy-efficient control systems in industrial applications. Poland encourages the adoption of advanced control valve technologies that optimize industrial processes, reduce energy consumption, and enhance operational efficiency.
Key Highlights of the Report:
- Poland Control Valve Market Outlook
- Market Size of Poland Control Valve Market, 2025
- Forecast of Poland Control Valve Market, 2032
- Historical Data and Forecast of Poland Control Valve Revenues & Volume for the Period 2022-2032F
- Poland Control Valve Market Trend Evolution
- Poland Control Valve Market Drivers and Challenges
- Poland Control Valve Price Trends
- Poland Control Valve Porter's Five Forces
- Poland Control Valve Industry Life Cycle
- Historical Data and Forecast of Poland Control Valve Market Revenues & Volume By Component for the Period 2022-2032F
- Historical Data and Forecast of Poland Control Valve Market Revenues & Volume By Actuators for the Period 2022-2032F
- Historical Data and Forecast of Poland Control Valve Market Revenues & Volume By Valve Body for the Period 2022-2032F
- Historical Data and Forecast of Poland Control Valve Market Revenues & Volume By Type for the Period 2022-2032F
- Historical Data and Forecast of Poland Control Valve Market Revenues & Volume By Rotary for the Period 2022-2032F
- Historical Data and Forecast of Poland Control Valve Market Revenues & Volume By Linear for the Period 2022-2032F
- Historical Data and Forecast of Poland Control Valve Market Revenues & Volume By Industry for the Period 2022-2032F
- Historical Data and Forecast of Poland Control Valve Market Revenues & Volume By Oil & Gas for the Period 2022-2032F
- Historical Data and Forecast of Poland Control Valve Market Revenues & Volume By Water & Wastewater Treatment for the Period 2022-2032F
- Historical Data and Forecast of Poland Control Valve Market Revenues & Volume By Energy & Power for the Period 2022-2032F
- Historical Data and Forecast of Poland Control Valve Market Revenues & Volume By Chemicals for the Period 2022-2032F
- Poland Control Valve Import Export Trade Statistics
- Market Opportunity Assessment By Component
- Market Opportunity Assessment By Type
- Market Opportunity Assessment By Industry
- Poland Control Valve Top Companies Market Share
- Poland Control Valve Competitive Benchmarking By Technical and Operational Parameters
- Poland Control Valve Company Profiles
- Poland Control Valve Key Strategic Recommendations
Poland Control Valve Market (2026-2032): FAQs
The Poland control valve market offers significant opportunities for companies like Emerson, Honeywell, and Siemens to expand their presence by introducing innovative technologies and solutions tailored to the evolving needs of industries such as oil & gas, water treatment, and chemical processing.
The increasing demand for advanced control valves in industries such as oil & gas, water & wastewater, and power generation, coupled with the adoption of smart valve technologies by companies like Emerson Electric Co. and Flowserve Corporation, is driving the growth of the control valve market in Poland.
In the Poland control valve market, customers are increasingly valuing smart control valves that offer remote monitoring and automation capabilities. Companies like ABB and Siemens are gaining popularity for their advanced control valve solutions that provide real-time data and predictive maintenance features, aligning with the trend towards Industry 4.0 integration in manufacturing processes.
The major players in the Poland control valve market include companies like Samson AG, Burkert Fluid Control Systems, and AVK Holding. Samson AG focuses on providing high-quality control valves for a wide range of industries, while Burkert Fluid Control Systems specializes in offering customized solutions for specific applications. AVK Holding differentiates itself through its strong emphasis on innovation and sustainability in its control valve offerings.
The Poland control valve market encompasses a wide range of players such as global companies like Emerson Electric Co., Flowserve Corporation, and IMI plc, as well as local manufacturers like Armatura Krakow SA. The market includes various types of control valves such as globe valves, butterfly valves, ball valves, and others, catering to industries such as oil and gas, water and wastewater, power generation, and chemical processing. The market is characterized by ongoing technological advancements, increasing automation in industrial processes, and a growing focus on energy efficiency and environmental sustainability.
6Wresearch actively monitors the Poland Control Valve Market and publishes its comprehensive annual report, highlighting emerging trends, growth drivers, revenue analysis, and forecast outlook. Our insights help businesses to make data-backed strategic decisions with ongoing market dynamics. Our analysts track relevent industries related to the Poland Control Valve Market, allowing our clients with actionable intelligence and reliable forecasts tailored to emerging regional needs.
Yes, we provide customisation as per your requirements. To learn more, feel free to contact us on sales@6wresearch.com
1 Executive Summary |
2 Introduction |
2.1 Key Highlights of the Report |
2.2 Report Description |
2.3 Market Scope & Segmentation |
2.4 Research Methodology |
2.5 Assumptions |
3 Poland Control Valve Market Overview |
3.1 Poland Country Macro Economic Indicators |
3.2 Poland Control Valve Market Revenues & Volume, 2022 & 2032F |
3.3 Poland Control Valve Market - Industry Life Cycle |
3.4 Poland Control Valve Market - Porter's Five Forces |
3.5 Poland Control Valve Market Revenues & Volume Share, By Component, 2022 & 2032F |
3.6 Poland Control Valve Market Revenues & Volume Share, By Type, 2022 & 2032F |
3.7 Poland Control Valve Market Revenues & Volume Share, By Industry, 2022 & 2032F |
4 Poland Control Valve Market Dynamics |
4.1 Impact Analysis |
4.2 Market Drivers |
4.2.1 Increasing industrial automation in Poland leading to higher demand for control valves |
4.2.2 Growing focus on energy efficiency and sustainability driving adoption of advanced control valve technologies |
4.2.3 Expansion of industries such as oil gas, water & wastewater, and chemicals in Poland driving the demand for control valves |
4.3 Market Restraints |
4.3.1 High initial investment required for installing control valve systems may act as a barrier for small and medium enterprises |
4.3.2 Lack of skilled workforce for operating and maintaining control valve systems may hinder market growth |
4.3.3 Competition from alternative technologies such as variable frequency drives and smart actuators can pose a challenge to the control valve market |
5 Poland Control Valve Market Trends |
6 Poland Control Valve Market, By Types |
6.1 Poland Control Valve Market, By Component |
6.1.1 Overview and Analysis |
6.1.2 Poland Control Valve Market Revenues & Volume, By Component, 2022-2032F |
6.1.3 Poland Control Valve Market Revenues & Volume, By Actuators, 2022-2032F |
6.1.4 Poland Control Valve Market Revenues & Volume, By Valve Body, 2022-2032F |
6.2 Poland Control Valve Market, By Type |
6.2.1 Overview and Analysis |
6.2.2 Poland Control Valve Market Revenues & Volume, By Rotary , 2022-2032F |
6.2.3 Poland Control Valve Market Revenues & Volume, By Linear, 2022-2032F |
6.3 Poland Control Valve Market, By Industry |
6.3.1 Overview and Analysis |
6.3.2 Poland Control Valve Market Revenues & Volume, By Oil & Gas, 2022-2032F |
6.3.3 Poland Control Valve Market Revenues & Volume, By Water & Wastewater Treatment, 2022-2032F |
6.3.4 Poland Control Valve Market Revenues & Volume, By Energy & Power, 2022-2032F |
6.3.5 Poland Control Valve Market Revenues & Volume, By Chemicals, 2022-2032F |
7 Poland Control Valve Market Import-Export Trade Statistics |
7.1 Poland Control Valve Market Export to Major Countries |
7.2 Poland Control Valve Market Imports from Major Countries |
8 Poland Control Valve Market Key Performance Indicators |
8.1 Energy savings achieved through the use of control valves in industrial processes |
8.2 Number of new industrial automation projects in Poland utilizing control valves |
8.3 Adoption rate of advanced control valve technologies in key industries in Poland |
9 Poland Control Valve Market - Opportunity Assessment |
9.1 Poland Control Valve Market Opportunity Assessment, By Component, 2022 & 2032F |
9.2 Poland Control Valve Market Opportunity Assessment, By Type, 2022 & 2032F |
9.3 Poland Control Valve Market Opportunity Assessment, By Industry, 2022 & 2032F |
10 Poland Control Valve Market - Competitive Landscape |
10.1 Poland Control Valve Market Revenue Share, By Companies, 2025 |
10.2 Poland Control Valve Market Competitive Benchmarking, By Operating and Technical Parameters |
11 Company Profiles |
12 Recommendations |
13 Disclaimer |
Global Go To Market Strategy - 2030
Export potential enables firms to identify high-growth global markets with greater confidence by combining advanced trade intelligence with a structured quantitative methodology. The framework analyzes emerging demand trends and country-level import patterns while integrating macroeconomic and trade datasets such as GDP and population forecasts, bilateral import–export flows, tariff structures, elasticity differentials between developed and developing economies, geographic distance, and import demand projections. Using weighted trade values from 2020–2024 as the base period to project country-to-country export potential for 2030, these inputs are operationalized through calculated drivers such as gravity model parameters, tariff impact factors, and projected GDP per-capita growth. Through an analysis of hidden potentials, demand hotspots, and market conditions that are most favorable to success, this method enables firms to focus on target countries, maximize returns, and global expansion with data, backed by accuracy.
By factoring in the projected importer demand gap that is currently unmet and could be potential opportunity, it identifies the potential for the Exporter (Country) among 190 countries, against the general trade analysis, which identifies the biggest importer or exporter.
To discover high-growth global markets and optimize your business strategy:
Click Here
Pricing
- Single User License$ 1,995
- Department License$ 2,400
- Site License$ 3,120
- Global License$ 3,795

Leadership Perspectives from Industry Events
Search
Thought Leadership and Analyst Meet


Our Clients
6WResearch In News
- Doha a strategic location for EV manufacturing hub: IPA Qatar
- Demand for luxury TVs surging in the GCC, says Samsung
- Empowering Growth: The Thriving Journey of Bangladesh’s Cable Industry
- Demand for luxury TVs surging in the GCC, says Samsung
- Video call with a traditional healer? Once unthinkable, it’s now common in South Africa
- Intelligent Buildings To Smooth GCC’s Path To Net Zero
Latest Reports
- Cape Verde Portable Hand-Thrown Extinguisher Market (2026-2032)
- Canada Portable Hand-Thrown Extinguisher Market (2026-2032)
- Cameroon Portable Hand-Thrown Extinguisher Market (2026-2032)
- Burundi Portable Hand-Thrown Extinguisher Market (2026-2032)
- Burkina Faso Portable Hand-Thrown Extinguisher Market (2026-2032)
- Bulgaria Portable Hand-Thrown Extinguisher Market (2026-2032)
- Brunei Portable Hand-Thrown Extinguisher Market (2026-2032)
- Botswana Portable Hand-Thrown Extinguisher Market (2026-2032)
- Bosnia and Herzegovina Portable Hand-Thrown Extinguisher Market (2026-2032)
- Bolivia Portable Hand-Thrown Extinguisher Market (2026-2032)
Industry Events and Analyst Meet

HIMTEX 2026

India Refining Summit 2026

India EV Show 2026

EV tech India Expo 2026

Auto Tech Asia 2026
Whitepaper
- Middle East & Africa Commercial Security Market Click here to view more.
- Middle East & Africa Fire Safety Systems & Equipment Market Click here to view more.
- GCC Drone Market Click here to view more.
- Middle East Lighting Fixture Market Click here to view more.
- GCC Physical & Perimeter Security Market Click here to view more.