Poland Cryogenic Valve Market (2026-2032) Outlook | Trends, Growth, Forecast, Revenue, Value, Analysis, Size, Industry, Companies & Share
Market Forecast By Gas (LNG, Oxygen, Nitrogen), By Type (Globe, Gate, Ball), By End-User (Energy & Power, Food, Chemicals) And Competitive Landscape
| Product Code: ETC4529116 | Publication Date: Jul 2023 | Updated Date: Mar 2026 | Product Type: Report | |
| Publisher: 6Wresearch | Author: Dhaval Chaurasia | No. of Pages: 85 | No. of Figures: 45 | No. of Tables: 25 |
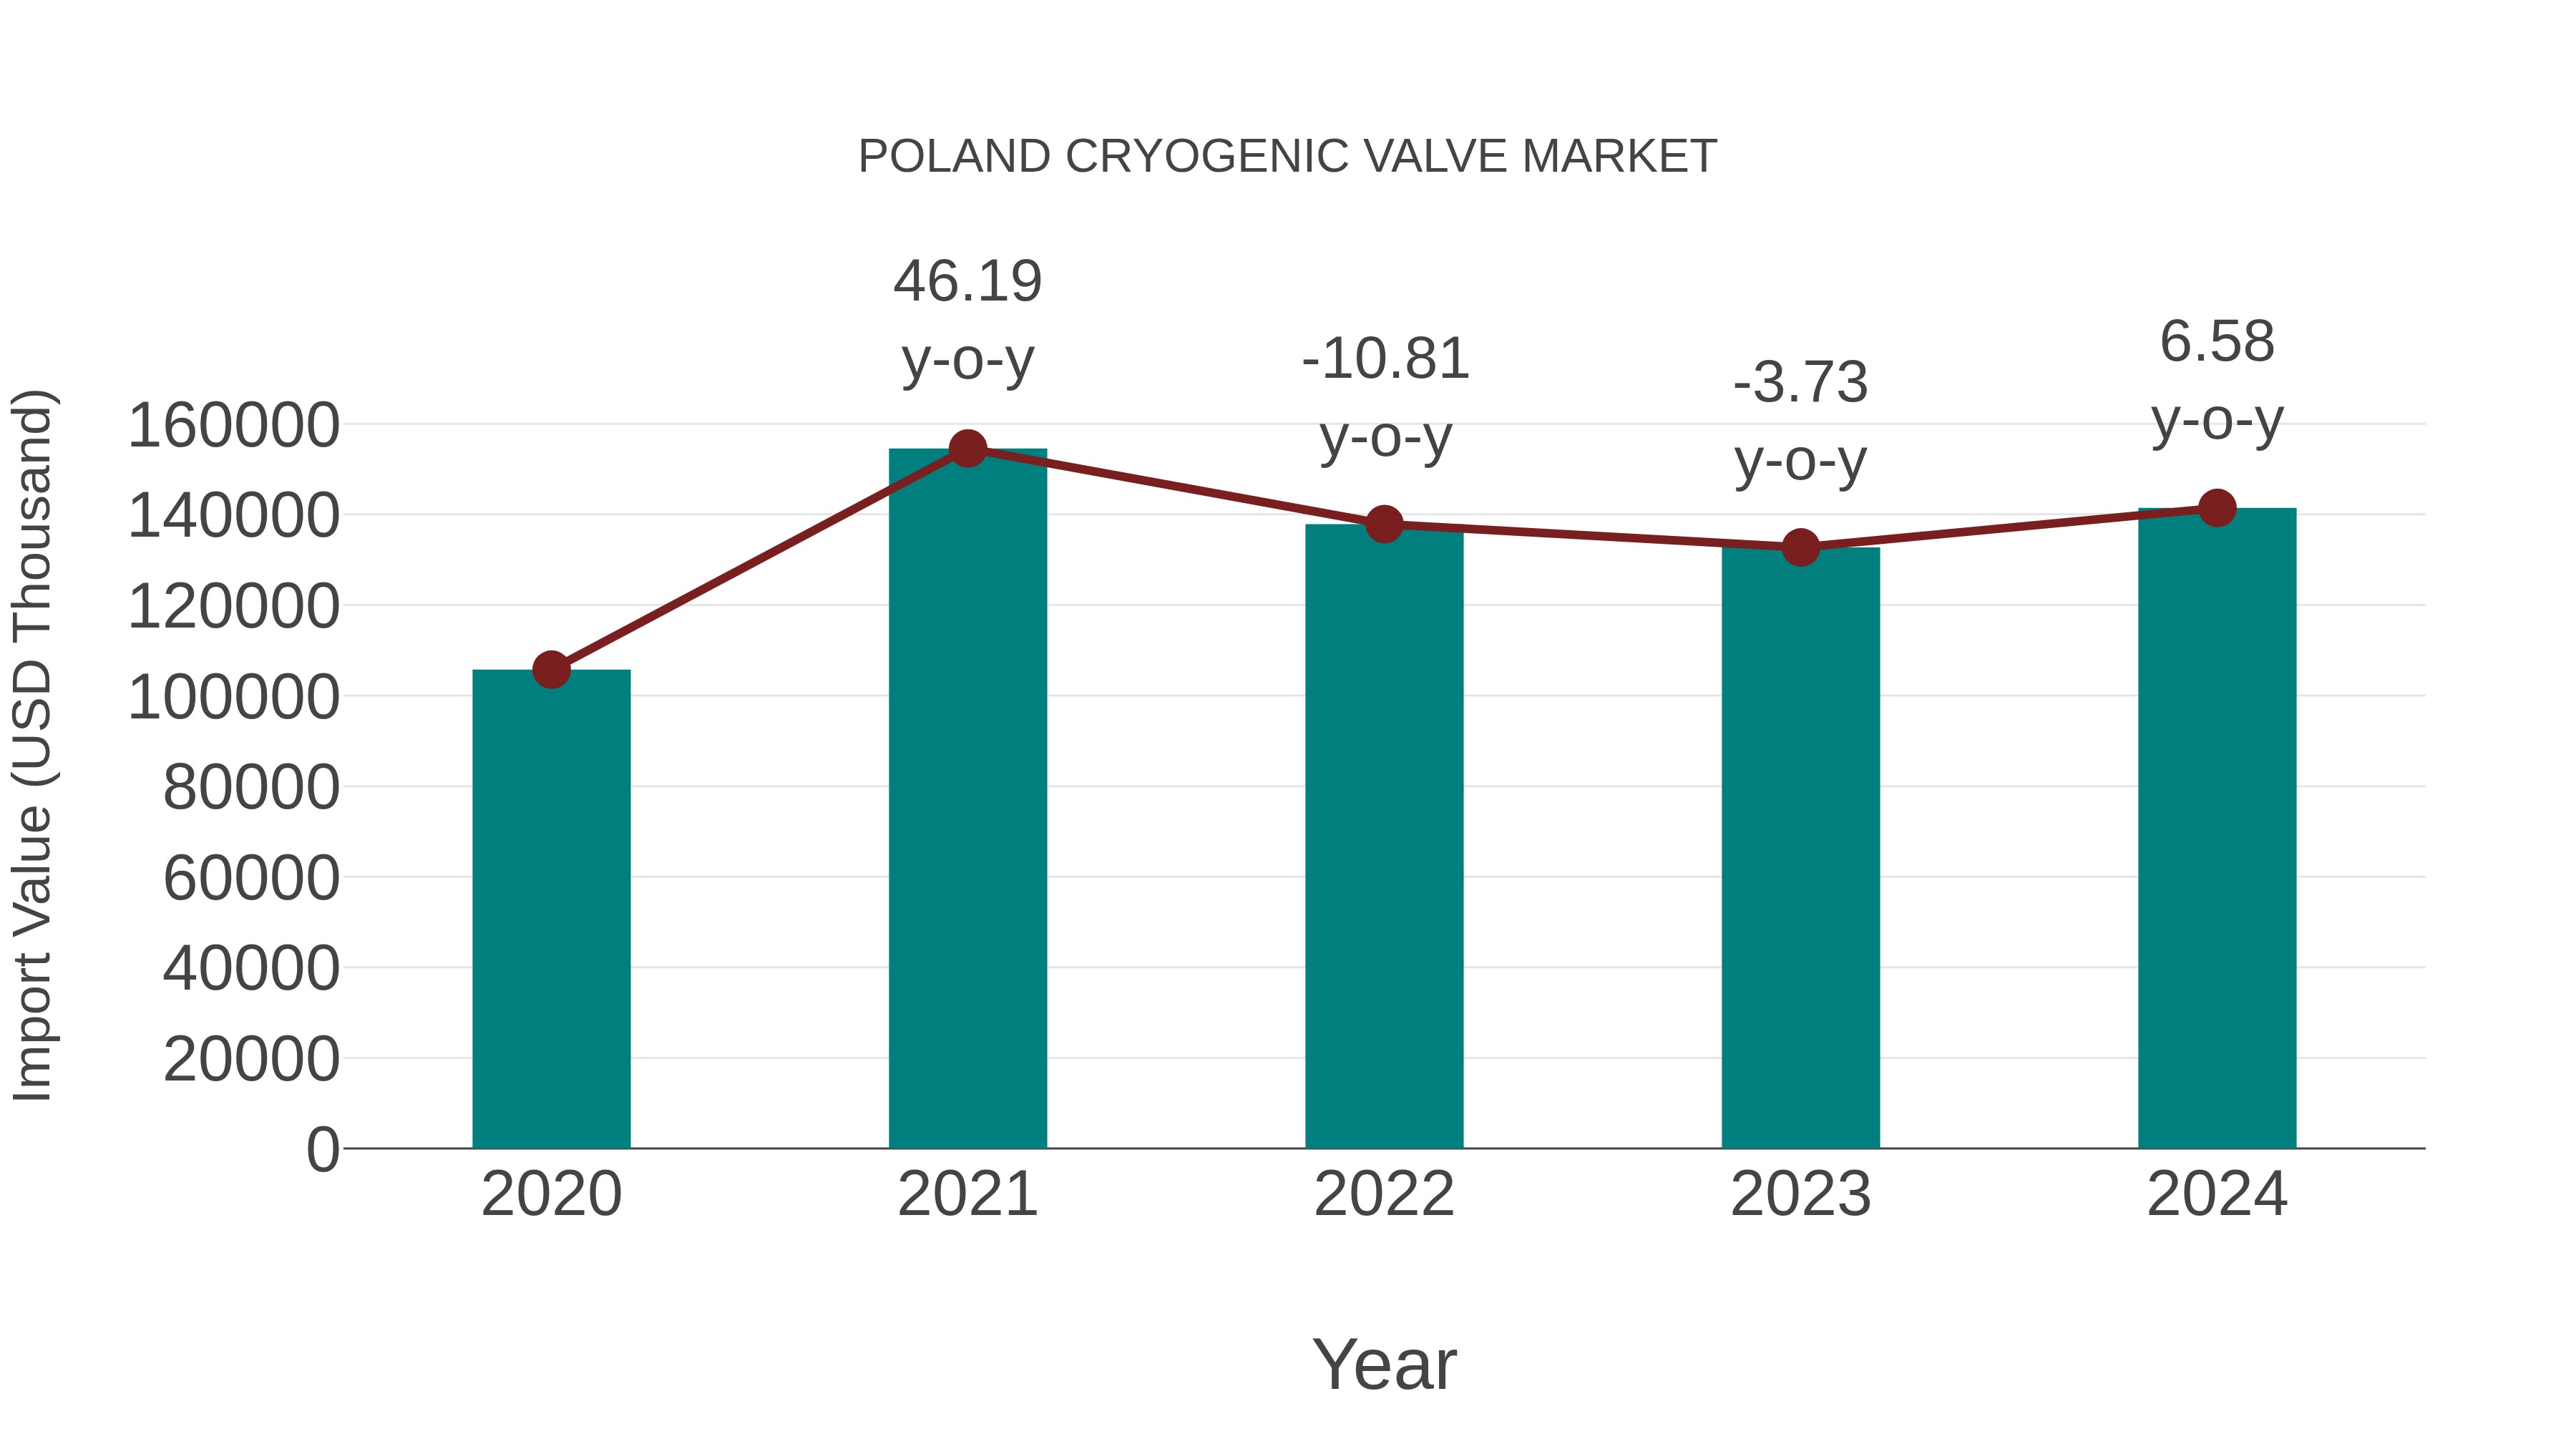
Poland Cryogenic Valve Market: Import Trend Analysis
In the Poland cryogenic valve market, import trends showed a growth rate of 6.58% from 2023 to 2024, with a compound annual growth rate (CAGR) of 7.55% from 2020 to 2024. This import momentum reflects sustained demand for cryogenic valves, likely driven by increasing industrial activities and infrastructure development in Poland during the period.
Poland Cryogenic Valve Market Overview
The cryogenic valve market in Poland is expanding due to the growing use of cryogenic technology in the oil and gas, energy, and healthcare sectors. Cryogenic valves are designed to handle extremely low temperatures and are essential for controlling the flow of liquefied gases. The market is driven by the increasing demand for LNG, the growth of the cold chain logistics sector, and the need for reliable flow control solutions in cryogenic applications.
Drivers of the market
The cryogenic valve market in Poland is influenced by the growing need for reliable and efficient valve solutions in cryogenic applications. Cryogenic valves are used to control the flow of cryogenic liquids and gases in various industries, including energy, healthcare, and aerospace. The expansion of the LNG and medical industries, along with advancements in valve technologies, supports market growth. Additionally, the increasing focus on safety and efficiency in cryogenic systems contributes to the growth of the cryogenic valve market.
Challenges of the market
The cryogenic valve market in Poland is challenged by the high costs associated with the production of valves capable of operating at extremely low temperatures. Ensuring reliability and safety in these critical components requires advanced engineering and materials, which increases production costs. The market also faces regulatory challenges, with stringent standards for safety and performance that must be met. Additionally, competition from international suppliers can impact local market share and pricing.
Government Policy of the market
The cryogenic valve market in Poland is governed by policies that ensure the safety and reliability of valves used in cryogenic applications. The government supports the development and adoption of advanced valve technologies that meet stringent safety and performance standards for handling cryogenic fluids.
Key Highlights of the Report:
- Poland Cryogenic Valve Market Outlook
- Market Size of Poland Cryogenic Valve Market, 2025
- Forecast of Poland Cryogenic Valve Market, 2032
- Historical Data and Forecast of Poland Cryogenic Valve Revenues & Volume for the Period 2022-2032F
- Poland Cryogenic Valve Market Trend Evolution
- Poland Cryogenic Valve Market Drivers and Challenges
- Poland Cryogenic Valve Price Trends
- Poland Cryogenic Valve Porter's Five Forces
- Poland Cryogenic Valve Industry Life Cycle
- Historical Data and Forecast of Poland Cryogenic Valve Market Revenues & Volume By Gas for the Period 2022-2032F
- Historical Data and Forecast of Poland Cryogenic Valve Market Revenues & Volume By LNG for the Period 2022-2032F
- Historical Data and Forecast of Poland Cryogenic Valve Market Revenues & Volume By Oxygen for the Period 2022-2032F
- Historical Data and Forecast of Poland Cryogenic Valve Market Revenues & Volume By Nitrogen for the Period 2022-2032F
- Historical Data and Forecast of Poland Cryogenic Valve Market Revenues & Volume By Type for the Period 2022-2032F
- Historical Data and Forecast of Poland Cryogenic Valve Market Revenues & Volume By Globe for the Period 2022-2032F
- Historical Data and Forecast of Poland Cryogenic Valve Market Revenues & Volume By Gate for the Period 2022-2032F
- Historical Data and Forecast of Poland Cryogenic Valve Market Revenues & Volume By Ball for the Period 2022-2032F
- Historical Data and Forecast of Poland Cryogenic Valve Market Revenues & Volume By End-User for the Period 2022-2032F
- Historical Data and Forecast of Poland Cryogenic Valve Market Revenues & Volume By Energy & Power for the Period 2022-2032F
- Historical Data and Forecast of Poland Cryogenic Valve Market Revenues & Volume By Food for the Period 2022-2032F
- Historical Data and Forecast of Poland Cryogenic Valve Market Revenues & Volume By Chemicals for the Period 2022-2032F
- Poland Cryogenic Valve Import Export Trade Statistics
- Market Opportunity Assessment By Gas
- Market Opportunity Assessment By Type
- Market Opportunity Assessment By End-User
- Poland Cryogenic Valve Top Companies Market Share
- Poland Cryogenic Valve Competitive Benchmarking By Technical and Operational Parameters
- Poland Cryogenic Valve Company Profiles
- Poland Cryogenic Valve Key Strategic Recommendations
Poland Cryogenic Valve Market (2026-2032): FAQs
6Wresearch actively monitors the Poland Cryogenic Valve Market and publishes its comprehensive annual report, highlighting emerging trends, growth drivers, revenue analysis, and forecast outlook. Our insights help businesses to make data-backed strategic decisions with ongoing market dynamics. Our analysts track relevent industries related to the Poland Cryogenic Valve Market, allowing our clients with actionable intelligence and reliable forecasts tailored to emerging regional needs.
Yes, we provide customisation as per your requirements. To learn more, feel free to contact us on sales@6wresearch.com
1 Executive Summary |
2 Introduction |
2.1 Key Highlights of the Report |
2.2 Report Description |
2.3 Market Scope & Segmentation |
2.4 Research Methodology |
2.5 Assumptions |
3 Poland Cryogenic Valve Market Overview |
3.1 Poland Country Macro Economic Indicators |
3.2 Poland Cryogenic Valve Market Revenues & Volume, 2022 & 2032F |
3.3 Poland Cryogenic Valve Market - Industry Life Cycle |
3.4 Poland Cryogenic Valve Market - Porter's Five Forces |
3.5 Poland Cryogenic Valve Market Revenues & Volume Share, By Gas, 2022 & 2032F |
3.6 Poland Cryogenic Valve Market Revenues & Volume Share, By Type, 2022 & 2032F |
3.7 Poland Cryogenic Valve Market Revenues & Volume Share, By End-User, 2022 & 2032F |
4 Poland Cryogenic Valve Market Dynamics |
4.1 Impact Analysis |
4.2 Market Drivers |
4.2.1 Increasing demand for liquefied natural gas (LNG) in Poland |
4.2.2 Growth in the pharmaceutical and healthcare industries requiring cryogenic applications |
4.2.3 Rising adoption of cryogenic valves in the food and beverage sector for processing and preservation |
4.3 Market Restraints |
4.3.1 High initial investment and maintenance costs associated with cryogenic valves |
4.3.2 Stringent regulatory requirements and standards for handling cryogenic materials |
4.3.3 Limited awareness and understanding of cryogenic valve technology among end-users |
5 Poland Cryogenic Valve Market Trends |
6 Poland Cryogenic Valve Market, By Types |
6.1 Poland Cryogenic Valve Market, By Gas |
6.1.1 Overview and Analysis |
6.1.2 Poland Cryogenic Valve Market Revenues & Volume, By Gas, 2022-2032F |
6.1.3 Poland Cryogenic Valve Market Revenues & Volume, By LNG, 2022-2032F |
6.1.4 Poland Cryogenic Valve Market Revenues & Volume, By Oxygen, 2022-2032F |
6.1.5 Poland Cryogenic Valve Market Revenues & Volume, By Nitrogen, 2022-2032F |
6.2 Poland Cryogenic Valve Market, By Type |
6.2.1 Overview and Analysis |
6.2.2 Poland Cryogenic Valve Market Revenues & Volume, By Globe, 2022-2032F |
6.2.3 Poland Cryogenic Valve Market Revenues & Volume, By Gate, 2022-2032F |
6.2.4 Poland Cryogenic Valve Market Revenues & Volume, By Ball, 2022-2032F |
6.3 Poland Cryogenic Valve Market, By End-User |
6.3.1 Overview and Analysis |
6.3.2 Poland Cryogenic Valve Market Revenues & Volume, By Energy & Power, 2022-2032F |
6.3.3 Poland Cryogenic Valve Market Revenues & Volume, By Food, 2022-2032F |
6.3.4 Poland Cryogenic Valve Market Revenues & Volume, By Chemicals, 2022-2032F |
7 Poland Cryogenic Valve Market Import-Export Trade Statistics |
7.1 Poland Cryogenic Valve Market Export to Major Countries |
7.2 Poland Cryogenic Valve Market Imports from Major Countries |
8 Poland Cryogenic Valve Market Key Performance Indicators |
8.1 Rate of adoption of cryogenic technologies in key industries |
8.2 Number of research and development initiatives focused on improving cryogenic valve efficiency and safety |
8.3 Percentage increase in the use of cryogenic valves in emerging applications such as space exploration or renewable energy sectors |
9 Poland Cryogenic Valve Market - Opportunity Assessment |
9.1 Poland Cryogenic Valve Market Opportunity Assessment, By Gas, 2022 & 2032F |
9.2 Poland Cryogenic Valve Market Opportunity Assessment, By Type, 2022 & 2032F |
9.3 Poland Cryogenic Valve Market Opportunity Assessment, By End-User, 2022 & 2032F |
10 Poland Cryogenic Valve Market - Competitive Landscape |
10.1 Poland Cryogenic Valve Market Revenue Share, By Companies, 2025 |
10.2 Poland Cryogenic Valve Market Competitive Benchmarking, By Operating and Technical Parameters |
11 Company Profiles |
12 Recommendations |
13 Disclaimer |
Global Go To Market Strategy - 2030
Export potential enables firms to identify high-growth global markets with greater confidence by combining advanced trade intelligence with a structured quantitative methodology. The framework analyzes emerging demand trends and country-level import patterns while integrating macroeconomic and trade datasets such as GDP and population forecasts, bilateral import–export flows, tariff structures, elasticity differentials between developed and developing economies, geographic distance, and import demand projections. Using weighted trade values from 2020–2024 as the base period to project country-to-country export potential for 2030, these inputs are operationalized through calculated drivers such as gravity model parameters, tariff impact factors, and projected GDP per-capita growth. Through an analysis of hidden potentials, demand hotspots, and market conditions that are most favorable to success, this method enables firms to focus on target countries, maximize returns, and global expansion with data, backed by accuracy.
By factoring in the projected importer demand gap that is currently unmet and could be potential opportunity, it identifies the potential for the Exporter (Country) among 190 countries, against the general trade analysis, which identifies the biggest importer or exporter.
To discover high-growth global markets and optimize your business strategy:
Click Here
Pricing
- Single User License$ 1,995
- Department License$ 2,400
- Site License$ 3,120
- Global License$ 3,795

Leadership Perspectives from Industry Events
Search
Thought Leadership and Analyst Meet


Our Clients
6WResearch In News
- Doha a strategic location for EV manufacturing hub: IPA Qatar
- Demand for luxury TVs surging in the GCC, says Samsung
- Empowering Growth: The Thriving Journey of Bangladesh’s Cable Industry
- Demand for luxury TVs surging in the GCC, says Samsung
- Video call with a traditional healer? Once unthinkable, it’s now common in South Africa
- Intelligent Buildings To Smooth GCC’s Path To Net Zero
Latest Reports
- Cape Verde Portable Hand-Thrown Extinguisher Market (2026-2032)
- Canada Portable Hand-Thrown Extinguisher Market (2026-2032)
- Cameroon Portable Hand-Thrown Extinguisher Market (2026-2032)
- Burundi Portable Hand-Thrown Extinguisher Market (2026-2032)
- Burkina Faso Portable Hand-Thrown Extinguisher Market (2026-2032)
- Bulgaria Portable Hand-Thrown Extinguisher Market (2026-2032)
- Brunei Portable Hand-Thrown Extinguisher Market (2026-2032)
- Botswana Portable Hand-Thrown Extinguisher Market (2026-2032)
- Bosnia and Herzegovina Portable Hand-Thrown Extinguisher Market (2026-2032)
- Bolivia Portable Hand-Thrown Extinguisher Market (2026-2032)
Industry Events and Analyst Meet

HIMTEX 2026

India Refining Summit 2026

India EV Show 2026

EV tech India Expo 2026

Auto Tech Asia 2026
Whitepaper
- Middle East & Africa Commercial Security Market Click here to view more.
- Middle East & Africa Fire Safety Systems & Equipment Market Click here to view more.
- GCC Drone Market Click here to view more.
- Middle East Lighting Fixture Market Click here to view more.
- GCC Physical & Perimeter Security Market Click here to view more.