Poland Resins Market (2026-2032) | Industry, Trends, COVID-19 IMPACT, Analysis, Companies, Revenue, Forecast, Growth, Outlook, Value, Size & Share
Market Forecast By Types (Unsaturated Polyester Resins, Alkyd Resins, Emulsion Polymers, Amino Resins, Polyester Resin, Polyurethane Resins, Polyamide Epichlorohydrin Resin, Others), By Application (Adhesives, Coatings, Composites, Packaging, Paints & Varnishes, Foundry Binders, Food Packaging, Others), By End-users (Electrical and Electronics, Automotive, Civil Engineering, Marine and Shipbuilding, Healthcare, Oil & Gas, Packaging, Others) And Competitive Landscape
| Product Code: ETC022055 | Publication Date: Oct 2020 | Updated Date: Mar 2026 | Product Type: Report | |
| Publisher: 6Wresearch | Author: Ravi Bhandari | No. of Pages: 70 | No. of Figures: 35 | No. of Tables: 5 |
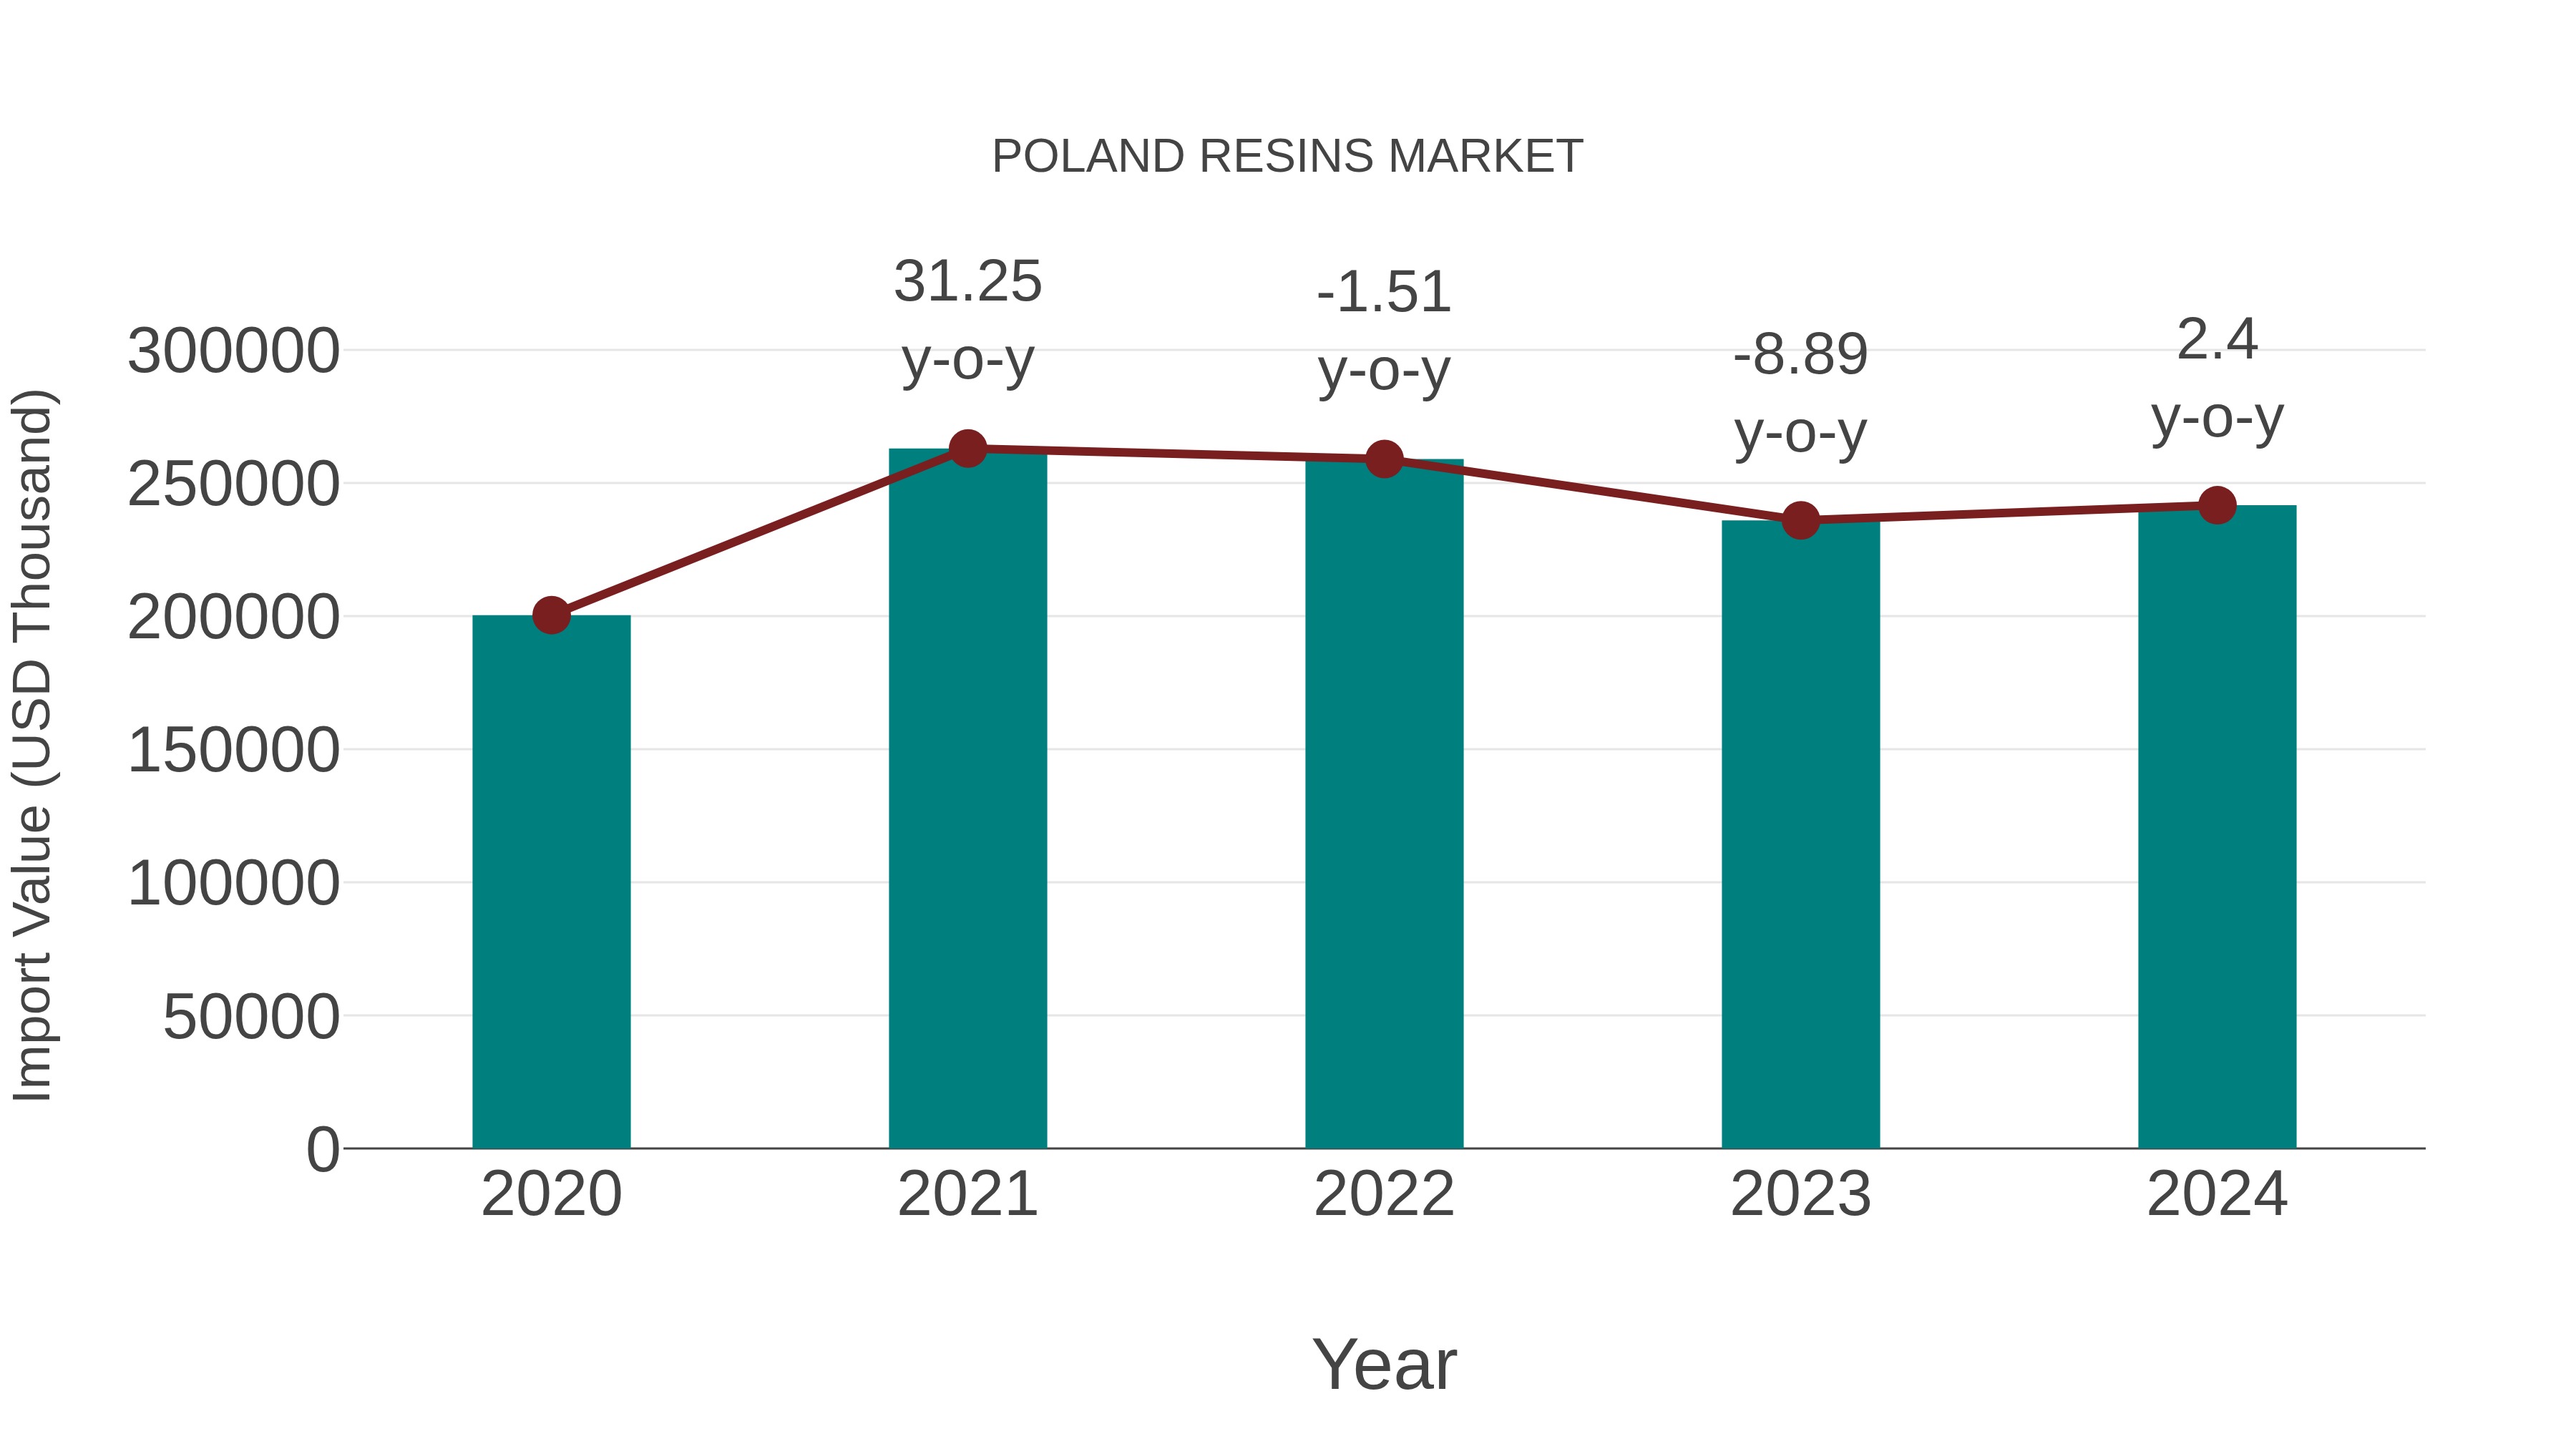
Poland Resins Market: Import Trend Analysis
Poland import trend in the resin market showed a growth rate of 2.4% from 2023 to 2024, with a compound annual growth rate (CAGR) of 4.79% from 2020 to 2024. This increase can be attributed to a steady demand shift towards high-quality resins in various industries, indicating market stability amidst changing trade dynamics.
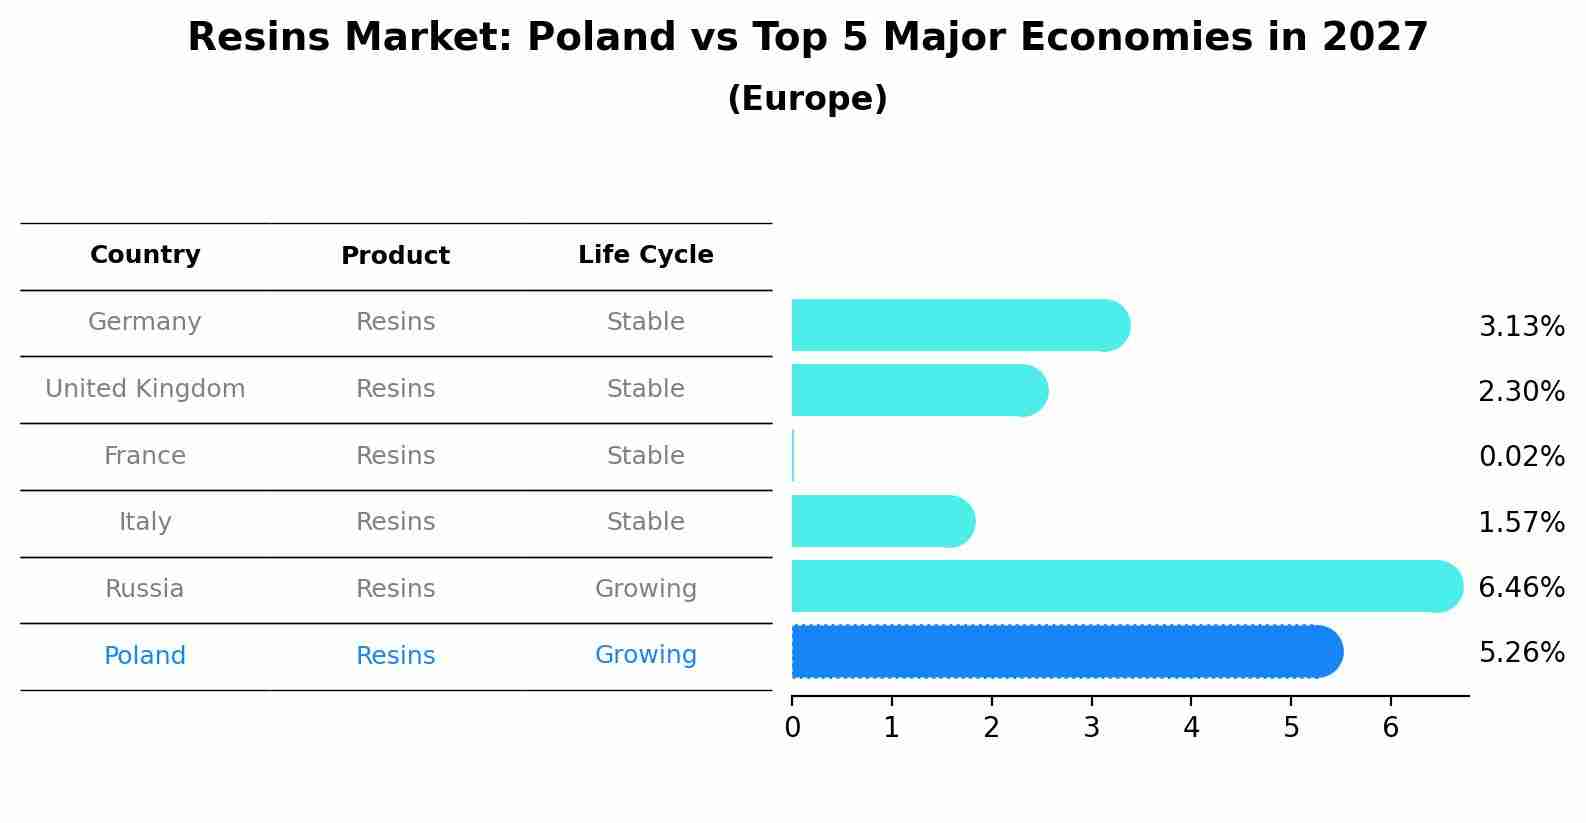
Resins Market: Poland vs Top 5 Major Economies in 2027 (Europe)
Poland's Resins market is anticipated to experience a growing growth rate of 5.26% by 2027, reflecting trends observed in the largest economy Germany, followed by United Kingdom, France, Italy and Russia.
Poland Resins Market Overview
Polands resins market is growing steadily, supported by demand from industries such as automotive, construction, and packaging. Resins are used as raw materials in the production of plastics, adhesives, and coatings. The market is shaped by the increasing need for high-performance materials and environmentally friendly products in various sectors.
Drivers of the market
The growth of the Poland resins market is primarily driven by increasing demand from industries such as automotive, construction, and packaging. Rising construction activities and the need for high-performance materials in manufacturing boost the demand for various types of resins. Additionally, the growing focus on sustainable and bio-based resins drives innovation and market expansion.
Challenges of the market
The Poland resins market encounters challenges such as fluctuating raw material prices and the need for continuous innovation to meet industry demands. Environmental regulations and the push for more sustainable and eco-friendly resins also impact market dynamics. Companies must navigate these regulatory requirements while balancing cost and performance to remain competitive.
Government Policy of the market
Polands resins market is influenced by policies aimed at promoting sustainable practices and reducing environmental impact. The government supports the development and use of eco-friendly resins through incentives and regulations. These policies address the production processes, safety standards, and environmental considerations associated with resin manufacturing.
Key Highlights of the Report:
- Poland Resins Market Outlook
- Market Size of Poland Resins Market, 2025
- Forecast of Poland Resins Market, 2032
- Historical Data and Forecast of Poland Resins Revenues & Volume for the Period 2022-2032F
- Poland Resins Market Trend Evolution
- Poland Resins Market Drivers and Challenges
- Poland Resins Price Trends
- Poland Resins Porter's Five Forces
- Poland Resins Industry Life Cycle
- Historical Data and Forecast of Poland Resins Market Revenues & Volume By Types for the Period 2022-2032F
- Historical Data and Forecast of Poland Resins Market Revenues & Volume By Unsaturated Polyester Resins for the Period 2022-2032F
- Historical Data and Forecast of Poland Resins Market Revenues & Volume By Alkyd Resins for the Period 2022-2032F
- Historical Data and Forecast of Poland Resins Market Revenues & Volume By Emulsion Polymers for the Period 2022-2032F
- Historical Data and Forecast of Poland Resins Market Revenues & Volume By Amino Resins for the Period 2022-2032F
- Historical Data and Forecast of Poland Resins Market Revenues & Volume By Polyester Resin for the Period 2022-2032F
- Historical Data and Forecast of Poland Resins Market Revenues & Volume By Polyurethane Resins for the Period 2022-2032F
- Historical Data and Forecast of Poland Resins Market Revenues & Volume By Polyamide Epichlorohydrin Resin for the Period 2022-2032F
- Historical Data and Forecast of Poland Unsaturated Polyester Resins Resins Market Revenues & Volume By Others for the Period 2022-2032F
- Historical Data and Forecast of Poland Resins Market Revenues & Volume By Application for the Period 2022-2032F
- Historical Data and Forecast of Poland Resins Market Revenues & Volume By Adhesives for the Period 2022-2032F
- Historical Data and Forecast of Poland Resins Market Revenues & Volume By Coatings for the Period 2022-2032F
- Historical Data and Forecast of Poland Resins Market Revenues & Volume By Composites for the Period 2022-2032F
- Historical Data and Forecast of Poland Resins Market Revenues & Volume By Packaging for the Period 2022-2032F
- Historical Data and Forecast of Poland Resins Market Revenues & Volume By Paints & Varnishes for the Period 2022-2032F
- Historical Data and Forecast of Poland Resins Market Revenues & Volume By Foundry Binders for the Period 2022-2032F
- Historical Data and Forecast of Poland Resins Market Revenues & Volume By Food Packaging for the Period 2022-2032F
- Historical Data and Forecast of Poland Resins Market Revenues & Volume By Others for the Period 2022-2032F
- Historical Data and Forecast of Poland Resins Market Revenues & Volume By End-users for the Period 2022-2032F
- Historical Data and Forecast of Poland Resins Market Revenues & Volume By Electrical and Electronics for the Period 2022-2032F
- Historical Data and Forecast of Poland Resins Market Revenues & Volume By Automotive for the Period 2022-2032F
- Historical Data and Forecast of Poland Resins Market Revenues & Volume By Civil Engineering for the Period 2022-2032F
- Historical Data and Forecast of Poland Resins Market Revenues & Volume By Marine and Shipbuilding for the Period 2022-2032F
- Historical Data and Forecast of Poland Resins Market Revenues & Volume By Healthcare for the Period 2022-2032F
- Historical Data and Forecast of Poland Resins Market Revenues & Volume By Oil & Gas for the Period 2022-2032F
- Historical Data and Forecast of Poland Resins Market Revenues & Volume By Packaging for the Period 2022-2032F
- Historical Data and Forecast of Poland Resins Market Revenues & Volume By Others for the Period 2022-2032F
- Poland Resins Import Export Trade Statistics
- Market Opportunity Assessment By Types
- Market Opportunity Assessment By Application
- Market Opportunity Assessment By End-users
- Poland Resins Top Companies Market Share
- Poland Resins Competitive Benchmarking By Technical and Operational Parameters
- Poland Resins Company Profiles
- Poland Resins Key Strategic Recommendations
Poland Resins Market (2026-2032): FAQs
6Wresearch actively monitors the Poland Resins Market and publishes its comprehensive annual report, highlighting emerging trends, growth drivers, revenue analysis, and forecast outlook. Our insights help businesses to make data-backed strategic decisions with ongoing market dynamics. Our analysts track relevent industries related to the Poland Resins Market, allowing our clients with actionable intelligence and reliable forecasts tailored to emerging regional needs.
Yes, we provide customisation as per your requirements. To learn more, feel free to contact us on sales@6wresearch.com
1 Executive Summary |
2 Introduction |
2.1 Key Highlights of the Report |
2.2 Report Description |
2.3 Market Scope & Segmentation |
2.4 Research Methodology |
2.5 Assumptions |
3 Poland Resins Market Overview |
3.1 Poland Country Macro Economic Indicators |
3.2 Poland Resins Market Revenues & Volume, 2022 & 2032F |
3.3 Poland Resins Market - Industry Life Cycle |
3.4 Poland Resins Market - Porter's Five Forces |
3.5 Poland Resins Market Revenues & Volume Share, By Types, 2022 & 2032F |
3.6 Poland Resins Market Revenues & Volume Share, By Application, 2022 & 2032F |
3.7 Poland Resins Market Revenues & Volume Share, By End-users, 2022 & 2032F |
4 Poland Resins Market Dynamics |
4.1 Impact Analysis |
4.2 Market Drivers |
4.3 Market Restraints |
5 Poland Resins Market Trends |
6 Poland Resins Market, By Types |
6.1 Poland Resins Market, By Types |
6.1.1 Overview and Analysis |
6.1.2 Poland Resins Market Revenues & Volume, By Types, 2022-2032F |
6.1.3 Poland Resins Market Revenues & Volume, By Unsaturated Polyester Resins, 2022-2032F |
6.1.4 Poland Resins Market Revenues & Volume, By Alkyd Resins, 2022-2032F |
6.1.5 Poland Resins Market Revenues & Volume, By Emulsion Polymers, 2022-2032F |
6.1.6 Poland Resins Market Revenues & Volume, By Amino Resins, 2022-2032F |
6.1.7 Poland Resins Market Revenues & Volume, By Polyester Resin, 2022-2032F |
6.1.8 Poland Resins Market Revenues & Volume, By Polyurethane Resins, 2022-2032F |
6.1.9 Poland Resins Market Revenues & Volume, By Others, 2022-2032F |
6.1.10 Poland Resins Market Revenues & Volume, By Others, 2022-2032F |
6.2 Poland Resins Market, By Application |
6.2.1 Overview and Analysis |
6.2.2 Poland Resins Market Revenues & Volume, By Adhesives, 2022-2032F |
6.2.3 Poland Resins Market Revenues & Volume, By Coatings, 2022-2032F |
6.2.4 Poland Resins Market Revenues & Volume, By Composites, 2022-2032F |
6.2.5 Poland Resins Market Revenues & Volume, By Packaging, 2022-2032F |
6.2.6 Poland Resins Market Revenues & Volume, By Paints & Varnishes, 2022-2032F |
6.2.7 Poland Resins Market Revenues & Volume, By Foundry Binders, 2022-2032F |
6.2.8 Poland Resins Market Revenues & Volume, By Others, 2022-2032F |
6.2.9 Poland Resins Market Revenues & Volume, By Others, 2022-2032F |
6.3 Poland Resins Market, By End-users |
6.3.1 Overview and Analysis |
6.3.2 Poland Resins Market Revenues & Volume, By Electrical and Electronics, 2022-2032F |
6.3.3 Poland Resins Market Revenues & Volume, By Automotive, 2022-2032F |
6.3.4 Poland Resins Market Revenues & Volume, By Civil Engineering, 2022-2032F |
6.3.5 Poland Resins Market Revenues & Volume, By Marine and Shipbuilding, 2022-2032F |
6.3.6 Poland Resins Market Revenues & Volume, By Healthcare, 2022-2032F |
6.3.7 Poland Resins Market Revenues & Volume, By Oil & Gas, 2022-2032F |
6.3.8 Poland Resins Market Revenues & Volume, By Others, 2022-2032F |
6.3.9 Poland Resins Market Revenues & Volume, By Others, 2022-2032F |
7 Poland Resins Market Import-Export Trade Statistics |
7.1 Poland Resins Market Export to Major Countries |
7.2 Poland Resins Market Imports from Major Countries |
8 Poland Resins Market Key Performance Indicators |
9 Poland Resins Market - Opportunity Assessment |
9.1 Poland Resins Market Opportunity Assessment, By Types, 2022 & 2032F |
9.2 Poland Resins Market Opportunity Assessment, By Application, 2022 & 2032F |
9.3 Poland Resins Market Opportunity Assessment, By End-users, 2022 & 2032F |
10 Poland Resins Market - Competitive Landscape |
10.1 Poland Resins Market Revenue Share, By Companies, 2025 |
10.2 Poland Resins Market Competitive Benchmarking, By Operating and Technical Parameters |
11 Company Profiles |
12 Recommendations |
13 Disclaimer |
Global Go To Market Strategy - 2030
Export potential enables firms to identify high-growth global markets with greater confidence by combining advanced trade intelligence with a structured quantitative methodology. The framework analyzes emerging demand trends and country-level import patterns while integrating macroeconomic and trade datasets such as GDP and population forecasts, bilateral import–export flows, tariff structures, elasticity differentials between developed and developing economies, geographic distance, and import demand projections. Using weighted trade values from 2020–2024 as the base period to project country-to-country export potential for 2030, these inputs are operationalized through calculated drivers such as gravity model parameters, tariff impact factors, and projected GDP per-capita growth. Through an analysis of hidden potentials, demand hotspots, and market conditions that are most favorable to success, this method enables firms to focus on target countries, maximize returns, and global expansion with data, backed by accuracy.
By factoring in the projected importer demand gap that is currently unmet and could be potential opportunity, it identifies the potential for the Exporter (Country) among 190 countries, against the general trade analysis, which identifies the biggest importer or exporter.
To discover high-growth global markets and optimize your business strategy:
Click Here
Pricing
- Single User License$ 1,995
- Department License$ 2,400
- Site License$ 3,120
- Global License$ 3,795

Leadership Perspectives from Industry Events
Search
Thought Leadership and Analyst Meet


Our Clients
6WResearch In News
- India Air Conditioner Market Set for Strong Rebound in 2026 After Weather-Led Correction and GST-Driven Recovery: 6Wresearch
- ADAS in India: How Automatic Emergency Braking, Blind Spot Detection & Driver Monitoring are Transforming Road Safety
- Doha a strategic location for EV manufacturing hub: IPA Qatar
- Demand for luxury TVs surging in the GCC, says Samsung
- Empowering Growth: The Thriving Journey of Bangladesh’s Cable Industry
- Demand for luxury TVs surging in the GCC, says Samsung
Latest Reports
- Poland Fire Protection Systems Market (2026-2032)
- Cape Verde Portable Hand-Thrown Extinguisher Market (2026-2032)
- Canada Portable Hand-Thrown Extinguisher Market (2026-2032)
- Cameroon Portable Hand-Thrown Extinguisher Market (2026-2032)
- Burundi Portable Hand-Thrown Extinguisher Market (2026-2032)
- Burkina Faso Portable Hand-Thrown Extinguisher Market (2026-2032)
- Bulgaria Portable Hand-Thrown Extinguisher Market (2026-2032)
- Brunei Portable Hand-Thrown Extinguisher Market (2026-2032)
- Botswana Portable Hand-Thrown Extinguisher Market (2026-2032)
- Bosnia and Herzegovina Portable Hand-Thrown Extinguisher Market (2026-2032)
Industry Events and Analyst Meet

HIMTEX 2026

India Refining Summit 2026

India EV Show 2026

EV tech India Expo 2026

Auto Tech Asia 2026
Whitepaper
- Middle East & Africa Commercial Security Market Click here to view more.
- Middle East & Africa Fire Safety Systems & Equipment Market Click here to view more.
- GCC Drone Market Click here to view more.
- Middle East Lighting Fixture Market Click here to view more.
- GCC Physical & Perimeter Security Market Click here to view more.