Qatar Ammonium Bisulfite Market (2026-2032) Outlook | Companies, Value, Industry, Growth, Size, Share, Revenue, Forecast, Trends, Analysis
Market Forecast By Type (Pharmaceutical Grade, Chemical Grade), By Application (Reducing Agent, Medicine, Dye Intermediates, Other) And Competitive Landscape
| Product Code: ETC198593 | Publication Date: May 2022 | Updated Date: Jun 2026 | Product Type: Market Research Report | |
| Publisher: 6Wresearch | Author: Ravi Bhandari | No. of Pages: 60 | No. of Figures: 40 | No. of Tables: 7 |
Qatar Ammonium Bisulfite Market Size, Share & Growth Rate
The Qatar Ammonium Bisulfite Market was estimated at USD 354 Million in 2025 and is projected to reach USD 475 Million by 2032, growing at a CAGR of 4.3% from 2026 to 2032. This growth trajectory is largely attributed to the compound's essential role in various industries, including water treatment and food preservation, where it serves as a critical reducing agent. Furthermore, the increasing demand for safe food preservation techniques and effective water purification solutions is expected to further enhance market prospects.
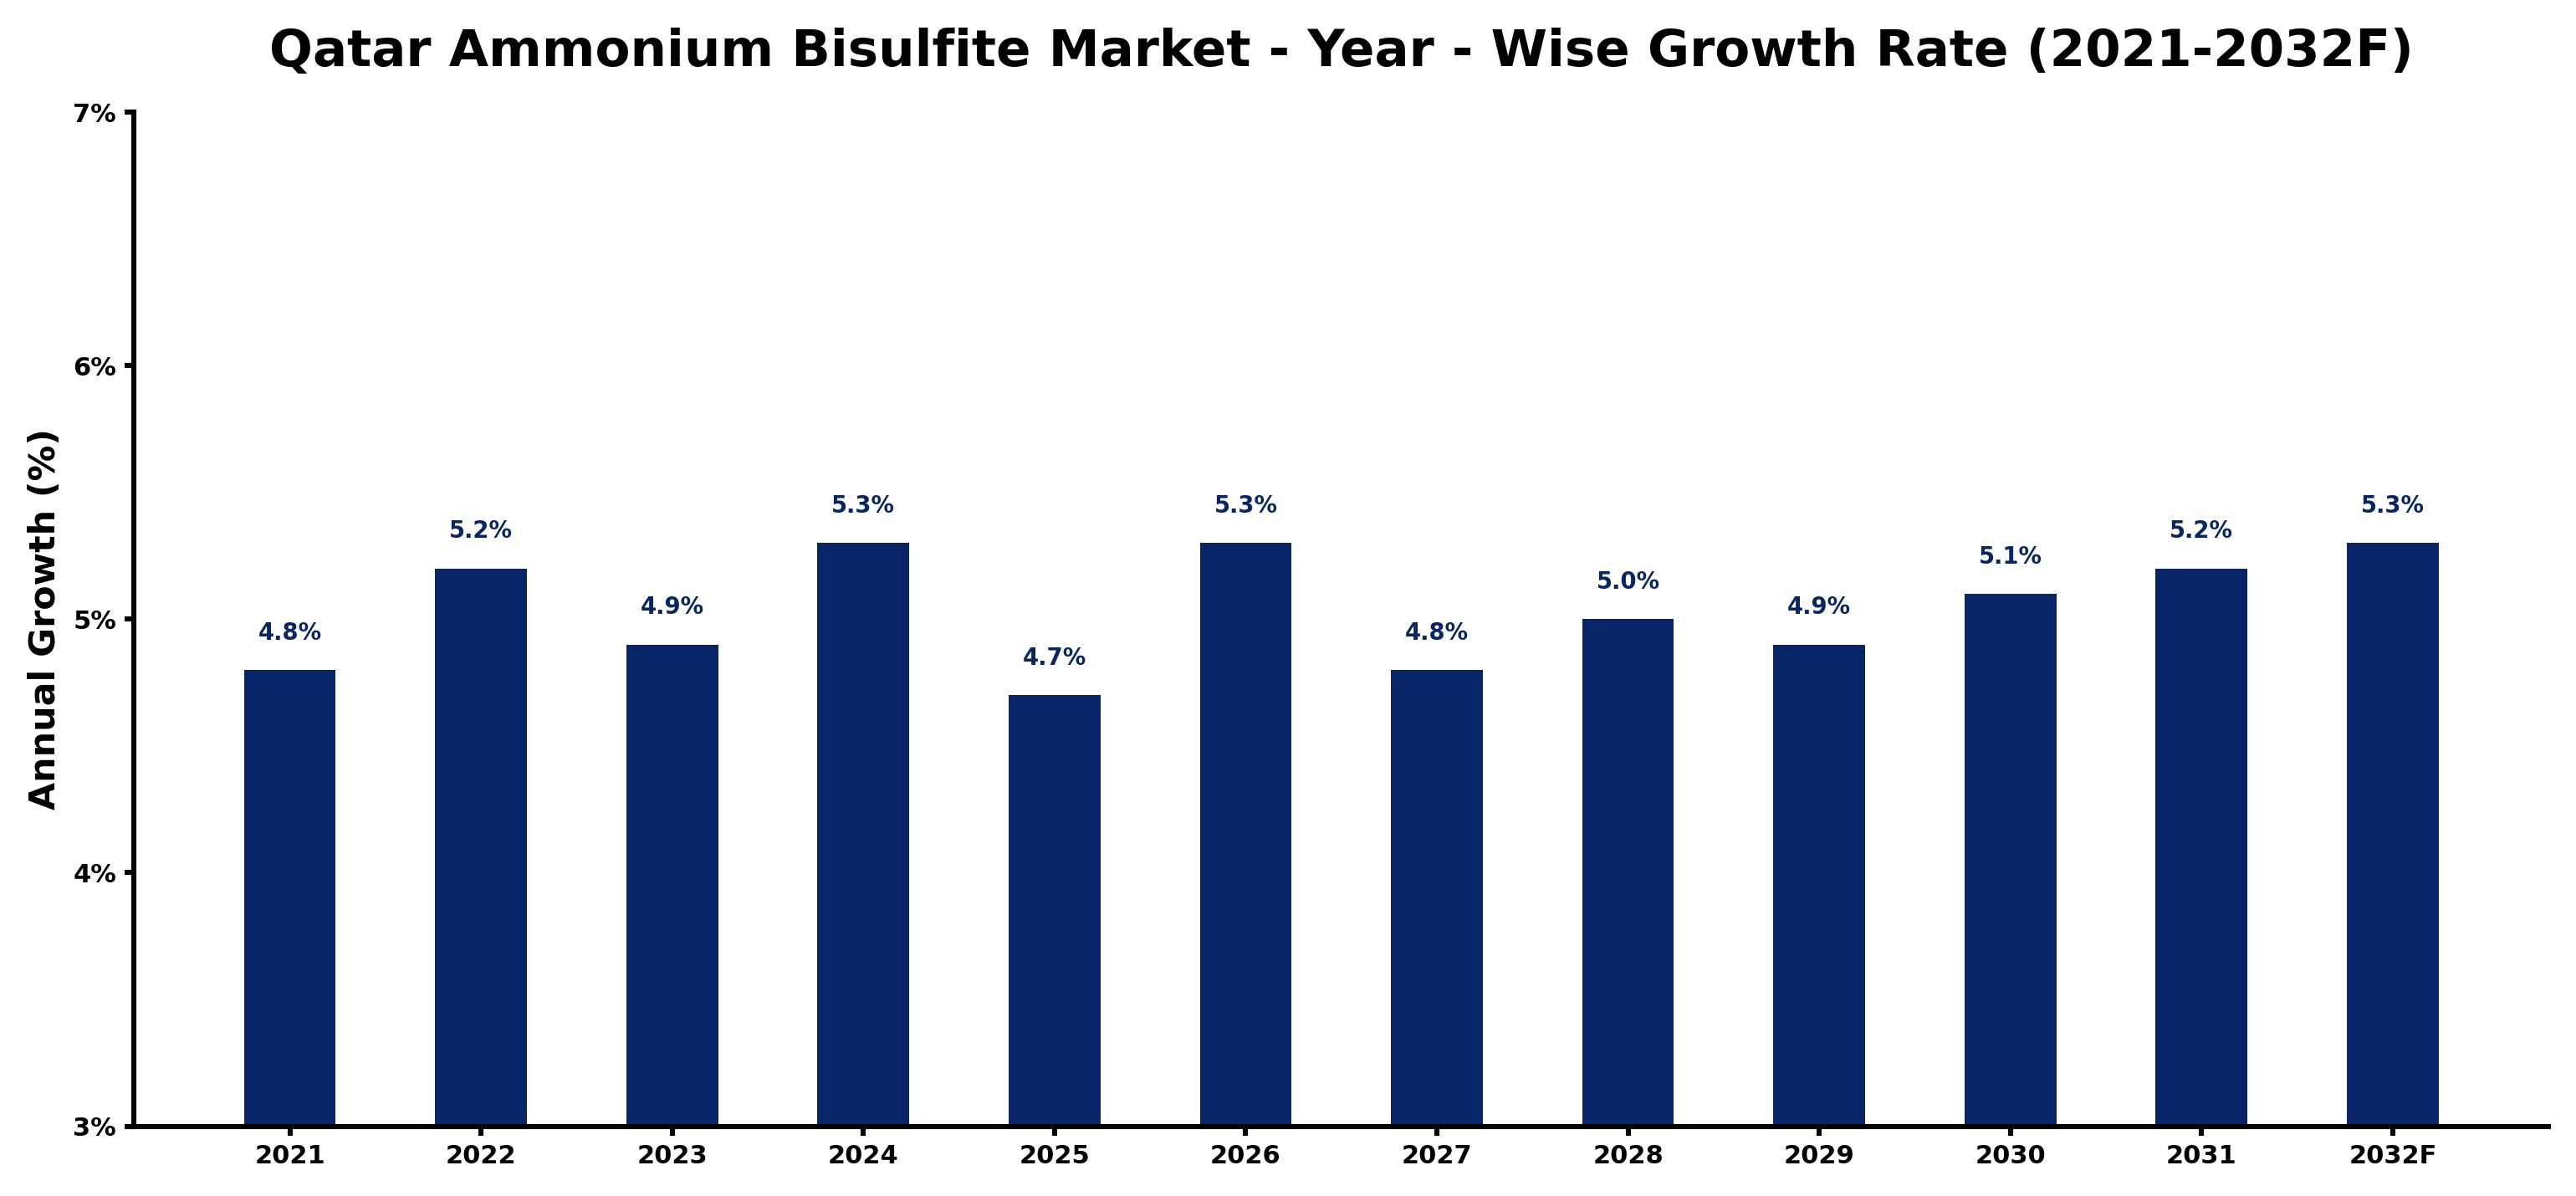
Qatar Ammonium Bisulfite Market Growth Rate Analysis (2021-2032)
The Qatar Ammonium Bisulfite market has shown a stable growth pattern, recording a 4.8% increase in 2021, followed by a slight uptick to 5.2% in 2022. The growth rate fluctuated slightly in subsequent years, settling at 4.9% in 2023, before picking up momentum again to 5.3% in 2024. This upward trend can be attributed to increased demand in various applications, particularly in water treatment and food processing sectors, alongside significant investments in local manufacturing capabilities. Furthermore, a gradual transition toward sustainable practices and regulations boosting the use of eco-friendly chemicals have fostered an environment ripe for continued growth through 2032, with projections maintaining annual increases around 5%.
Qatar Ammonium Bisulfite Market Year-wise Growth Rate and Key Drivers
This graph highlights how the Qatar Ammonium Bisulfite Market has steadily grown over the past five years, supported by major growth factors.
The table below presents the year‑wise growth rates along with the key drivers influencing the market
| Year | Growth Rate | Major Drivers |
| 2021 | 4.8% | Increased industrial applications driving demand |
| 2022 | 5.2% | Growing environmental regulations support usage |
| 2023 | 4.9% | Rising awareness of sustainable practices |
| 2024 | 5.3% | Expansion of chemical manufacturing facilities |
| 2025 | 4.7% | Enhanced product formulations gaining traction |
| 2026 | 5.3% | Growing demand from food processing |
| 2027 | 4.8% | Industrial activity supported growth |
| 2028 | 5.0% | Rising investments in agricultural sectors |
| 2029 | 4.9% | Technological advancements improving efficiency |
| 2030 | 5.1% | Growing export opportunities in region |
| 2031 | 5.2% | Increased collaboration with research institutions |
| 2032 | 5.3% | Rising demand for eco-friendly alternatives |
Note - Market size estimations and growth projections presented in this report are based on 6Wresearch’s advanced forecasting approach, validated with industry datasets as of June 2026.
Qatar Ammonium Bisulfite Market Synopsis
The most significant force shaping the Qatar ammonium bisulfite market today is its diverse applications, particularly in food preservation and water treatment. As concerns about food safety and water quality rise, the need for effective preservation agents and purification chemicals becomes imperative.
With an established production base, Qatar has positioned itself as a key player in the ammonium bisulfite market. The country’s exports predominantly cater to neighboring markets, underscoring the strategic importance of this compound in regional supply chains.
Qatar Ammonium Bisulfite Market Key Takeaways
- The market is projected to grow steadily due to increasing demand for ammonium bisulfite in various industries.
- Key drivers include its use in water purification and food preservation applications.
- The market is sensitive to fluctuations in raw material costs and energy prices.
- Environmental regulations will require ongoing investments in sustainable technologies.
- Post-pandemic recovery in textiles and food sectors will influence market dynamics moving forward.
Evaluation of Restraints in Qatar Ammonium Bisulfite Market
Despite its growth potential, the Qatar ammonium bisulfite market faces substantial restraints that could hinder its expansion. Primarily, the volatility in raw material prices and energy costs can severely impact production expenses. Additionally, regulatory scrutiny regarding environmental concerns associated with chemical processing requires businesses to invest significantly in compliance and waste management technologies. Balancing production efficiency with environmental stewardship presents an ongoing challenge for the sector, which necessitates innovation and adaptability.
Qatar Ammonium Bisulfite Market Trends
One notable trend shaping the Qatar ammonium bisulfite market is the growing emphasis on sustainable practices. As industries strive to reduce their environmental footprint, there is a concerted push towards cleaner production methods and waste minimization strategies. Additionally, advancements in technology related to chemical processing are driving efficiency and enhancing product quality, thereby boosting the compound's appeal across various applications.
Qatar Ammonium Bisulfite Market Opportunities
Opportunities for growth in the Qatar ammonium bisulfite market are plentiful. The increasing demand for sustainable agricultural practices and eco-friendly fertilizers opens new avenues for ammonium bisulfite in fertilizer production. Moreover, as the global emphasis on clean water initiatives intensifies, Qatar’s position as a supplier of chemical solutions for water treatment processes is likely to become even more critical. The combination of these factors presents attractive investment opportunities for stakeholders looking to capitalize on the market's growth trajectory.
Government Initiatives in the Qatar Ammonium Bisulfite Market
The government of Qatar is actively promoting initiatives that encourage the adoption of sustainable chemical processes. Policies aimed at enhancing environmental responsibility among industrial players include support for innovative waste management solutions and incentives for technologies that reduce emissions. Such initiatives not only bolster the ammonium bisulfite market but also reinforce the nation's commitment to sustainable development.
Future Insights of the Qatar Ammonium Bisulfite Market
Looking ahead to the period from 2026 to 2032, the Qatar ammonium bisulfite market is poised for steady growth. The continued rise in industrial activities, particularly in food processing and textiles, will fuel demand for this compound. Additionally, as Qatar focuses on diversifying its economy and investing in infrastructure, the expanded applications of ammonium bisulfite in emerging sectors will likely further enhance market dynamics.
Qatar Ammonium Bisulfite Market Latest Developments (May 2025 - June 2026)
Recent developments in the Qatar ammonium bisulfite market reflect an increasing alignment with global sustainability goals. Efforts to innovate in production processes and enhance product applications are being observed. Companies are engaging in partnerships aimed at developing eco-friendly technologies and improving the overall efficiency of their operations, indicating a positive shift towards sustainability within the sector.
Qatar Ammonium Bisulfite Market - Key Attractiveness of the Report
- 10 Years of Market Numbers
- Historical Data Starting from 2022 to 2025
- Base Year: 2025
- Forecast Data until 2032
- Key Performance Indicators Impacting the Market
- Major Upcoming Developments and Projects
Key Highlights of the Report:
- Qatar Ammonium Bisulfite Market Outlook
- Market Size of Qatar Ammonium Bisulfite Market, 2025
- Forecast of Qatar Ammonium Bisulfite Market, 2032
- Historical Data and Forecast of Qatar Ammonium Bisulfite Revenues & Volume for the Period 2022-2032F
- Qatar Ammonium Bisulfite Market Trend Evolution
- Qatar Ammonium Bisulfite Market Drivers and Challenges
- Qatar Ammonium Bisulfite Price Trends
- Qatar Ammonium Bisulfite Porter's Five Forces
- Qatar Ammonium Bisulfite Industry Life Cycle
- Historical Data and Forecast of Qatar Ammonium Bisulfite Market Revenues & Volume By Type for the Period 2022-2032F
- Historical Data and Forecast of Qatar Ammonium Bisulfite Market Revenues & Volume By Pharmaceutical Grade for the Period 2022-2032F
- Historical Data and Forecast of Qatar Ammonium Bisulfite Market Revenues & Volume By Chemical Grade for the Period 2022-2032F
- Historical Data and Forecast of Qatar Ammonium Bisulfite Market Revenues & Volume By Application for the Period 2022-2032F
- Historical Data and Forecast of Qatar Ammonium Bisulfite Market Revenues & Volume By Reducing Agent for the Period 2022-2032F
- Historical Data and Forecast of Qatar Ammonium Bisulfite Market Revenues & Volume By Medicine for the Period 2022-2032F
- Historical Data and Forecast of Qatar Ammonium Bisulfite Market Revenues & Volume By Dye Intermediates for the Period 2022-2032F
- Historical Data and Forecast of Qatar Ammonium Bisulfite Market Revenues & Volume By Other for the Period 2022-2032F
- Qatar Ammonium Bisulfite Import Export Trade Statistics
- Market Opportunity Assessment By Type
- Market Opportunity Assessment By Application
- Qatar Ammonium Bisulfite Top Companies Market Share
- Qatar Ammonium Bisulfite Competitive Benchmarking By Technical and Operational Parameters
- Qatar Ammonium Bisulfite Company Profiles
- Qatar Ammonium Bisulfite Key Strategic Recommendations
Qatar Ammonium Bisulfite Market - Frequently Asked Questions
The market is estimated to be valued at USD 354 Million in 2025 and is anticipated to reach USD 475 Million by 2032, indicating a robust CAGR of 4.3% between 2026 and 2032.
Ammonium bisulfite plays a pivotal role in water treatment by serving as a reducing agent that effectively removes chlorine, thus enhancing water quality and safety for consumers.
Key industries utilizing ammonium bisulfite include food processing, textiles, and pulp and paper manufacturing, all of which rely heavily on the compound for various applications.
The growth is primarily driven by increasing demand for food preservation techniques, effective water purification solutions, and the expanding uses of ammonium bisulfite in industrial processes.
Environmental scrutiny is prompting manufacturers to invest in technologies that minimize waste and emissions, thereby balancing profitability with sustainable practices.
6Wresearch actively monitors the Qatar Ammonium Bisulfite Market and publishes its comprehensive annual report, highlighting emerging trends, growth drivers, revenue analysis, and forecast outlook. Our insights help businesses to make data-backed strategic decisions with ongoing market dynamics. Our analysts track relevent industries related to the Qatar Ammonium Bisulfite Market, allowing our clients with actionable intelligence and reliable forecasts tailored to emerging regional needs.
Yes, we provide customisation as per your requirements. To learn more, feel free to contact us on sales@6wresearch.com
1 Executive Summary |
2 Introduction |
2.1 Key Highlights of the Report |
2.2 Report Description |
2.3 Market Scope & Segmentation |
2.4 Research Methodology |
2.5 Assumptions |
3 Qatar Ammonium Bisulfite Market Overview |
3.1 Qatar Country Macro Economic Indicators |
3.2 Qatar Ammonium Bisulfite Market Revenues & Volume, 2022 & 2032F |
3.3 Qatar Ammonium Bisulfite Market - Industry Life Cycle |
3.4 Qatar Ammonium Bisulfite Market - Porter's Five Forces |
3.5 Qatar Ammonium Bisulfite Market Revenues & Volume Share, By Type, 2022 & 2032F |
3.6 Qatar Ammonium Bisulfite Market Revenues & Volume Share, By Application, 2022 & 2032F |
4 Qatar Ammonium Bisulfite Market Dynamics |
4.1 Impact Analysis |
4.2 Market Drivers |
4.2.1 Growing demand for ammonium bisulfite in industries such as agriculture, water treatment, and oil gas due to its versatile applications. |
4.2.2 Increasing investments in infrastructure projects in Qatar leading to higher demand for water treatment chemicals like ammonium bisulfite. |
4.2.3 Government initiatives promoting sustainable agricultural practices driving the need for products like ammonium bisulfite. |
4.3 Market Restraints |
4.3.1 Fluctuating raw material prices impacting the production cost of ammonium bisulfite. |
4.3.2 Stringent regulations and compliance standards related to handling and usage of chemicals like ammonium bisulfite. |
4.3.3 Intense competition in the market leading to pricing pressures and margin challenges for manufacturers. |
5 Qatar Ammonium Bisulfite Market Trends |
6 Qatar Ammonium Bisulfite Market, By Types |
6.1 Qatar Ammonium Bisulfite Market, By Type |
6.1.1 Overview and Analysis |
6.1.2 Qatar Ammonium Bisulfite Market Revenues & Volume, By Type, 2022-2032F |
6.1.3 Qatar Ammonium Bisulfite Market Revenues & Volume, By Pharmaceutical Grade, 2022-2032F |
6.1.4 Qatar Ammonium Bisulfite Market Revenues & Volume, By Chemical Grade, 2022-2032F |
6.2 Qatar Ammonium Bisulfite Market, By Application |
6.2.1 Overview and Analysis |
6.2.2 Qatar Ammonium Bisulfite Market Revenues & Volume, By Reducing Agent, 2022-2032F |
6.2.3 Qatar Ammonium Bisulfite Market Revenues & Volume, By Medicine, 2022-2032F |
6.2.4 Qatar Ammonium Bisulfite Market Revenues & Volume, By Dye Intermediates, 2022-2032F |
6.2.5 Qatar Ammonium Bisulfite Market Revenues & Volume, By Other, 2022-2032F |
7 Qatar Ammonium Bisulfite Market Import-Export Trade Statistics |
7.1 Qatar Ammonium Bisulfite Market Export to Major Countries |
7.2 Qatar Ammonium Bisulfite Market Imports from Major Countries |
8 Qatar Ammonium Bisulfite Market Key Performance Indicators |
8.1 Percentage of market penetration in key industries (agriculture, water treatment, oil gas). |
8.2 Growth rate of infrastructure projects in Qatar. |
8.3 Adoption rate of sustainable agriculture practices in the country. |
9 Qatar Ammonium Bisulfite Market - Opportunity Assessment |
9.1 Qatar Ammonium Bisulfite Market Opportunity Assessment, By Type, 2022 & 2032F |
9.2 Qatar Ammonium Bisulfite Market Opportunity Assessment, By Application, 2022 & 2032F |
10 Qatar Ammonium Bisulfite Market - Competitive Landscape |
10.1 Qatar Ammonium Bisulfite Market Revenue Share, By Companies, 2025 |
10.2 Qatar Ammonium Bisulfite Market Competitive Benchmarking, By Operating and Technical Parameters |
11 Company Profiles |
12 Recommendations |
13 Disclaimer |
Global Go To Market Strategy - 2030
Export potential enables firms to identify high-growth global markets with greater confidence by combining advanced trade intelligence with a structured quantitative methodology. The framework analyzes emerging demand trends and country-level import patterns while integrating macroeconomic and trade datasets such as GDP and population forecasts, bilateral import–export flows, tariff structures, elasticity differentials between developed and developing economies, geographic distance, and import demand projections. Using weighted trade values from 2020–2024 as the base period to project country-to-country export potential for 2030, these inputs are operationalized through calculated drivers such as gravity model parameters, tariff impact factors, and projected GDP per-capita growth. Through an analysis of hidden potentials, demand hotspots, and market conditions that are most favorable to success, this method enables firms to focus on target countries, maximize returns, and global expansion with data, backed by accuracy.
By factoring in the projected importer demand gap that is currently unmet and could be potential opportunity, it identifies the potential for the Exporter (Country) among 190 countries, against the general trade analysis, which identifies the biggest importer or exporter.
To discover high-growth global markets and optimize your business strategy:
Click Here
Pricing
- Single User License$ 1,995
- Department License$ 2,400
- Site License$ 3,120
- Global License$ 3,795

Leadership Perspectives from Industry Events
Search
Thought Leadership and Analyst Meet


Our Clients
6WResearch In News
- India Air Conditioner Market Set for Strong Rebound in 2026 After Weather-Led Correction and GST-Driven Recovery: 6Wresearch
- ADAS in India: How Automatic Emergency Braking, Blind Spot Detection & Driver Monitoring are Transforming Road Safety
- Doha a strategic location for EV manufacturing hub: IPA Qatar
- Demand for luxury TVs surging in the GCC, says Samsung
- Empowering Growth: The Thriving Journey of Bangladesh’s Cable Industry
- Demand for luxury TVs surging in the GCC, says Samsung
Latest Reports
- Poland Fire Protection Systems Market (2026-2032)
- Cape Verde Portable Hand-Thrown Extinguisher Market (2026-2032)
- Canada Portable Hand-Thrown Extinguisher Market (2026-2032)
- Cameroon Portable Hand-Thrown Extinguisher Market (2026-2032)
- Burundi Portable Hand-Thrown Extinguisher Market (2026-2032)
- Burkina Faso Portable Hand-Thrown Extinguisher Market (2026-2032)
- Bulgaria Portable Hand-Thrown Extinguisher Market (2026-2032)
- Brunei Portable Hand-Thrown Extinguisher Market (2026-2032)
- Botswana Portable Hand-Thrown Extinguisher Market (2026-2032)
- Bosnia and Herzegovina Portable Hand-Thrown Extinguisher Market (2026-2032)
Industry Events and Analyst Meet

HIMTEX 2026

India Refining Summit 2026

India EV Show 2026

EV tech India Expo 2026

Auto Tech Asia 2026
Whitepaper
- Middle East & Africa Commercial Security Market Click here to view more.
- Middle East & Africa Fire Safety Systems & Equipment Market Click here to view more.
- GCC Drone Market Click here to view more.
- Middle East Lighting Fixture Market Click here to view more.
- GCC Physical & Perimeter Security Market Click here to view more.