Qatar Anhydrides Market (2026-2032) | Industry, Trends, Value, Size, Outlook, Growth, Analysis, Forecast, Companies, Revenue & Share
Market Forecast By Composition (Inorganic, Organic), By Types (Acetic Anhydride, Maleic Anhydride, Isobutyric Anhydride, Propionic Anhydride, Phthalic Anhydride, Isatoic Acid Anhydride, Others), By Application (Pesticides, Plasticizers, Dyes & Pigments, Additives, Flavors, Others), By End-Use Industry (Construction, Pharmaceuticals, Automotive, Agrochemicals, Textiles, Food & Beverages, Others) And Competitive Landscape
| Product Code: ETC046821 | Publication Date: Jul 2023 | Updated Date: Jun 2026 | Product Type: Report | |
| Publisher: 6Wresearch | Author: Ravi Bhandari | No. of Pages: 70 | No. of Figures: 35 | No. of Tables: 5 |
Qatar Anhydrides Market Size, Share & Growth Rate
The Qatar Anhydrides Market was estimated at USD 202 Million in 2025 and is projected to reach USD 276 Million by 2032, growing at a CAGR of 4.6% from 2026 to 2032. This positive trajectory is largely driven by the burgeoning construction sector, which is fueled by ambitious infrastructure developments and significant investments in urban projects. Furthermore, the increasing demand for high-performance materials across various industries, particularly in the automotive and manufacturing sectors, reinforces this growth outlook.
Qatar Anhydrides Market Growth Rate Analysis (2021-2032)
The Qatar anhydrides market has shown a stable growth pattern, with annual growth rates ranging from 5.1% to 5.7% from 2021 to 2032. Factors driving this steady expansion include rising investments in the chemical manufacturing sector and increased consumer demand for specialty chemicals, particularly in the automotive and construction industries. Notably, growth peaked at 5.7% in both 2023 and 2027, reflecting heightened industrial activity and advancements in production technologies. Despite minor fluctuations, such as a dip to 5.1% in 2032, the market remains resilient, buoyed by supportive government policies aimed at enhancing infrastructure and facilitating energy transition initiatives. Digitalization efforts are also streamlining operations, further fostering growth.
Qatar Anhydrides Market Year-wise Growth Rate and Key Drivers
This graph highlights how the Qatar Anhydrides Market has steadily grown over the past five years, supported by major growth factors.
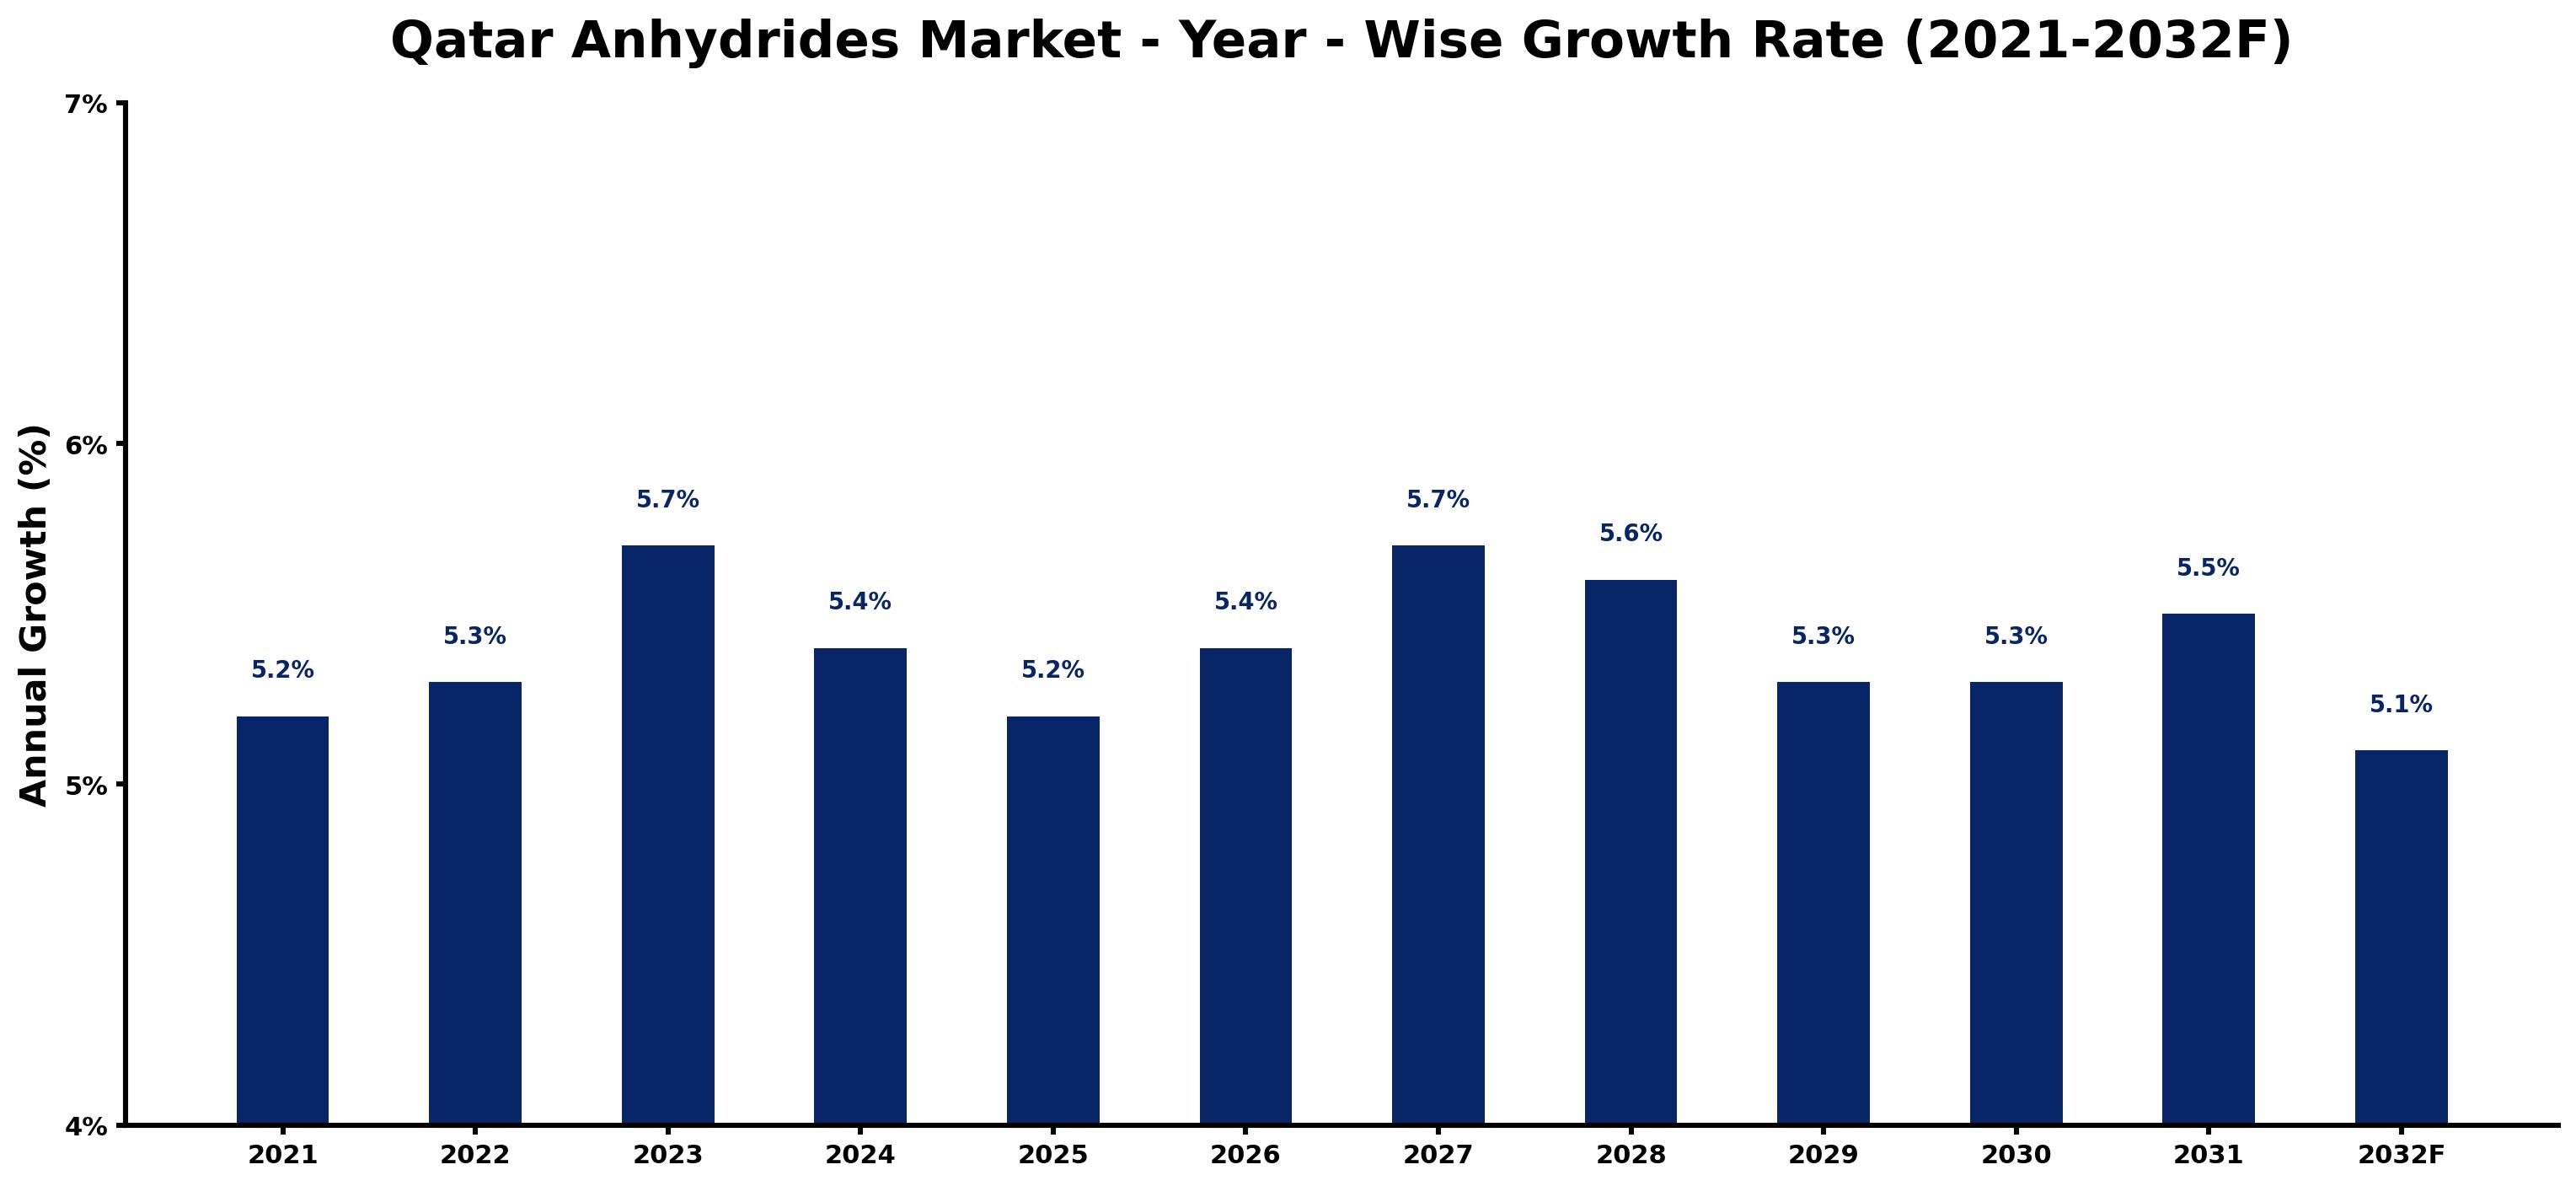
The table below presents the year‑wise growth rates along with the key drivers influencing the market
| Year | Growth Rate | Major Drivers |
| 2021 | 5.2% | Rising electricity demand across industries |
| 2022 | 5.3% | Increasing industrial automation investments |
| 2023 | 5.7% | Rising electricity demand across industries |
| 2024 | 5.4% | Increasing adoption of advanced technologies |
| 2025 | 5.2% | Increasing industrial infrastructure investments |
| 2026 | 5.4% | Increasing adoption of advanced technologies |
| 2027 | 5.7% | Government infrastructure modernization initiatives |
| 2028 | 5.6% | Rising electricity demand across industries |
| 2029 | 5.3% | Growing urbanization and commercial development |
| 2030 | 5.3% | Government infrastructure modernization initiatives |
| 2031 | 5.5% | Growing urbanization and commercial development |
| 2032 | 5.1% | Expansion of manufacturing activities |
Note - Market size estimations and growth projections presented in this report are based on 6Wresearch’s advanced forecasting approach, validated with industry datasets as of June 2026.
Qatar Anhydrides Market Synopsis
Qatar's anhydrides market is witnessing a robust demand surge, particularly due to the ongoing urban development initiatives aimed at enhancing the nation's infrastructure. The anticipated increase in construction activities, spurred by major events such as the FIFA World Cup, is set to elevate the consumption of anhydrides in adhesives and coatings.
Moreover, the healthcare sector's growing reliance on pharmaceutical formulations containing anhydrides further drives market momentum. As local manufacturing capabilities expand, the industry is positioned to meet both domestic and international demand for these essential chemical compounds.
Qatar Anhydrides Market Key Takeaways
- The market is primarily driven by significant investments in infrastructure and construction activities.
- Increased usage of anhydrides in the production of adhesives and coatings is a notable trend.
- Resilience during the Covid-19 pandemic highlighted the market's adaptability and potential for recovery.
- Government support for economic diversification enhances the market's growth prospects.
- Ongoing advancements in production technologies are expected to optimize manufacturing processes.
Evaluation of Restraints in Qatar Anhydrides Market
Despite its growth trajectory, the Qatar anhydrides market faces several challenges. Fluctuating raw material prices in a volatile global chemical landscape can significantly impact production costs and profitability. Furthermore, navigating stringent environmental regulations requires companies to invest in sustainable practices and technologies, which can strain resources. These factors contribute to the cautious optimism surrounding the market, necessitating strategic planning from industry players to mitigate risks.
Qatar Anhydrides Market Trends
Emerging trends in the Qatar anhydrides market reflect a growing emphasis on sustainability and technological innovation. Manufacturers are increasingly focusing on eco-friendly production methods and the development of bio-based anhydrides to address environmental concerns. Additionally, digitalization and automation in manufacturing processes are enhancing efficiency and reducing operational costs, enabling quicker response times to market demands.
Qatar Anhydrides Market Opportunities
The anhydrides market in Qatar presents numerous opportunities for investment and growth. The ongoing infrastructure projects coupled with Qatar's economic diversification efforts indicate a strong demand for anhydrides in various applications, particularly in the construction and automotive sectors. Companies that can leverage advanced technologies and sustainable practices stand to benefit significantly from this evolving landscape.
Government Initiatives in the Qatar Anhydrides Market
The Qatari government is actively promoting initiatives aimed at boosting the manufacturing sector, including incentives for research and development in the chemical industry. Public spending on infrastructure projects, as part of the National Vision 2030, further supports the growth of the anhydrides market. These policies are designed to attract foreign investment and encourage local production, fostering a conducive environment for market expansion.
Future Insights of the Qatar Anhydrides Market
Looking ahead to the period from 2026 to 2032, the Qatar anhydrides market is set to experience dynamic growth driven by sustained demand across multiple sectors. The combination of infrastructural growth, an expanding manufacturing base, and government initiatives aimed at economic diversification will continue to bolster the market. As companies adapt to evolving consumer preferences and regulatory landscapes, the emphasis on sustainable practices will likely reshape competitive dynamics within the sector.
Qatar Anhydrides Market Latest Developments (May 2025 - June 2026)
In the recent months leading up to mid-2026, the Qatar anhydrides market has seen a renewed focus on enhancing production capabilities to meet the growing demand. Industry players are exploring partnerships and collaborations aimed at innovative product development and sustainable manufacturing processes. Moreover, there has been an increased emphasis on integrating digital technologies to streamline operations, thereby improving efficiency and reducing costs.
Qatar Anhydrides Market - Key Attractiveness of the Report
- 10 Years of Market Numbers
- Historical Data Starting from 2022 to 2025
- Base Year: 2025
- Forecast Data until 2032
- Key Performance Indicators Impacting the Market
- Major Upcoming Developments and Projects
Key Highlights of the Report:
- Qatar Anhydrides? Market Outlook
- Market Size of Qatar Anhydrides? Market, 2025
- Forecast of Qatar Anhydrides? Market, 2032
- Historical Data and Forecast of Qatar Anhydrides? Revenues & Volume for the Period 2022-2032F
- Qatar Anhydrides? Market Trend Evolution
- Qatar Anhydrides? Market Drivers and Challenges
- Qatar Anhydrides? Price Trends
- Qatar Anhydrides? Porter's Five Forces
- Qatar Anhydrides? Industry Life Cycle
- Historical Data and Forecast of Qatar Anhydrides? Market Revenues & Volume By Composition for the Period 2022-2032F
- Historical Data and Forecast of Qatar Anhydrides? Market Revenues & Volume By Inorganic for the Period 2022-2032F
- Historical Data and Forecast of Qatar Anhydrides? Market Revenues & Volume By Organic for the Period 2022-2032F
- Historical Data and Forecast of Qatar Anhydrides? Market Revenues & Volume By Types for the Period 2022-2032F
- Historical Data and Forecast of Qatar Anhydrides? Market Revenues & Volume By Acetic Anhydride for the Period 2022-2032F
- Historical Data and Forecast of Qatar Anhydrides? Market Revenues & Volume By Maleic Anhydride for the Period 2022-2032F
- Historical Data and Forecast of Qatar Anhydrides? Market Revenues & Volume By Isobutyric Anhydride for the Period 2022-2032F
- Historical Data and Forecast of Qatar Anhydrides? Market Revenues & Volume By Propionic Anhydride for the Period 2022-2032F
- Historical Data and Forecast of Qatar Anhydrides? Market Revenues & Volume By Phthalic Anhydride for the Period 2022-2032F
- Historical Data and Forecast of Qatar Anhydrides? Market Revenues & Volume By Isatoic Acid Anhydride for the Period 2022-2032F
- Historical Data and Forecast of Qatar Anhydrides? Market Revenues & Volume By Others for the Period 2022-2032F
- Historical Data and Forecast of Qatar Anhydrides? Market Revenues & Volume By Application for the Period 2022-2032F
- Historical Data and Forecast of Qatar Anhydrides? Market Revenues & Volume By Pesticides for the Period 2022-2032F
- Historical Data and Forecast of Qatar Anhydrides? Market Revenues & Volume By Plasticizers for the Period 2022-2032F
- Historical Data and Forecast of Qatar Anhydrides? Market Revenues & Volume By Dyes & Pigments for the Period 2022-2032F
- Historical Data and Forecast of Qatar Anhydrides? Market Revenues & Volume By Additives for the Period 2022-2032F
- Historical Data and Forecast of Qatar Anhydrides? Market Revenues & Volume By Flavors for the Period 2022-2032F
- Historical Data and Forecast of Qatar Anhydrides? Market Revenues & Volume By Others for the Period 2022-2032F
- Historical Data and Forecast of Qatar Anhydrides? Market Revenues & Volume By End-Use Industry for the Period 2022-2032F
- Historical Data and Forecast of Qatar Anhydrides? Market Revenues & Volume By Construction for the Period 2022-2032F
- Historical Data and Forecast of Qatar Anhydrides? Market Revenues & Volume By Pharmaceuticals for the Period 2022-2032F
- Historical Data and Forecast of Qatar Anhydrides? Market Revenues & Volume By Automotive for the Period 2022-2032F
- Historical Data and Forecast of Qatar Anhydrides? Market Revenues & Volume By Agrochemicals for the Period 2022-2032F
- Historical Data and Forecast of Qatar Anhydrides? Market Revenues & Volume By Textiles for the Period 2022-2032F
- Historical Data and Forecast of Qatar Anhydrides? Market Revenues & Volume By Food & Beverages for the Period 2022-2032F
- Historical Data and Forecast of Qatar Anhydrides? Market Revenues & Volume By Others for the Period 2022-2032F
- Qatar Anhydrides? Import Export Trade Statistics
- Market Opportunity Assessment By Composition
- Market Opportunity Assessment By Types
- Market Opportunity Assessment By Application
- Market Opportunity Assessment By End-Use Industry
- Qatar Anhydrides? Top Companies Market Share
- Qatar Anhydrides? Competitive Benchmarking By Technical and Operational Parameters
- Qatar Anhydrides? Company Profiles
- Qatar Anhydrides? Key Strategic Recommendations
Qatar Anhydrides Market - Frequently Asked Questions
The robust growth in the Qatar anhydrides market is driven primarily by the construction sector's rapid expansion, the increasing demand for high-performance materials, and government investments in infrastructure projects.
The pandemic disrupted supply chains and reduced overall economic activity, but the market demonstrated resilience, quickly adapting to new challenges and stabilizing as various sectors recovered.
The Qatar Anhydrides Market was estimated at USD 202 Million in 2025 and is projected to reach USD 276 Million by 2032, growing at a CAGR of 4.6% from 2026 to 2032.
Anhydrides are extensively utilized in construction materials, adhesives, coatings, and pharmaceuticals, making these sectors crucial for market demand in Qatar.
Manufacturers encounter challenges such as fluctuating raw material prices, stringent environmental regulations, and the need for sustainable practices, which require strategic adaptation to maintain profitability.
6Wresearch actively monitors the Qatar Anhydrides Market and publishes its comprehensive annual report, highlighting emerging trends, growth drivers, revenue analysis, and forecast outlook. Our insights help businesses to make data-backed strategic decisions with ongoing market dynamics. Our analysts track relevent industries related to the Qatar Anhydrides Market, allowing our clients with actionable intelligence and reliable forecasts tailored to emerging regional needs.
Yes, we provide customisation as per your requirements. To learn more, feel free to contact us on sales@6wresearch.com
1 Executive Summary |
2 Introduction |
2.1 Key Highlights of the Report |
2.2 Report Description |
2.3 Market Scope & Segmentation |
2.4 Research Methodology |
2.5 Assumptions |
3 Qatar Anhydrides Market Overview |
3.1 Qatar Country Macro Economic Indicators |
3.2 Qatar Anhydrides Market Revenues & Volume, 2022 & 2032F |
3.3 Qatar Anhydrides Market - Industry Life Cycle |
3.4 Qatar Anhydrides Market - Porter's Five Forces |
3.5 Qatar Anhydrides Market Revenues & Volume Share, By Composition, 2022 & 2032F |
3.6 Qatar Anhydrides Market Revenues & Volume Share, By Types, 2022 & 2032F |
3.7 Qatar Anhydrides Market Revenues & Volume Share, By Application, 2022 & 2032F |
3.8 Qatar Anhydrides Market Revenues & Volume Share, By End-Use Industry, 2022 & 2032F |
4 Qatar Anhydrides Market Dynamics |
4.1 Impact Analysis |
4.2 Market Drivers |
4.3 Market Restraints |
5 Qatar Anhydrides Market Trends |
6 Qatar Anhydrides Market, By Types |
6.1 Qatar Anhydrides Market, By Composition |
6.1.1 Overview and Analysis |
6.1.2 Qatar Anhydrides Market Revenues & Volume, By Composition, 2022-2032F |
6.1.3 Qatar Anhydrides Market Revenues & Volume, By Inorganic, 2022-2032F |
6.1.4 Qatar Anhydrides Market Revenues & Volume, By Organic, 2022-2032F |
6.2 Qatar Anhydrides Market, By Types |
6.2.1 Overview and Analysis |
6.2.2 Qatar Anhydrides Market Revenues & Volume, By Acetic Anhydride, 2022-2032F |
6.2.3 Qatar Anhydrides Market Revenues & Volume, By Maleic Anhydride, 2022-2032F |
6.2.4 Qatar Anhydrides Market Revenues & Volume, By Isobutyric Anhydride, 2022-2032F |
6.2.5 Qatar Anhydrides Market Revenues & Volume, By Propionic Anhydride, 2022-2032F |
6.2.6 Qatar Anhydrides Market Revenues & Volume, By Phthalic Anhydride, 2022-2032F |
6.2.7 Qatar Anhydrides Market Revenues & Volume, By Isatoic Acid Anhydride, 2022-2032F |
6.3 Qatar Anhydrides Market, By Application |
6.3.1 Overview and Analysis |
6.3.2 Qatar Anhydrides Market Revenues & Volume, By Pesticides, 2022-2032F |
6.3.3 Qatar Anhydrides Market Revenues & Volume, By Plasticizers, 2022-2032F |
6.3.4 Qatar Anhydrides Market Revenues & Volume, By Dyes & Pigments, 2022-2032F |
6.3.5 Qatar Anhydrides Market Revenues & Volume, By Additives, 2022-2032F |
6.3.6 Qatar Anhydrides Market Revenues & Volume, By Flavors, 2022-2032F |
6.3.7 Qatar Anhydrides Market Revenues & Volume, By Others, 2022-2032F |
6.4 Qatar Anhydrides Market, By End-Use Industry |
6.4.1 Overview and Analysis |
6.4.2 Qatar Anhydrides Market Revenues & Volume, By Construction, 2022-2032F |
6.4.3 Qatar Anhydrides Market Revenues & Volume, By Pharmaceuticals, 2022-2032F |
6.4.4 Qatar Anhydrides Market Revenues & Volume, By Automotive, 2022-2032F |
6.4.5 Qatar Anhydrides Market Revenues & Volume, By Agrochemicals, 2022-2032F |
6.4.6 Qatar Anhydrides Market Revenues & Volume, By Textiles, 2022-2032F |
6.4.7 Qatar Anhydrides Market Revenues & Volume, By Food & Beverages, 2022-2032F |
7 Qatar Anhydrides Market Import-Export Trade Statistics |
7.1 Qatar Anhydrides Market Export to Major Countries |
7.2 Qatar Anhydrides Market Imports from Major Countries |
8 Qatar Anhydrides Market Key Performance Indicators |
9 Qatar Anhydrides Market - Opportunity Assessment |
9.1 Qatar Anhydrides Market Opportunity Assessment, By Composition, 2022 & 2032F |
9.2 Qatar Anhydrides Market Opportunity Assessment, By Types, 2022 & 2032F |
9.3 Qatar Anhydrides Market Opportunity Assessment, By Application, 2022 & 2032F |
9.4 Qatar Anhydrides Market Opportunity Assessment, By End-Use Industry, 2022 & 2032F |
10 Qatar Anhydrides Market - Competitive Landscape |
10.1 Qatar Anhydrides Market Revenue Share, By Companies, 2025 |
10.2 Qatar Anhydrides Market Competitive Benchmarking, By Operating and Technical Parameters |
11 Company Profiles |
12 Recommendations |
13 Disclaimer |
Global Go To Market Strategy - 2030
Export potential enables firms to identify high-growth global markets with greater confidence by combining advanced trade intelligence with a structured quantitative methodology. The framework analyzes emerging demand trends and country-level import patterns while integrating macroeconomic and trade datasets such as GDP and population forecasts, bilateral import–export flows, tariff structures, elasticity differentials between developed and developing economies, geographic distance, and import demand projections. Using weighted trade values from 2020–2024 as the base period to project country-to-country export potential for 2030, these inputs are operationalized through calculated drivers such as gravity model parameters, tariff impact factors, and projected GDP per-capita growth. Through an analysis of hidden potentials, demand hotspots, and market conditions that are most favorable to success, this method enables firms to focus on target countries, maximize returns, and global expansion with data, backed by accuracy.
By factoring in the projected importer demand gap that is currently unmet and could be potential opportunity, it identifies the potential for the Exporter (Country) among 190 countries, against the general trade analysis, which identifies the biggest importer or exporter.
To discover high-growth global markets and optimize your business strategy:
Click Here
Pricing
- Single User License$ 1,995
- Department License$ 2,400
- Site License$ 3,120
- Global License$ 3,795

Leadership Perspectives from Industry Events
Search
Thought Leadership and Analyst Meet


Our Clients
6WResearch In News
- India Air Conditioner Market Set for Strong Rebound in 2026 After Weather-Led Correction and GST-Driven Recovery: 6Wresearch
- ADAS in India: How Automatic Emergency Braking, Blind Spot Detection & Driver Monitoring are Transforming Road Safety
- Doha a strategic location for EV manufacturing hub: IPA Qatar
- Demand for luxury TVs surging in the GCC, says Samsung
- Empowering Growth: The Thriving Journey of Bangladesh’s Cable Industry
- Demand for luxury TVs surging in the GCC, says Samsung
Latest Reports
- Poland Fire Protection Systems Market (2026-2032)
- Cape Verde Portable Hand-Thrown Extinguisher Market (2026-2032)
- Canada Portable Hand-Thrown Extinguisher Market (2026-2032)
- Cameroon Portable Hand-Thrown Extinguisher Market (2026-2032)
- Burundi Portable Hand-Thrown Extinguisher Market (2026-2032)
- Burkina Faso Portable Hand-Thrown Extinguisher Market (2026-2032)
- Bulgaria Portable Hand-Thrown Extinguisher Market (2026-2032)
- Brunei Portable Hand-Thrown Extinguisher Market (2026-2032)
- Botswana Portable Hand-Thrown Extinguisher Market (2026-2032)
- Bosnia and Herzegovina Portable Hand-Thrown Extinguisher Market (2026-2032)
Industry Events and Analyst Meet

HIMTEX 2026

India Refining Summit 2026

India EV Show 2026

EV tech India Expo 2026

Auto Tech Asia 2026
Whitepaper
- Middle East & Africa Commercial Security Market Click here to view more.
- Middle East & Africa Fire Safety Systems & Equipment Market Click here to view more.
- GCC Drone Market Click here to view more.
- Middle East Lighting Fixture Market Click here to view more.
- GCC Physical & Perimeter Security Market Click here to view more.