Qatar Clay Refractories Market (2026-2032) | Outlook, Analysis, Companies, Revenue, Value, Trends, Size, Forecast, Industry, Growth & Share
Market Forecast By Form (Bricks, Monolithic, Others), By Application (Construction, Steel Making, Cosmetics, Food Industry) And Competitive Landscape
| Product Code: ETC027721 | Publication Date: Jul 2023 | Updated Date: Jun 2026 | Product Type: Report | |
| Publisher: 6Wresearch | Author: Ravi Bhandari | No. of Pages: 70 | No. of Figures: 35 | No. of Tables: 5 |
Qatar Clay Refractories Market Summary
The qatar clay refractories market was estimated at USD 460 Million in 2025 and is projected to reach USD 647 Million by 2032, growing at a CAGR of 5.6% from 2026 to 2032.
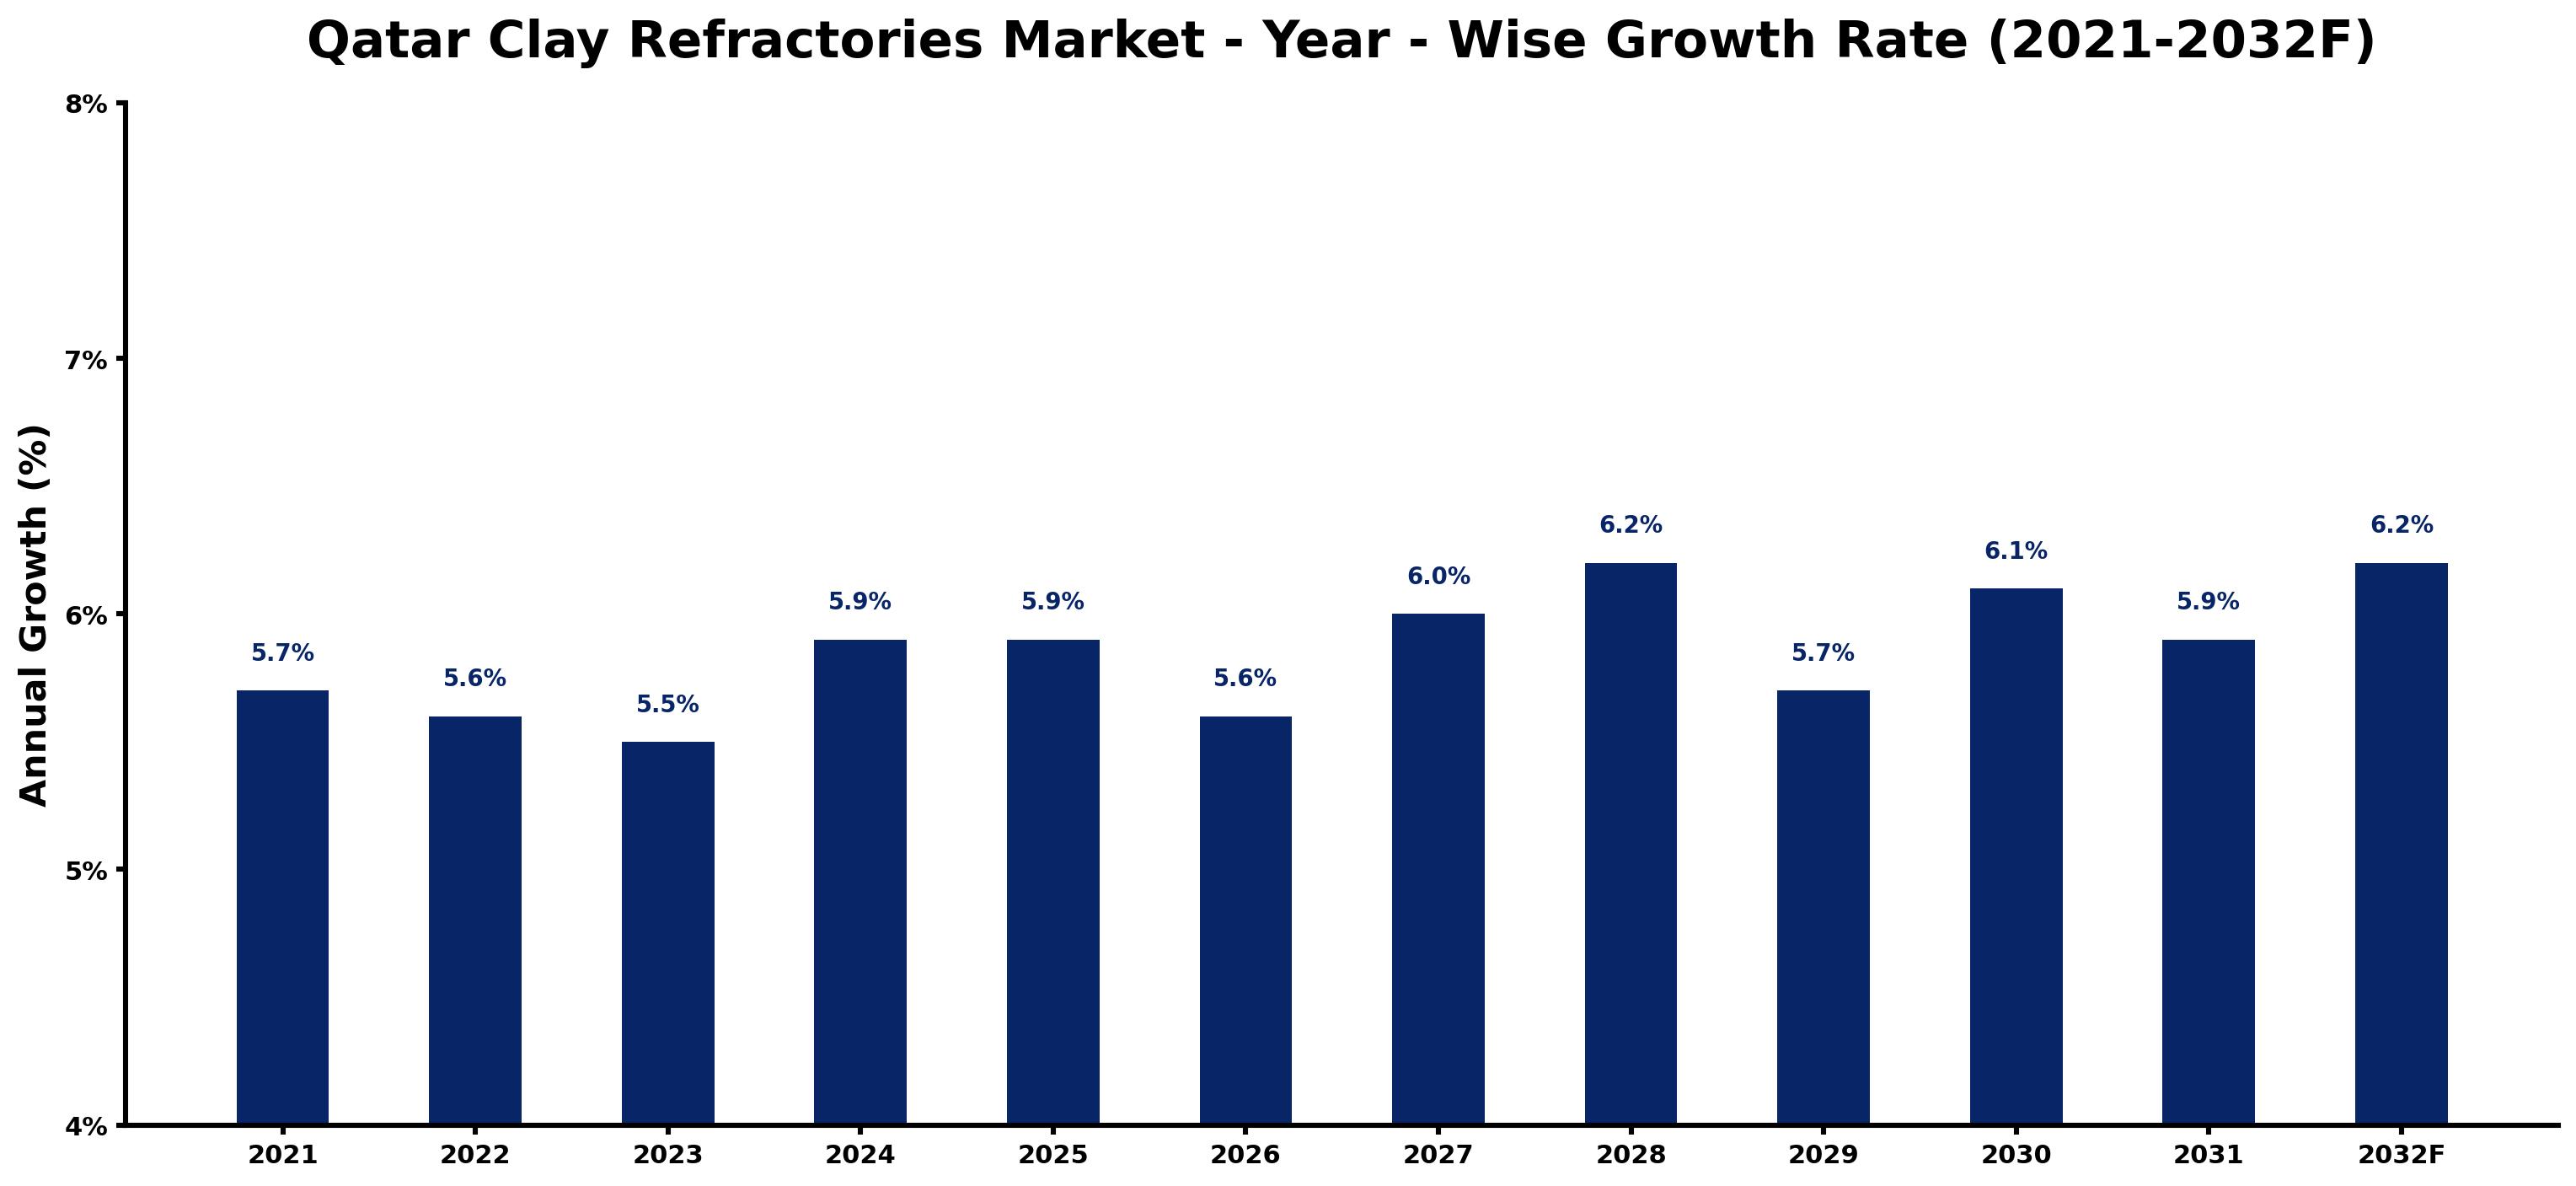
Qatar Clay Refractories Market Growth Rate Analysis (2021-2032)
The Qatar Clay Refractories market has exhibited stable growth trends, with year-on-year increases of 5.7% in 2021 and tapering slightly to 5.5% in 2023 before rebounding to 5.9% in 2024 and 2025. This moderate fluctuation can largely be attributed to rising demand driven by expanding industrial sectors, particularly in energy and construction. As the country invests heavily in infrastructure and navigates an energy transition, the need for high-quality refractories remains crucial. By 2028, growth is projected to reach 6.2%, fueled by enhanced technological advancements in manufacturing processes and sustained consumer demand, reflecting an ongoing commitment to modernization and efficiency.
Qatar Clay Refractories Market Year-wise Growth Rate and Key Drivers
This graph highlights how the Qatar Clay Refractories Market has steadily grown over the past five years, supported by major growth factors.
The table below presents the year wise growth rates along with the key drivers influencing the market
| Year | Growth Rate | Major Drivers |
| 2021 | 5.7% | Construction projects in Qatar fueled demand for durable and high-performance refractories. |
| 2022 | 5.6% | Energy sector investments shifted attention towards advanced refractory materials for efficiency. |
| 2023 | 5.5% | The cement industry sought local refractory solutions to minimize import dependencies. |
| 2024 | 5.9% | Expansion of the Qatar National Vision 2030 spurred infrastructure developments requiring quality refractories. |
| 2025 | 5.9% | Local manufacturing initiatives aimed to enhance the availability of refractory products competitively. |
| 2026 | 5.6% | A robust pipeline of LNG projects required specialized refractories for high-temperature applications. |
| 2027 | 6.0% | Collaboration between industries improved supply chain dynamics, increasing refractory material accessibility. |
| 2028 | 6.2% | Technological innovations in refractories addressed extreme climate challenges unique to the region. |
| 2029 | 5.7% | Sustainability trends encouraged the development of eco-friendly refractory alternatives in construction. |
| 2030 | 6.1% | GCC integration and joint ventures accelerated the regional market landscape for clay refractories. |
| 2031 | 5.9% | Focus on local talent development fostered expertise in refractory material applications and usage. |
| 2032 | 6.2% | Increased exports of advanced refractories positioned Qatar as a competitive market player. |
Note - Market size estimations and growth projections presented in this report are based on 6Wresearch's advanced forecasting approach, validated with industry datasets as of June 2026.
Qatar Clay Refractories Market Synopsis
The Qatar Clay Refractories Market is projected to reach 5.6% and witness significant growth during the forecast period (2026-2032). The market is anticipated to register a compound annual growth rate (CAGR) of over 3%, driven by various factors including advancements in technology and increased investments in vital industrial sectors like oil and gas. The growing demand for non-metallic minerals and the application of innovative refractory solutions will further contribute to the positive outlook of the market.
Qatar Clay Refractories Market Growth Drivers
The growth of the Qatar clay refractories market can be attributed to several key drivers:
- Technological advancements in refractory materials, which include the development of special castables and refractory cements, have expanded the capabilities and applications of clay refractories.
- Investment in the oil and gas sector has surged, creating a robust demand for materials that can withstand high temperatures and corrosive environments, which is a primary use for clay refractories.
- Increased industrial activities in the construction and manufacturing sectors have resulted in higher consumption of raw materials such as cement and bauxite, thus bolstering the demand for clay refractories.
- The introduction of advanced formulations like abrasion-resistant castables has allowed for improved performance, appealing to industries that require extra durability and longevity.
- Rising awareness of the benefits of using refractory materials in energy-efficient processes encourages industries to adopt clay refractories, driving market growth.
Qatar Clay Refractories Market Challenges and Restraints
Despite the promising growth trajectory, the Qatar clay refractories market faces several challenges:
- The cost of raw materials such as alumina powder and silica sand, which account for a significant portion (50% - 60%) of the total manufacturing costs, has been subject to fluctuation, impacting profit margins for manufacturers.
- Stringent regulations regarding environmental safety impose additional operational costs and necessitate compliance measures that can strain resources.
- Post-COVID-19 recovery phases have revealed vulnerabilities within supply chains, affecting the availability of essential materials required for production.
- Intense competition from alternative refractory materials may limit market share growth for clay refractories, urging manufacturers to innovate and differentiate their offerings.
- Economic variabilities and geopolitical tensions in the region may pose risks that could affect investment and operational stability within the sector.
Qatar Clay Refractories Market Government Investment and Initiatives
The government of Qatar has implemented several initiatives aimed at fostering growth within the clay refractories market. Investments in industrial infrastructure, particularly within the oil and gas sectors, have been a focal point of public spending. Various development plans emphasize sustainability and the use of energy-efficient materials which are critical for modern manufacturing. Incentives for businesses adopting innovative technologies in refractory production are also being promoted. Furthermore, public-private partnerships are increasingly encouraged, aligning with Qatar's broader economic diversification strategy.
Qatar Clay Refractories Market Latest Developments (May 2025 - June 2026)
Recent months have witnessed a surge in activities surrounding the Qatar clay refractories market. Trends indicate a focus on sustainability and environmental compliance, with manufacturers investing in eco-friendly refractory solutions. A shift towards automation and digitization in production processes has been noted, aiming to enhance efficiency and reduce costs. Additionally, the increasing collaboration between research institutions and the industry is fostering innovation, particularly in the realm of advanced materials. Regulatory changes are also anticipated that may further impact operational frameworks within the sector.
Qatar Clay Refractories Market - Key Attractiveness of the Report
- 10 Years of Market Numbers
- Historical Data Starting from 2022 to 2025
- Base Year: 2025
- Forecast Data until 2032
- Key Performance Indicators Impacting the Market
- Major Upcoming Developments and Projects
Key Highlights of the Report:
- Qatar Clay Refractories Market Outlook
- Market Size of Qatar Clay Refractories Market, 2025
- Forecast of Qatar Clay Refractories Market, 2032
- Historical Data and Forecast of Qatar Clay Refractories Revenues & Volume for the Period 2022-2032F
- Qatar Clay Refractories Market Trend Evolution
- Qatar Clay Refractories Market Drivers and Challenges
- Qatar Clay Refractories Price Trends
- Qatar Clay Refractories Porter's Five Forces
- Qatar Clay Refractories Industry Life Cycle
- Historical Data and Forecast of Qatar Clay Refractories Market Revenues & Volume By Form for the Period 2022-2032F
- Historical Data and Forecast of Qatar Clay Refractories Market Revenues & Volume By Bricks for the Period 2022-2032F
- Historical Data and Forecast of Qatar Clay Refractories Market Revenues & Volume By Monolithic for the Period 2022-2032F
- Historical Data and Forecast of Qatar Clay Refractories Market Revenues & Volume By Others for the Period 2022-2032F
- Historical Data and Forecast of Qatar Clay Refractories Market Revenues & Volume By Application for the Period 2022-2032F
- Historical Data and Forecast of Qatar Clay Refractories Market Revenues & Volume By Construction for the Period 2022-2032F
- Historical Data and Forecast of Qatar Clay Refractories Market Revenues & Volume By Steel Making for the Period 2022-2032F
- Historical Data and Forecast of Qatar Clay Refractories Market Revenues & Volume By Cosmetics for the Period 2022-2032F
- Historical Data and Forecast of Qatar Clay Refractories Market Revenues & Volume By Food Industry for the Period 2022-2032F
- Qatar Clay Refractories Import Export Trade Statistics
- Market Opportunity Assessment By Form
- Market Opportunity Assessment By Application
- Qatar Clay Refractories Top Companies Market Share
- Qatar Clay Refractories Competitive Benchmarking By Technical and Operational Parameters
- Qatar Clay Refractories Company Profiles
- Qatar Clay Refractories Key Strategic Recommendations
Frequently Asked Questions About the Market Study (FAQs):
Key factors include investments in the oil and gas sector, advancements in refractory technology, and rising demand from various industrial applications.
Innovations such as abrasion-resistant castables enhance mechanical strength and thermal performance, thus encouraging broader adoption across industries.
Key challenges include fluctuating raw material costs, stringent environmental regulations, and supply chain disruptions exacerbated by global events.
Government policies aimed at industrial growth and sustainability significantly influence market dynamics, providing incentives for innovation and infrastructure development.
6Wresearch actively monitors the Qatar Clay Refractories Market and publishes its comprehensive annual report, highlighting emerging trends, growth drivers, revenue analysis, and forecast outlook. Our insights help businesses to make data-backed strategic decisions with ongoing market dynamics. Our analysts track relevent industries related to the Qatar Clay Refractories Market, allowing our clients with actionable intelligence and reliable forecasts tailored to emerging regional needs.
Yes, we provide customisation as per your requirements. To learn more, feel free to contact us on sales@6wresearch.com
1 Executive Summary |
2 Introduction |
2.1 Key Highlights of the Report |
2.2 Report Description |
2.3 Market Scope & Segmentation |
2.4 Research Methodology |
2.5 Assumptions |
3 Qatar Clay Refractories Market Overview |
3.1 Qatar Country Macro Economic Indicators |
3.2 Qatar Clay Refractories Market Revenues & Volume, 2022 & 2032F |
3.3 Qatar Clay Refractories Market - Industry Life Cycle |
3.4 Qatar Clay Refractories Market - Porter's Five Forces |
3.5 Qatar Clay Refractories Market Revenues & Volume Share, By Form, 2022 & 2032F |
3.6 Qatar Clay Refractories Market Revenues & Volume Share, By Application, 2022 & 2032F |
4 Qatar Clay Refractories Market Dynamics |
4.1 Impact Analysis |
4.2 Market Drivers |
4.3 Market Restraints |
5 Qatar Clay Refractories Market Trends |
6 Qatar Clay Refractories Market, By Types |
6.1 Qatar Clay Refractories Market, By Form |
6.1.1 Overview and Analysis |
6.1.2 Qatar Clay Refractories Market Revenues & Volume, By Form, 2022-2032F |
6.1.3 Qatar Clay Refractories Market Revenues & Volume, By Bricks, 2022-2032F |
6.1.4 Qatar Clay Refractories Market Revenues & Volume, By Monolithic, 2022-2032F |
6.1.5 Qatar Clay Refractories Market Revenues & Volume, By Others, 2022-2032F |
6.2 Qatar Clay Refractories Market, By Application |
6.2.1 Overview and Analysis |
6.2.2 Qatar Clay Refractories Market Revenues & Volume, By Construction, 2022-2032F |
6.2.3 Qatar Clay Refractories Market Revenues & Volume, By Steel Making, 2022-2032F |
6.2.4 Qatar Clay Refractories Market Revenues & Volume, By Cosmetics, 2022-2032F |
6.2.5 Qatar Clay Refractories Market Revenues & Volume, By Food Industry, 2022-2032F |
7 Qatar Clay Refractories Market Import-Export Trade Statistics |
7.1 Qatar Clay Refractories Market Export to Major Countries |
7.2 Qatar Clay Refractories Market Imports from Major Countries |
8 Qatar Clay Refractories Market Key Performance Indicators |
9 Qatar Clay Refractories Market - Opportunity Assessment |
9.1 Qatar Clay Refractories Market Opportunity Assessment, By Form, 2022 & 2032F |
9.2 Qatar Clay Refractories Market Opportunity Assessment, By Application, 2022 & 2032F |
10 Qatar Clay Refractories Market - Competitive Landscape |
10.1 Qatar Clay Refractories Market Revenue Share, By Companies, 2025 |
10.2 Qatar Clay Refractories Market Competitive Benchmarking, By Operating and Technical Parameters |
11 Company Profiles |
12 Recommendations |
13 Disclaimer |
Global Go To Market Strategy - 2030
Export potential enables firms to identify high-growth global markets with greater confidence by combining advanced trade intelligence with a structured quantitative methodology. The framework analyzes emerging demand trends and country-level import patterns while integrating macroeconomic and trade datasets such as GDP and population forecasts, bilateral import–export flows, tariff structures, elasticity differentials between developed and developing economies, geographic distance, and import demand projections. Using weighted trade values from 2020–2024 as the base period to project country-to-country export potential for 2030, these inputs are operationalized through calculated drivers such as gravity model parameters, tariff impact factors, and projected GDP per-capita growth. Through an analysis of hidden potentials, demand hotspots, and market conditions that are most favorable to success, this method enables firms to focus on target countries, maximize returns, and global expansion with data, backed by accuracy.
By factoring in the projected importer demand gap that is currently unmet and could be potential opportunity, it identifies the potential for the Exporter (Country) among 190 countries, against the general trade analysis, which identifies the biggest importer or exporter.
To discover high-growth global markets and optimize your business strategy:
Click Here
Pricing
- Single User License$ 1,995
- Department License$ 2,400
- Site License$ 3,120
- Global License$ 3,795

Leadership Perspectives from Industry Events
Search
Thought Leadership and Analyst Meet


Our Clients
6WResearch In News
- India Air Conditioner Market Set for Strong Rebound in 2026 After Weather-Led Correction and GST-Driven Recovery: 6Wresearch
- ADAS in India: How Automatic Emergency Braking, Blind Spot Detection & Driver Monitoring are Transforming Road Safety
- Doha a strategic location for EV manufacturing hub: IPA Qatar
- Demand for luxury TVs surging in the GCC, says Samsung
- Empowering Growth: The Thriving Journey of Bangladesh’s Cable Industry
- Demand for luxury TVs surging in the GCC, says Samsung
Latest Reports
- Poland Fire Protection Systems Market (2026-2032)
- Cape Verde Portable Hand-Thrown Extinguisher Market (2026-2032)
- Canada Portable Hand-Thrown Extinguisher Market (2026-2032)
- Cameroon Portable Hand-Thrown Extinguisher Market (2026-2032)
- Burundi Portable Hand-Thrown Extinguisher Market (2026-2032)
- Burkina Faso Portable Hand-Thrown Extinguisher Market (2026-2032)
- Bulgaria Portable Hand-Thrown Extinguisher Market (2026-2032)
- Brunei Portable Hand-Thrown Extinguisher Market (2026-2032)
- Botswana Portable Hand-Thrown Extinguisher Market (2026-2032)
- Bosnia and Herzegovina Portable Hand-Thrown Extinguisher Market (2026-2032)
Industry Events and Analyst Meet

HIMTEX 2026

India Refining Summit 2026

India EV Show 2026

EV tech India Expo 2026

Auto Tech Asia 2026
Whitepaper
- Middle East & Africa Commercial Security Market Click here to view more.
- Middle East & Africa Fire Safety Systems & Equipment Market Click here to view more.
- GCC Drone Market Click here to view more.
- Middle East Lighting Fixture Market Click here to view more.
- GCC Physical & Perimeter Security Market Click here to view more.