Qatar Drive Shaft Market (2026-2032) | Value, Outlook, Size, Companies, Growth, Trends, Analysis, Industry, Share, Revenue & Forecast
Market Forecast By Shaft Type (Torque Tube Drive Shaft, Flexible Drive Shaft, Hotchkiss Drive Shaft), By Material Types (Steel, Aluminum, Other), By Design Type (Hollow Drive Shafts, Solid Drive Shafts), By Position (Rear Wheel Drive Shaft, Front Wheel Drive Shaft), By Vehicle Type (Light Commercial Vehicle, Passenger Cars, Heavy Commercial Vehicles) And Competitive Landscape
| Product Code: ETC046941 | Publication Date: Jul 2023 | Updated Date: Jun 2026 | Product Type: Report | |
| Publisher: 6Wresearch | Author: Ravi Bhandari | No. of Pages: 70 | No. of Figures: 35 | No. of Tables: 5 |
Qatar Drive Shaft Market Size, Share & Growth Rate
The Qatar Drive Shaft Market was estimated at USD 371 Million in 2025 and is projected to reach USD 495 Million by 2032, growing at a CAGR of 4.2% from 2026 to 2032. This impressive growth trajectory is primarily fueled by the burgeoning automotive sector and the country's ambitious infrastructure development projects. A rising disposable income among the populace and increasing urbanization are notably intensifying the demand for various types of vehicles, thereby propelling the market for drive shafts.
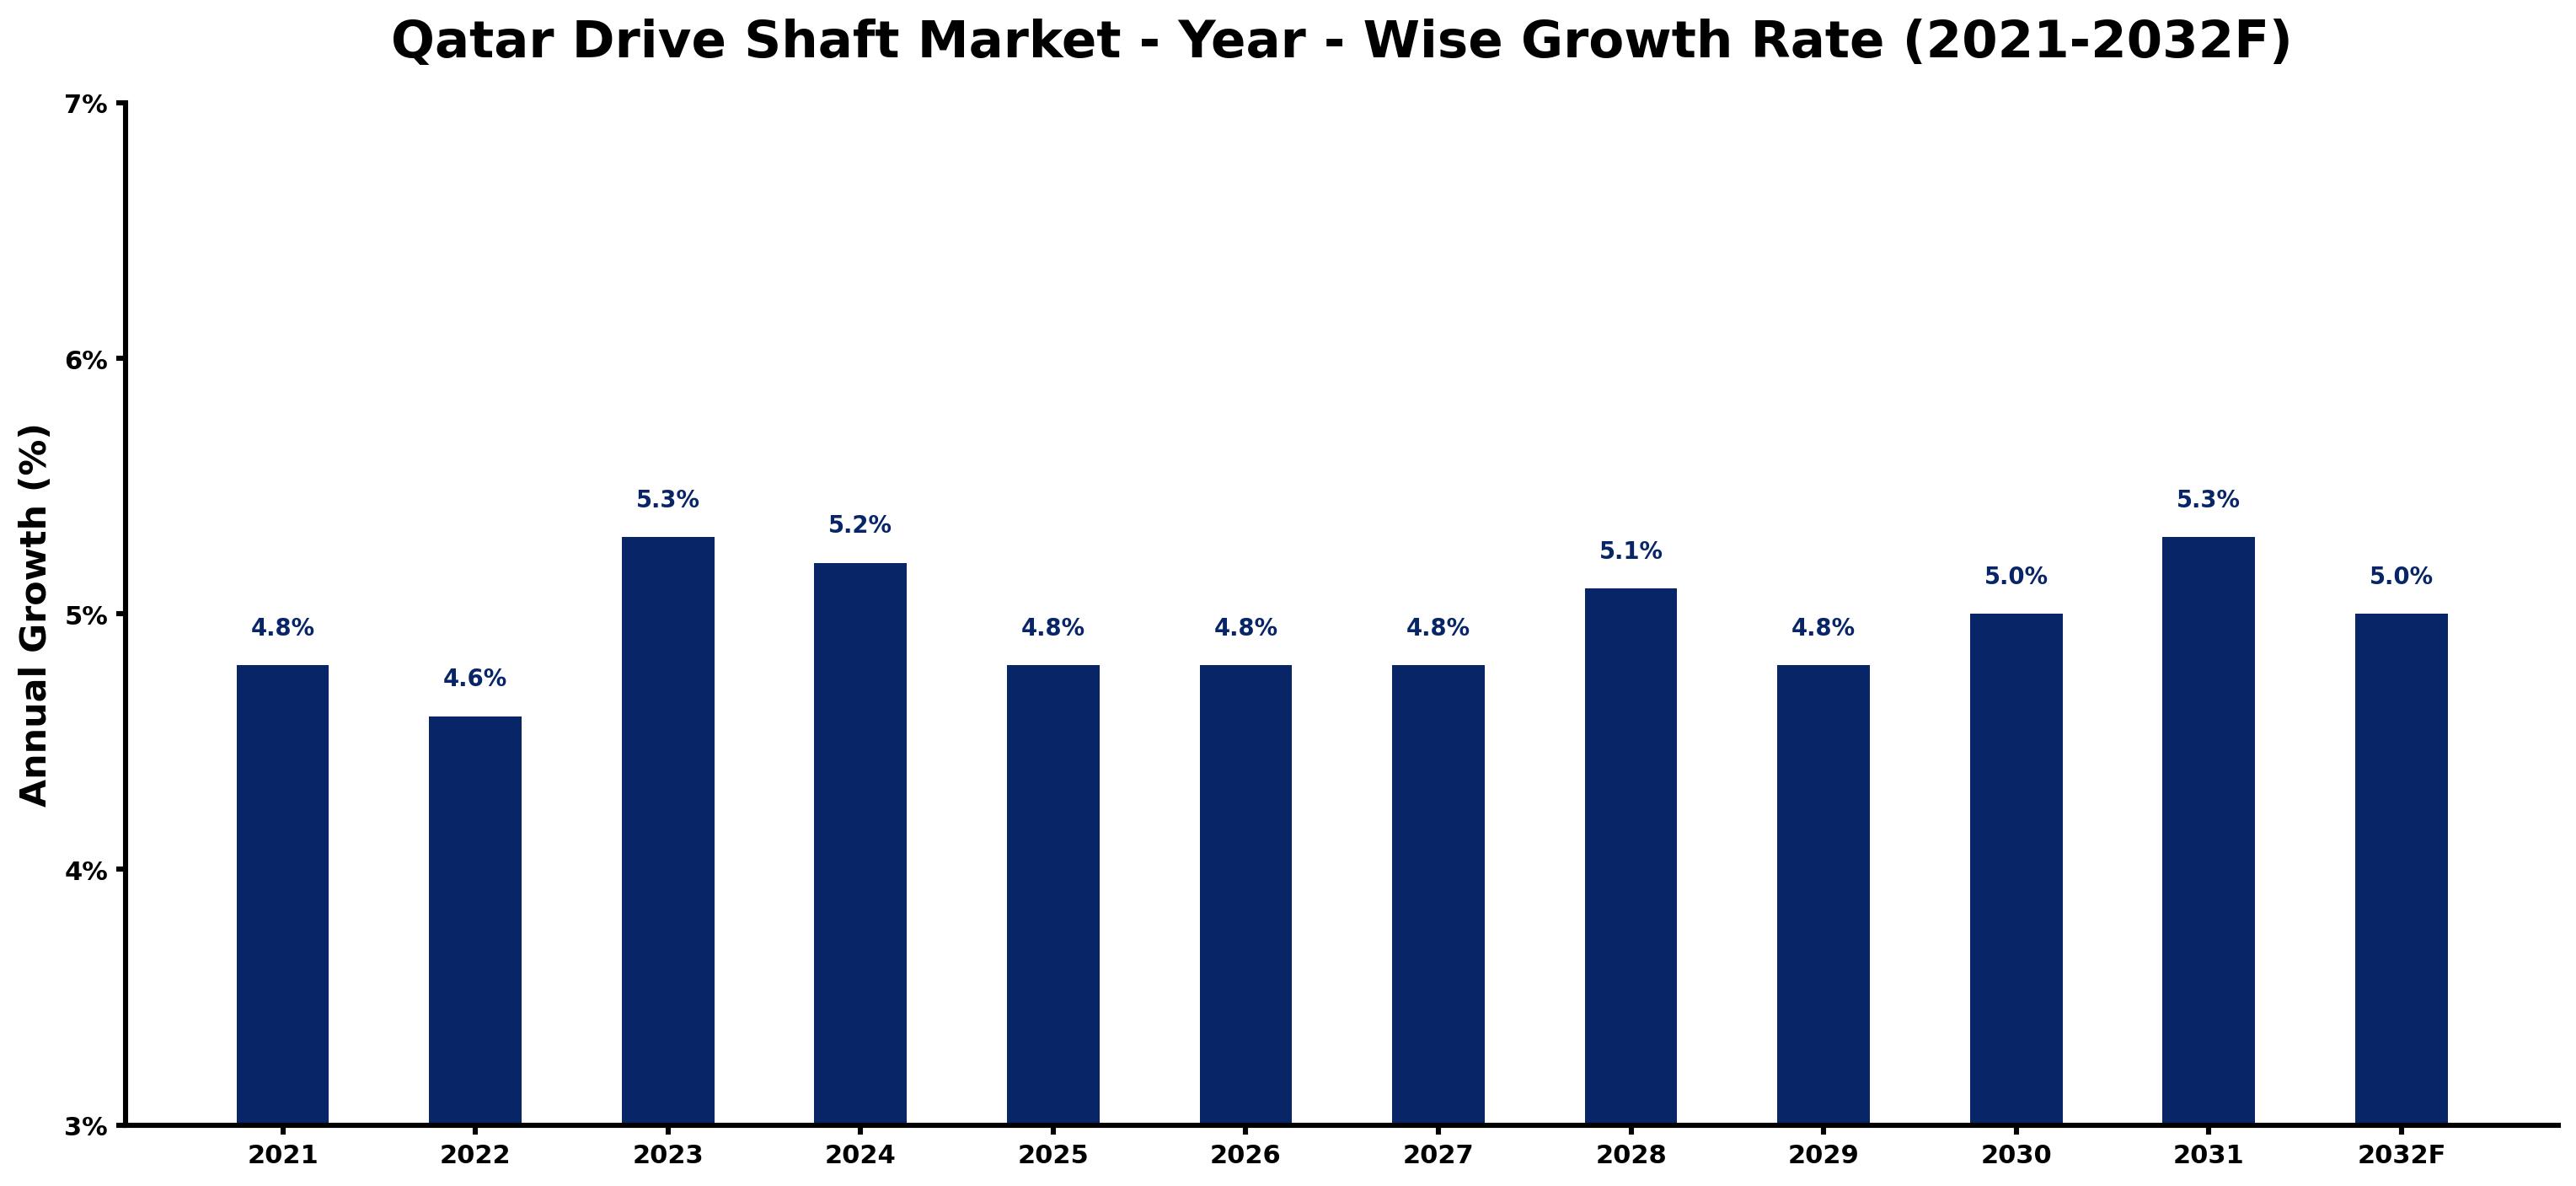
Qatar Drive Shaft Market Growth Rate Analysis (2021-2032)
The Qatar Drive Shaft market has exhibited a stable growth pattern over recent years, with year-on-year expansions driven primarily by advancements in automotive technology and infrastructure development. In 2021, growth was recorded at 4.8%, slightly dipping to 4.6% in 2022 before rebounding to 5.3% in 2023. This upward trend can be attributed to increased consumer demand for high-performance vehicles and significant investments in local manufacturing capacities. Notably, growth stabilizes around 4.8% to 5.1% through 2029, with fluctuations primarily influenced by energy transition policies and evolving industry standards. By 2033, a projected rise to 5.3% underscores the market’s resilience amid global technological shifts and Qatar's focus on enhancing its automotive sector.
Qatar Drive Shaft Market Year-wise Growth Rate and Key Drivers
This graph highlights how the Qatar Drive Shaft Market has steadily grown over the past five years, supported by major growth factors.
The table below presents the year‑wise growth rates along with the key drivers influencing the market
| Year | Growth Rate | Major Drivers |
| 2021 | 4.8% | Increasing smart city development projects |
| 2022 | 4.6% | Growing renewable energy integration projects |
| 2023 | 5.3% | Increasing smart city development projects |
| 2024 | 5.2% | Increasing adoption of advanced technologies |
| 2025 | 4.8% | Expansion of manufacturing activities |
| 2026 | 4.8% | Growing renewable energy integration projects |
| 2027 | 4.8% | Rising electricity demand across industries |
| 2028 | 5.1% | Rapid growth in telecom and data center sectors |
| 2029 | 4.8% | Government infrastructure modernization initiatives |
| 2030 | 5.0% | Expansion of transportation and logistics networks |
| 2031 | 5.3% | Rising electricity demand across industries |
| 2032 | 5.0% | Growing renewable energy integration projects |
Note - Market size estimations and growth projections presented in this report are based on 6Wresearch’s advanced forecasting approach, validated with industry datasets as of June 2026.
Qatar Drive Shaft Market Synopsis
Recent years have shown a robust momentum for the Qatar Drive Shaft Market, spurred by significant investments in automotive manufacturing and construction. With major events like the FIFA World Cup prompting infrastructure upgrades, the market is expected to maintain this upward trajectory, underscoring its long-term potential.
Despite some disruptions caused by the global pandemic, the market has demonstrated resilience. As Qatar continues to recover economically, the commitment to substantial projects across various sectors positions the drive shaft market for further expansion.
Qatar Drive Shaft Market Key Takeaways
- Drive shaft demand is significantly influenced by the growth of the automotive and construction sectors.
- The market is responding well to increased urbanization and rising disposable incomes.
- Investment in infrastructure projects is a key driver, especially in light of major upcoming events.
- Supply chain vulnerabilities stemming from import dependencies present ongoing challenges.
- The local manufacturing push aims to strengthen supply chains and reduce import reliance.
Evaluation of Restraints in Qatar Drive Shaft Market
Despite the promising outlook, the Qatar Drive Shaft Market faces notable constraints, primarily stemming from its reliance on imported components. This dependence can lead to supply chain vulnerabilities, causing price fluctuations and potential delays. Such issues highlight the urgency for establishing a robust local manufacturing base to ensure a more stable supply chain and to meet the increasing demand effectively. Without addressing these concerns, the market's long-term growth could be jeopardized.
Qatar Drive Shaft Market Trends
Several current and emerging trends are shaping the Qatar Drive Shaft Market. A shift toward lightweight and high-strength materials is evident as manufacturers seek to enhance vehicle performance and fuel efficiency. Furthermore, advancements in manufacturing technologies, such as automation and 3D printing, are poised to revolutionize production methods. The increasing integration of electric vehicles into the automotive landscape is also creating unique demands on drive shaft designs and materials.
Qatar Drive Shaft Market Opportunities
The market presents significant growth and investment opportunities, particularly in the realms of local manufacturing and technological innovation. With Qatar's ongoing infrastructure projects, there is a notable demand for advanced drive shaft solutions tailored to the requirements of modern vehicles. Collaborations between local entities and international firms can further bolster the market, paving the way for enhanced technological capabilities and improved product offerings.
Government Initiatives in the Qatar Drive Shaft Market
The Qatari government is actively promoting initiatives to strengthen the domestic automotive industry, fostering a favorable environment for the drive shaft market. Through public spending on infrastructure development and construction projects, as well as incentives for local manufacturing, authorities are focusing on building a resilient economy. These efforts aim to not only bolster the drive shaft market but also to enhance overall industrial growth and sustainability within the region.
Future Insights of the Qatar Drive Shaft Market
Looking ahead to the period of 2026-2032, the Qatar Drive Shaft Market is poised for continued expansion, fueled by a combination of economic recovery, infrastructure investments, and a burgeoning automotive sector. The demand for innovative drive shaft technologies will likely increase, especially with the rise of electric vehicles and more stringent fuel efficiency regulations. These dynamics suggest a vibrant and evolving landscape, ripe for investment and growth opportunities.
Qatar Drive Shaft Market Latest Developments (May 2025 - June 2026)
In the recent months leading up to mid-2026, the Qatar Drive Shaft Market has witnessed a steady shift towards automation in manufacturing processes. There has been a marked increase in collaborations between local businesses and international partners, aimed at introducing innovative drive shaft technologies. Additionally, government-backed initiatives have sparked interest in developing local supply chains to ensure better resilience against global market fluctuations.
Qatar Drive Shaft Market - Key Attractiveness of the Report
- 10 Years of Market Numbers
- Historical Data Starting from 2022 to 2025
- Base Year: 2025
- Forecast Data until 2032
- Key Performance Indicators Impacting the Market
- Major Upcoming Developments and Projects
Key Highlights of the Report:
- Qatar Drive Shaft Market Outlook
- Market Size of Qatar Drive Shaft Market, 2025
- Forecast of Qatar Drive Shaft Market, 2032
- Historical Data and Forecast of Qatar Drive Shaft Revenues & Volume for the Period 2022-2032F
- Qatar Drive Shaft Market Trend Evolution
- Qatar Drive Shaft Market Drivers and Challenges
- Qatar Drive Shaft Price Trends
- Qatar Drive Shaft Porter's Five Forces
- Qatar Drive Shaft Industry Life Cycle
- Historical Data and Forecast of Qatar Drive Shaft Market Revenues & Volume By Shaft Type for the Period 2022-2032F
- Historical Data and Forecast of Qatar Drive Shaft Market Revenues & Volume By Torque Tube Drive Shaft for the Period 2022-2032F
- Historical Data and Forecast of Qatar Drive Shaft Market Revenues & Volume By Flexible Drive Shaft for the Period 2022-2032F
- Historical Data and Forecast of Qatar Drive Shaft Market Revenues & Volume By Hotchkiss Drive Shaft for the Period 2022-2032F
- Historical Data and Forecast of Qatar Drive Shaft Market Revenues & Volume By Material Types for the Period 2022-2032F
- Historical Data and Forecast of Qatar Drive Shaft Market Revenues & Volume By Steel for the Period 2022-2032F
- Historical Data and Forecast of Qatar Drive Shaft Market Revenues & Volume By Aluminum for the Period 2022-2032F
- Historical Data and Forecast of Qatar Drive Shaft Market Revenues & Volume By Other for the Period 2022-2032F
- Historical Data and Forecast of Qatar Drive Shaft Market Revenues & Volume By Design Type for the Period 2022-2032F
- Historical Data and Forecast of Qatar Drive Shaft Market Revenues & Volume By Hollow Drive Shafts for the Period 2022-2032F
- Historical Data and Forecast of Qatar Drive Shaft Market Revenues & Volume By Solid Drive Shafts for the Period 2022-2032F
- Historical Data and Forecast of Qatar Drive Shaft Market Revenues & Volume By Position for the Period 2022-2032F
- Historical Data and Forecast of Qatar Drive Shaft Market Revenues & Volume By Rear Wheel Drive Shaft for the Period 2022-2032F
- Historical Data and Forecast of Qatar Drive Shaft Market Revenues & Volume By Front Wheel Drive Shaft for the Period 2022-2032F
- Historical Data and Forecast of Qatar Drive Shaft Market Revenues & Volume By Vehicle Type for the Period 2022-2032F
- Historical Data and Forecast of Qatar Drive Shaft Market Revenues & Volume By Light Commercial Vehicle for the Period 2022-2032F
- Historical Data and Forecast of Qatar Drive Shaft Market Revenues & Volume By Passenger Cars for the Period 2022-2032F
- Historical Data and Forecast of Qatar Drive Shaft Market Revenues & Volume By Heavy Commercial Vehicles for the Period 2022-2032F
- Qatar Drive Shaft Import Export Trade Statistics
- Market Opportunity Assessment By Shaft Type
- Market Opportunity Assessment By Material Types
- Market Opportunity Assessment By Design Type
- Market Opportunity Assessment By Position
- Market Opportunity Assessment By Vehicle Type
- Qatar Drive Shaft Top Companies Market Share
- Qatar Drive Shaft Competitive Benchmarking By Technical and Operational Parameters
- Qatar Drive Shaft Company Profiles
- Qatar Drive Shaft Key Strategic Recommendations
Qatar Drive Shaft Market - Frequently Asked Questions
The market was estimated at USD 371 Million in 2025 and is projected to reach USD 495 Million by 2032, growing at a CAGR of 4.2% from 2026 to 2032.
Infrastructure projects drive demand significantly, especially in sectors like construction and transportation, where heavy machinery requires reliable drive shaft solutions.
Urbanization is elevating disposable income levels, which, in turn, leads to a higher demand for personal and commercial vehicles, boosting the drive shaft market.
Trends such as the adoption of lightweight materials and innovations in manufacturing technology are shaping the future of drive shafts, enhancing performance and efficiency.
The primary challenges include reliance on imports and supply chain vulnerabilities, making local manufacturing initiatives critical for long-term stability.
6Wresearch actively monitors the Qatar Drive Shaft Market and publishes its comprehensive annual report, highlighting emerging trends, growth drivers, revenue analysis, and forecast outlook. Our insights help businesses to make data-backed strategic decisions with ongoing market dynamics. Our analysts track relevent industries related to the Qatar Drive Shaft Market, allowing our clients with actionable intelligence and reliable forecasts tailored to emerging regional needs.
Yes, we provide customisation as per your requirements. To learn more, feel free to contact us on sales@6wresearch.com
1 Executive Summary |
2 Introduction |
2.1 Key Highlights of the Report |
2.2 Report Description |
2.3 Market Scope & Segmentation |
2.4 Research Methodology |
2.5 Assumptions |
3 Qatar Drive Shaft Market Overview |
3.1 Qatar Country Macro Economic Indicators |
3.2 Qatar Drive Shaft Market Revenues & Volume, 2022 & 2032F |
3.3 Qatar Drive Shaft Market - Industry Life Cycle |
3.4 Qatar Drive Shaft Market - Porter's Five Forces |
3.5 Qatar Drive Shaft Market Revenues & Volume Share, By Shaft Type, 2022 & 2032F |
3.6 Qatar Drive Shaft Market Revenues & Volume Share, By Material Types, 2022 & 2032F |
3.7 Qatar Drive Shaft Market Revenues & Volume Share, By Design Type, 2022 & 2032F |
3.8 Qatar Drive Shaft Market Revenues & Volume Share, By Position, 2022 & 2032F |
3.9 Qatar Drive Shaft Market Revenues & Volume Share, By Vehicle Type, 2022 & 2032F |
4 Qatar Drive Shaft Market Dynamics |
4.1 Impact Analysis |
4.2 Market Drivers |
4.3 Market Restraints |
5 Qatar Drive Shaft Market Trends |
6 Qatar Drive Shaft Market, By Types |
6.1 Qatar Drive Shaft Market, By Shaft Type |
6.1.1 Overview and Analysis |
6.1.2 Qatar Drive Shaft Market Revenues & Volume, By Shaft Type, 2022-2032F |
6.1.3 Qatar Drive Shaft Market Revenues & Volume, By Torque Tube Drive Shaft, 2022-2032F |
6.1.4 Qatar Drive Shaft Market Revenues & Volume, By Flexible Drive Shaft, 2022-2032F |
6.1.5 Qatar Drive Shaft Market Revenues & Volume, By Hotchkiss Drive Shaft, 2022-2032F |
6.2 Qatar Drive Shaft Market, By Material Types |
6.2.1 Overview and Analysis |
6.2.2 Qatar Drive Shaft Market Revenues & Volume, By Steel, 2022-2032F |
6.2.3 Qatar Drive Shaft Market Revenues & Volume, By Aluminum, 2022-2032F |
6.2.4 Qatar Drive Shaft Market Revenues & Volume, By Other, 2022-2032F |
6.3 Qatar Drive Shaft Market, By Design Type |
6.3.1 Overview and Analysis |
6.3.2 Qatar Drive Shaft Market Revenues & Volume, By Hollow Drive Shafts, 2022-2032F |
6.3.3 Qatar Drive Shaft Market Revenues & Volume, By Solid Drive Shafts, 2022-2032F |
6.4 Qatar Drive Shaft Market, By Position |
6.4.1 Overview and Analysis |
6.4.2 Qatar Drive Shaft Market Revenues & Volume, By Rear Wheel Drive Shaft, 2022-2032F |
6.4.3 Qatar Drive Shaft Market Revenues & Volume, By Front Wheel Drive Shaft, 2022-2032F |
6.5 Qatar Drive Shaft Market, By Vehicle Type |
6.5.1 Overview and Analysis |
6.5.2 Qatar Drive Shaft Market Revenues & Volume, By Light Commercial Vehicle, 2022-2032F |
6.5.3 Qatar Drive Shaft Market Revenues & Volume, By Passenger Cars, 2022-2032F |
6.5.4 Qatar Drive Shaft Market Revenues & Volume, By Heavy Commercial Vehicles, 2022-2032F |
7 Qatar Drive Shaft Market Import-Export Trade Statistics |
7.1 Qatar Drive Shaft Market Export to Major Countries |
7.2 Qatar Drive Shaft Market Imports from Major Countries |
8 Qatar Drive Shaft Market Key Performance Indicators |
9 Qatar Drive Shaft Market - Opportunity Assessment |
9.1 Qatar Drive Shaft Market Opportunity Assessment, By Shaft Type, 2022 & 2032F |
9.2 Qatar Drive Shaft Market Opportunity Assessment, By Material Types, 2022 & 2032F |
9.3 Qatar Drive Shaft Market Opportunity Assessment, By Design Type, 2022 & 2032F |
9.4 Qatar Drive Shaft Market Opportunity Assessment, By Position, 2022 & 2032F |
9.5 Qatar Drive Shaft Market Opportunity Assessment, By Vehicle Type, 2022 & 2032F |
10 Qatar Drive Shaft Market - Competitive Landscape |
10.1 Qatar Drive Shaft Market Revenue Share, By Companies, 2025 |
10.2 Qatar Drive Shaft Market Competitive Benchmarking, By Operating and Technical Parameters |
11 Company Profiles |
12 Recommendations |
13 Disclaimer |
Global Go To Market Strategy - 2030
Export potential enables firms to identify high-growth global markets with greater confidence by combining advanced trade intelligence with a structured quantitative methodology. The framework analyzes emerging demand trends and country-level import patterns while integrating macroeconomic and trade datasets such as GDP and population forecasts, bilateral import–export flows, tariff structures, elasticity differentials between developed and developing economies, geographic distance, and import demand projections. Using weighted trade values from 2020–2024 as the base period to project country-to-country export potential for 2030, these inputs are operationalized through calculated drivers such as gravity model parameters, tariff impact factors, and projected GDP per-capita growth. Through an analysis of hidden potentials, demand hotspots, and market conditions that are most favorable to success, this method enables firms to focus on target countries, maximize returns, and global expansion with data, backed by accuracy.
By factoring in the projected importer demand gap that is currently unmet and could be potential opportunity, it identifies the potential for the Exporter (Country) among 190 countries, against the general trade analysis, which identifies the biggest importer or exporter.
To discover high-growth global markets and optimize your business strategy:
Click Here
Pricing
- Single User License$ 1,995
- Department License$ 2,400
- Site License$ 3,120
- Global License$ 3,795

Leadership Perspectives from Industry Events
Search
Thought Leadership and Analyst Meet


Our Clients
6WResearch In News
- India Air Conditioner Market Set for Strong Rebound in 2026 After Weather-Led Correction and GST-Driven Recovery: 6Wresearch
- ADAS in India: How Automatic Emergency Braking, Blind Spot Detection & Driver Monitoring are Transforming Road Safety
- Doha a strategic location for EV manufacturing hub: IPA Qatar
- Demand for luxury TVs surging in the GCC, says Samsung
- Empowering Growth: The Thriving Journey of Bangladesh’s Cable Industry
- Demand for luxury TVs surging in the GCC, says Samsung
Latest Reports
- Poland Fire Protection Systems Market (2026-2032)
- Cape Verde Portable Hand-Thrown Extinguisher Market (2026-2032)
- Canada Portable Hand-Thrown Extinguisher Market (2026-2032)
- Cameroon Portable Hand-Thrown Extinguisher Market (2026-2032)
- Burundi Portable Hand-Thrown Extinguisher Market (2026-2032)
- Burkina Faso Portable Hand-Thrown Extinguisher Market (2026-2032)
- Bulgaria Portable Hand-Thrown Extinguisher Market (2026-2032)
- Brunei Portable Hand-Thrown Extinguisher Market (2026-2032)
- Botswana Portable Hand-Thrown Extinguisher Market (2026-2032)
- Bosnia and Herzegovina Portable Hand-Thrown Extinguisher Market (2026-2032)
Industry Events and Analyst Meet

HIMTEX 2026

India Refining Summit 2026

India EV Show 2026

EV tech India Expo 2026

Auto Tech Asia 2026
Whitepaper
- Middle East & Africa Commercial Security Market Click here to view more.
- Middle East & Africa Fire Safety Systems & Equipment Market Click here to view more.
- GCC Drone Market Click here to view more.
- Middle East Lighting Fixture Market Click here to view more.
- GCC Physical & Perimeter Security Market Click here to view more.