Qatar Non-ferrous Metal Market (2026-2032) | Forecast, Share, Outlook, Industry, Revenue, Trends, Growth, Value, Size, Analysis & Companies
Market Forecast By Types (Aluminum, Copper, Lead, Tin, Nickel, Titanium, Zinc), By Applications (Automobile Industry, Electronic Power Industry, Construction Industry, Other) And Competitive Landscape
| Product Code: ETC035281 | Publication Date: Jul 2023 | Updated Date: Jun 2026 | Product Type: Report | |
| Publisher: 6Wresearch | Author: Ravi Bhandari | No. of Pages: 70 | No. of Figures: 35 | No. of Tables: 5 |
Qatar Non-ferrous Metal Market Summary
The qatar non-ferrous metal market was estimated at USD 170 Million in 2025 and is projected to reach USD 186 Million by 2032, growing at a CAGR of 1.3% from 2026 to 2032.
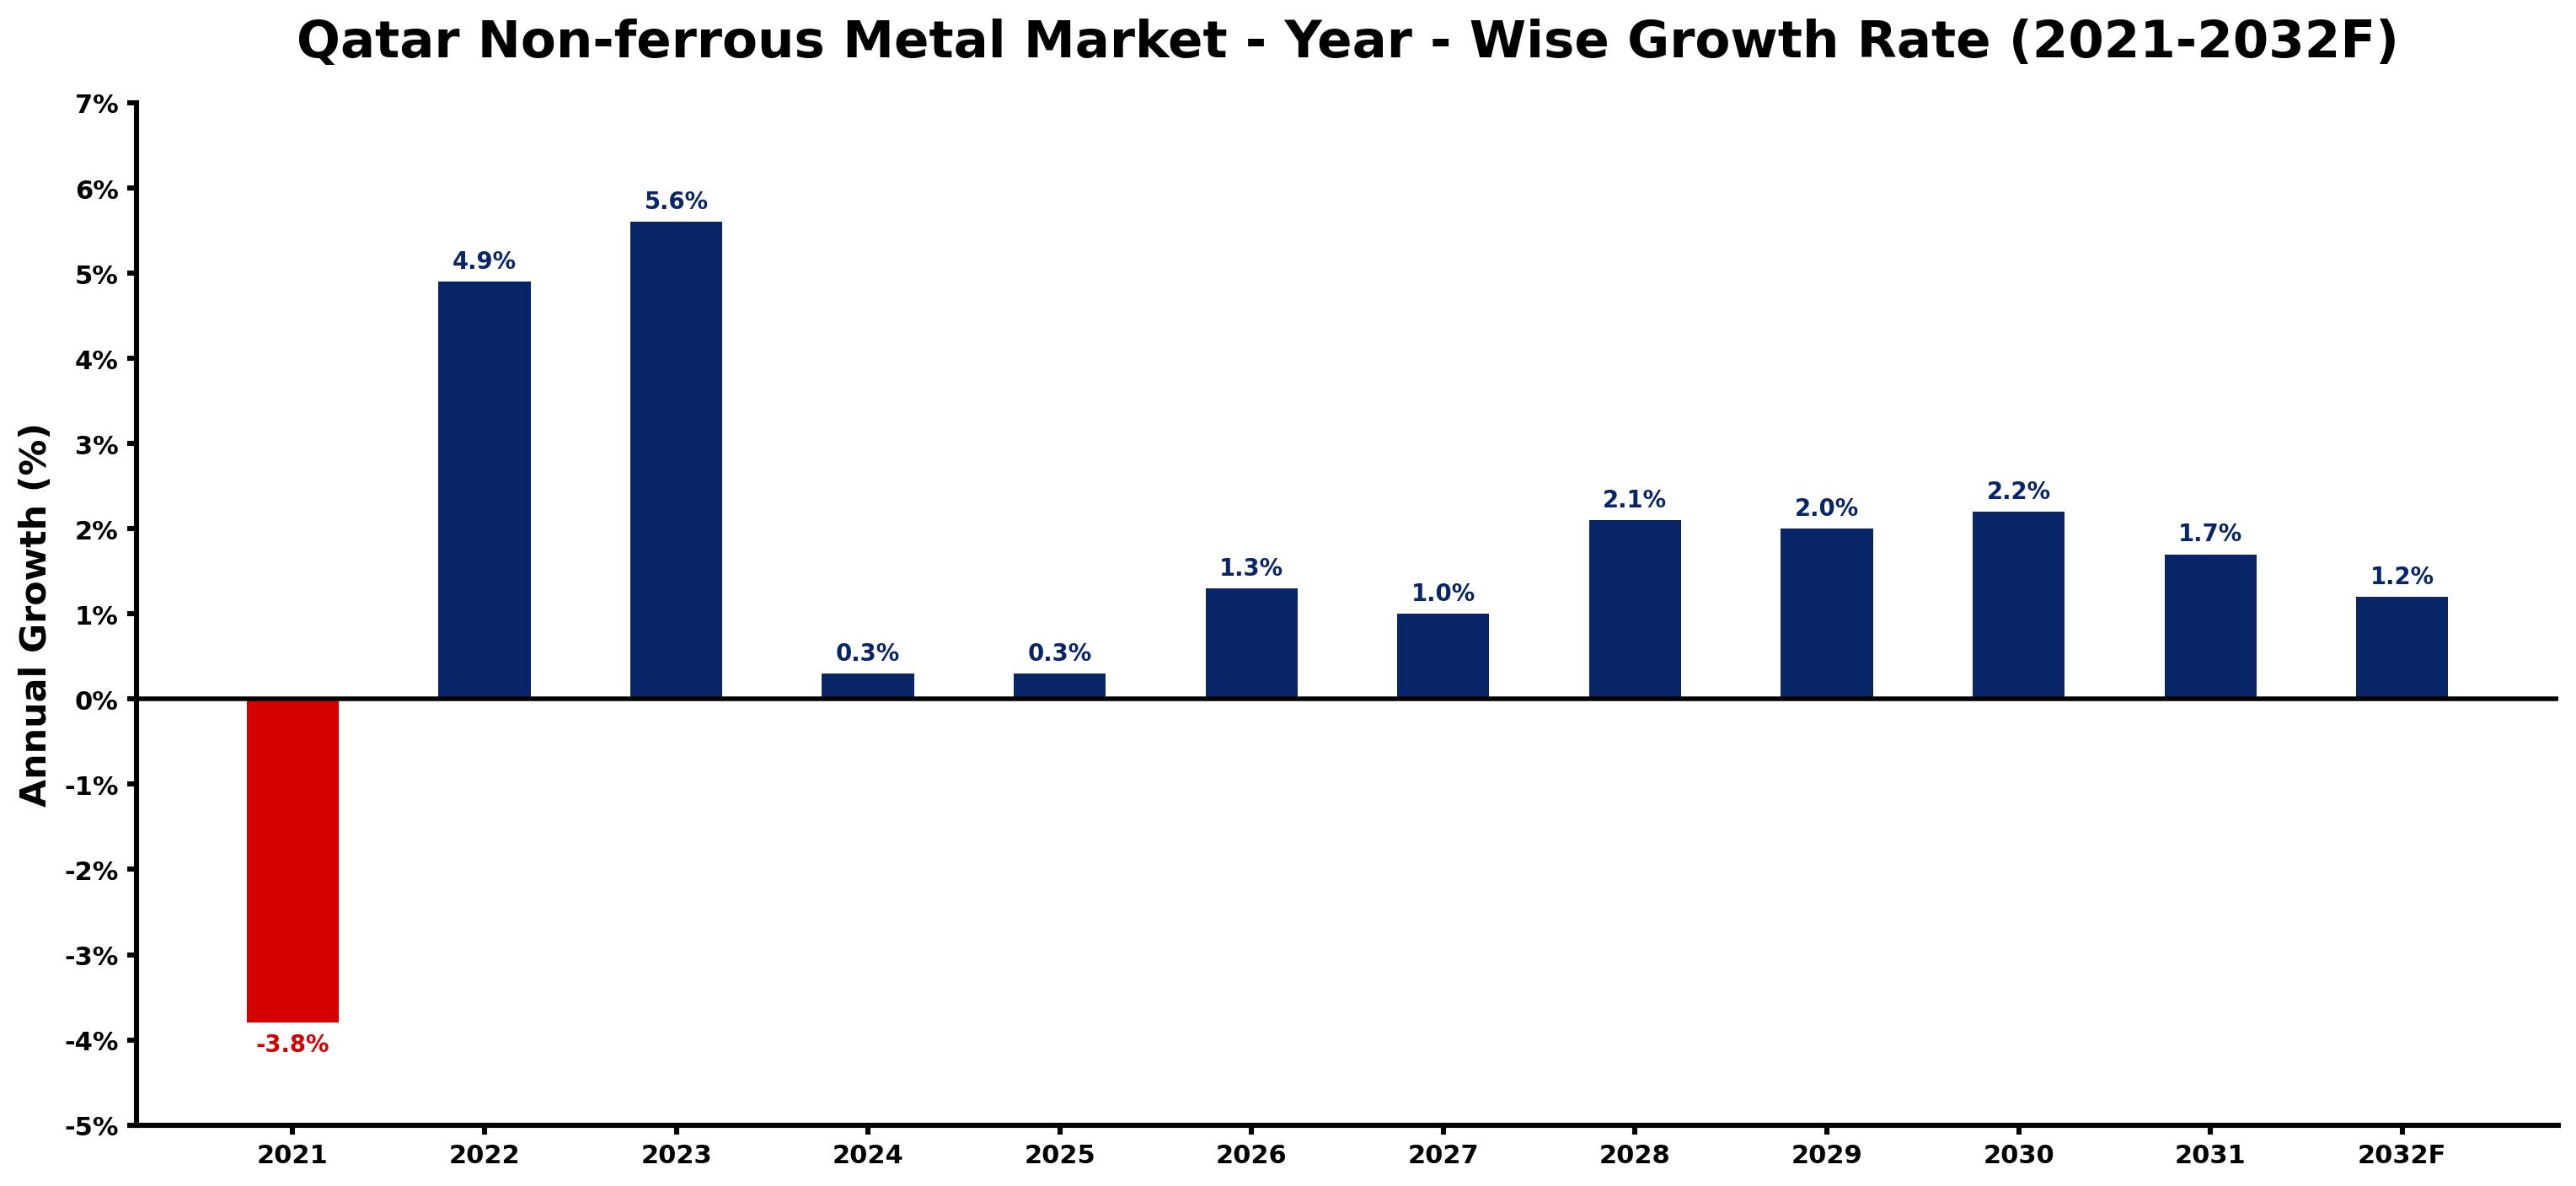
Qatar Non-ferrous Metal Market Growth Rate Analysis (2021-2032)
The Qatar non-ferrous metal market has experienced a notable recovery since the downturn in 2021, where it contracted by 3.8%. Driven by a rebound in global demand and strategic investments, growth surged to 4.9% in 2022 and further accelerated to 5.6% in 2023. This upward trend can be attributed to increased infrastructure projects and advancements in sustainable energy initiatives, prompting a rise in consumption of non-ferrous metals. Although growth is projected to moderate to 0.3% in 2024 and 2025, it is expected to gradually pick up pace again to 2.2% by 2030, driven by ongoing digitalization efforts and a shift towards eco-friendly technologies in the U.S. market.
Qatar Non-ferrous Metal Market Year-wise Growth Rate and Key Drivers
This graph highlights how the Qatar Non-ferrous Metal Market has steadily grown over the past five years, supported by major growth factors.
The table below presents the year wise growth rates along with the key drivers influencing the market
| Year | Growth Rate | Major Drivers |
| 2021 | -3.8% | Decreased global demand for construction materials led to a significant drop in nonferrous metal orders. |
| 2022 | 4.9% | Local manufacturers began sourcing non-ferrous metals to meet expanding production needs. |
| 2023 | 5.6% | Significant infrastructure projects fueled demand for aluminum and copper for construction. |
| 2024 | 0.3% | Investment in green technologies highlighted the importance of recycled non-ferrous materials. |
| 2025 | 0.3% | Regional demand surged due to ambitious Qatar National Vision 2030 objectives. |
| 2026 | 1.3% | Collaboration between private and public sectors improved metal supply chains across Qatar. |
| 2027 | 1.0% | Innovative metal processing techniques reduced costs, stimulating growth in fabrication sectors. |
| 2028 | 2.1% | Increased construction of smart cities and infrastructure raised non-ferrous metal requirements. |
| 2029 | 2.0% | Emerging tech sectors, such as electronics, further diversified the metal market landscape. |
| 2030 | 2.2% | Sustainability trends prompted manufacturers to embrace eco-friendly non-ferrous materials. |
| 2031 | 1.7% | International trade agreements improved market access, fostering competitive pricing for metals. |
| 2032 | 1.2% | Expansion of local recycling initiatives created a steady supply of non-ferrous materials. |
Note - Market size estimations and growth projections presented in this report are based on 6Wresearch's advanced forecasting approach, validated with industry datasets as of June 2026.
Qatar Non-ferrous Metal Market Synopsis
The Qatar Non-ferrous Metal Market is projected to reach 1.3% and witness significant growth during the forecast period (2026-2032). Non-ferrous metals, encompassing a diverse spectrum of alloys such as aluminum, copper, lead, zinc, and nickel, are integral to numerous industrial applications. Their inherent properties, including corrosion resistance, make them highly sought after in key sectors including electrical electronics, automotive, and construction.
Qatar Non-ferrous Metal Market Growth Drivers
The expansion of the Qatar non-ferrous metal market is underpinned by multiple compelling drivers:
- The surge in infrastructure development projects across Qatar propels demand for non-ferrous metals, as these materials are critical for structural integrity and longevity.
- Increased automotive production capacities are driving a parallel rise in non-ferrous metal consumption, with manufacturers seeking lightweight, durable materials to enhance vehicle efficiency.
- The construction sector's emphasis on sustainability and compliance with international standards further elevates the role of non-ferrous metals, particularly in energy-efficient building designs.
- Technological advancements, particularly in metallurgy and material science, are facilitating the development of innovative non-ferrous metal applications, broadening market potential.
- Research and development (R&D) initiatives focused on non-ferrous materials foster innovation, leading to enhanced product offerings and performance in various applications.
Qatar Non-ferrous Metal Market Challenges and Restraints
Despite the positive outlook, the Qatar non-ferrous metal market faces several challenges that could impact growth:
- The high cost associated with establishing and maintaining processing plants poses a significant barrier to entry for new market entrants and can limit expansion for existing players.
- Fluctuations in raw material prices create uncertainty in production costs, affecting profit margins and financial planning for companies operating in this sector.
- Global supply chain disruptions, which were exacerbated by the COVID-19 pandemic, continue to pose risks, leading to potential delays in project timelines and increased operational costs.
- Environmental regulations surrounding mining and processing operations can result in additional compliance costs and operational adjustments for companies.
- The competitive landscape, influenced by global trends and technological advancements, requires continuous innovation and investment, which could strain resources for some market participants.
Qatar Non-ferrous Metal Market Government Investment and Initiatives
The Qatari government plays a pivotal role in shaping the non-ferrous metal market through various investment initiatives and policy frameworks:
- Strategic public spending on infrastructure development is set to bolster demand for non-ferrous metals, supporting sectors critical to national development goals.
- Government initiatives aimed at diversifying the economy encourage investment in the non-ferrous metal sector, aligning with Qatar's broader vision to reduce dependency on oil and gas revenues.
- Incentives for research and development in non-ferrous metallurgy are fostering innovation, helping local firms enhance their competitive edge in the global market.
- Collaborations between governmental bodies and private enterprises are expected to stimulate growth by facilitating knowledge transfer and technological advancements in the industry.
- Policy measures focused on sustainability and environmental stewardship are driving the adoption of non-ferrous metals in greener building and manufacturing practices.
Qatar Non-ferrous Metal Market Latest Developments (May 2025 - June 2026)
Recent developments in the Qatar non-ferrous metal market highlight ongoing trends and shifts in industry direction:
- There has been a marked increase in partnerships between local and international firms aimed at leveraging technological innovations in non-ferrous metal processing.
- Local companies are actively pursuing diversification strategies to mitigate risks associated with market fluctuations and enhance product offerings.
- Government-backed initiatives aimed at improving infrastructure have led to an uptick in demand for high-quality non-ferrous metals in construction and engineering projects.
- Growing emphasis on sustainable practices in manufacturing processes is driving the adoption of non-ferrous metals, which are increasingly viewed as environmentally friendly alternatives.
- Investment in new processing technologies is being prioritized to enhance efficiency and reduce the carbon footprint of non-ferrous metal production.
Qatar Non-ferrous Metal Market - Key Attractiveness of the Report
- 10 Years of Market Numbers
- Historical Data Starting from 2022 to 2025
- Base Year: 2025
- Forecast Data until 2032
- Key Performance Indicators Impacting the Market
- Major Upcoming Developments and Projects
Key Highlights of the Report:
- Qatar Non-ferrous Metal Market Outlook
- Market Size of Qatar Non-ferrous Metal Market, 2025
- Forecast of Qatar Non-ferrous Metal Market, 2032
- Historical Data and Forecast of Qatar Non-ferrous Metal Revenues & Volume for the Period 2022-2032F
- Qatar Non-ferrous Metal Market Trend Evolution
- Qatar Non-ferrous Metal Market Drivers and Challenges
- Qatar Non-ferrous Metal Price Trends
- Qatar Non-ferrous Metal Porter's Five Forces
- Qatar Non-ferrous Metal Industry Life Cycle
- Historical Data and Forecast of Qatar Non-ferrous Metal Market Revenues & Volume By Types for the Period 2022-2032F
- Historical Data and Forecast of Qatar Non-ferrous Metal Market Revenues & Volume By Aluminum for the Period 2022-2032F
- Historical Data and Forecast of Qatar Non-ferrous Metal Market Revenues & Volume By Copper for the Period 2022-2032F
- Historical Data and Forecast of Qatar Non-ferrous Metal Market Revenues & Volume By Lead for the Period 2022-2032F
- Historical Data and Forecast of Qatar Non-ferrous Metal Market Revenues & Volume By Tin for the Period 2022-2032F
- Historical Data and Forecast of Qatar Non-ferrous Metal Market Revenues & Volume By Nickel for the Period 2022-2032F
- Historical Data and Forecast of Qatar Non-ferrous Metal Market Revenues & Volume By Titanium for the Period 2022-2032F
- Historical Data and Forecast of Qatar Non-ferrous Metal Market Revenues & Volume By Zinc for the Period 2022-2032F
- Historical Data and Forecast of Qatar Non-ferrous Metal Market Revenues & Volume By Applications for the Period 2022-2032F
- Historical Data and Forecast of Qatar Non-ferrous Metal Market Revenues & Volume By Automobile Industry for the Period 2022-2032F
- Historical Data and Forecast of Qatar Non-ferrous Metal Market Revenues & Volume By Electronic Power Industry for the Period 2022-2032F
- Historical Data and Forecast of Qatar Non-ferrous Metal Market Revenues & Volume By Construction Industry for the Period 2022-2032F
- Historical Data and Forecast of Qatar Non-ferrous Metal Market Revenues & Volume By Other for the Period 2022-2032F
- Qatar Non-ferrous Metal Import Export Trade Statistics
- Market Opportunity Assessment By Types
- Market Opportunity Assessment By Applications
- Qatar Non-ferrous Metal Top Companies Market Share
- Qatar Non-ferrous Metal Competitive Benchmarking By Technical and Operational Parameters
- Qatar Non-ferrous Metal Company Profiles
- Qatar Non-ferrous Metal Key Strategic Recommendations
Frequently Asked Questions About the Market Study (FAQs):
Non-ferrous metals are primarily used in construction, automotive manufacturing, electrical and electronics production, and industrial machinery.
The government supports the sector through strategic investments in infrastructure, promoting R&D initiatives, and providing incentives for sustainable practices.
The market faces challenges such as high processing costs, price fluctuations of raw materials, supply chain disruptions, and stringent environmental regulations.
Emerging trends include increased sustainability efforts in manufacturing, technological advancements in processing, and growing collaborations between local and international firms.
6Wresearch actively monitors the Qatar Non-ferrous Metal Market and publishes its comprehensive annual report, highlighting emerging trends, growth drivers, revenue analysis, and forecast outlook. Our insights help businesses to make data-backed strategic decisions with ongoing market dynamics. Our analysts track relevent industries related to the Qatar Non-ferrous Metal Market, allowing our clients with actionable intelligence and reliable forecasts tailored to emerging regional needs.
Yes, we provide customisation as per your requirements. To learn more, feel free to contact us on sales@6wresearch.com
1 Executive Summary |
2 Introduction |
2.1 Key Highlights of the Report |
2.2 Report Description |
2.3 Market Scope & Segmentation |
2.4 Research Methodology |
2.5 Assumptions |
3 Qatar Non-ferrous Metal Market Overview |
3.1 Qatar Country Macro Economic Indicators |
3.2 Qatar Non-ferrous Metal Market Revenues & Volume, 2022 & 2032F |
3.3 Qatar Non-ferrous Metal Market - Industry Life Cycle |
3.4 Qatar Non-ferrous Metal Market - Porter's Five Forces |
3.5 Qatar Non-ferrous Metal Market Revenues & Volume Share, By Types, 2022 & 2032F |
3.6 Qatar Non-ferrous Metal Market Revenues & Volume Share, By Applications, 2022 & 2032F |
4 Qatar Non-ferrous Metal Market Dynamics |
4.1 Impact Analysis |
4.2 Market Drivers |
4.2.1 Increasing industrialization and urbanization in Qatar leading to higher demand for non-ferrous metals. |
4.2.2 Growth in the construction and infrastructure sector driving the consumption of non-ferrous metals. |
4.2.3 Technological advancements and innovations in non-ferrous metal production processes increasing efficiency and reducing costs. |
4.3 Market Restraints |
4.3.1 Fluctuations in global metal prices impacting the profitability of the non-ferrous metal market in Qatar. |
4.3.2 Environmental regulations and sustainability concerns affecting the production and usage of non-ferrous metals in the region. |
4.3.3 Dependency on imports for certain types of non-ferrous metals leading to supply chain risks. |
5 Qatar Non-ferrous Metal Market Trends |
6 Qatar Non-ferrous Metal Market, By Types |
6.1 Qatar Non-ferrous Metal Market, By Types |
6.1.1 Overview and Analysis |
6.1.2 Qatar Non-ferrous Metal Market Revenues & Volume, By Types, 2022-2032F |
6.1.3 Qatar Non-ferrous Metal Market Revenues & Volume, By Aluminum, 2022-2032F |
6.1.4 Qatar Non-ferrous Metal Market Revenues & Volume, By Copper, 2022-2032F |
6.1.5 Qatar Non-ferrous Metal Market Revenues & Volume, By Lead, 2022-2032F |
6.1.6 Qatar Non-ferrous Metal Market Revenues & Volume, By Tin, 2022-2032F |
6.1.7 Qatar Non-ferrous Metal Market Revenues & Volume, By Nickel, 2022-2032F |
6.1.8 Qatar Non-ferrous Metal Market Revenues & Volume, By Titanium, 2022-2032F |
6.2 Qatar Non-ferrous Metal Market, By Applications |
6.2.1 Overview and Analysis |
6.2.2 Qatar Non-ferrous Metal Market Revenues & Volume, By Automobile Industry, 2022-2032F |
6.2.3 Qatar Non-ferrous Metal Market Revenues & Volume, By Electronic Power Industry, 2022-2032F |
6.2.4 Qatar Non-ferrous Metal Market Revenues & Volume, By Construction Industry, 2022-2032F |
6.2.5 Qatar Non-ferrous Metal Market Revenues & Volume, By Other, 2022-2032F |
7 Qatar Non-ferrous Metal Market Import-Export Trade Statistics |
7.1 Qatar Non-ferrous Metal Market Export to Major Countries |
7.2 Qatar Non-ferrous Metal Market Imports from Major Countries |
8 Qatar Non-ferrous Metal Market Key Performance Indicators |
8.1 Recycling rate of non-ferrous metals in Qatar. |
8.2 Adoption rate of sustainable practices in non-ferrous metal production. |
8.3 Investment in research and development for new non-ferrous metal technologies. |
8.4 Export volume of finished non-ferrous metal products from Qatar. |
8.5 Energy efficiency and carbon footprint reduction in non-ferrous metal production processes. |
9 Qatar Non-ferrous Metal Market - Opportunity Assessment |
9.1 Qatar Non-ferrous Metal Market Opportunity Assessment, By Types, 2022 & 2032F |
9.2 Qatar Non-ferrous Metal Market Opportunity Assessment, By Applications, 2022 & 2032F |
10 Qatar Non-ferrous Metal Market - Competitive Landscape |
10.1 Qatar Non-ferrous Metal Market Revenue Share, By Companies, 2025 |
10.2 Qatar Non-ferrous Metal Market Competitive Benchmarking, By Operating and Technical Parameters |
11 Company Profiles |
12 Recommendations |
13 Disclaimer |
Global Go To Market Strategy - 2030
Export potential enables firms to identify high-growth global markets with greater confidence by combining advanced trade intelligence with a structured quantitative methodology. The framework analyzes emerging demand trends and country-level import patterns while integrating macroeconomic and trade datasets such as GDP and population forecasts, bilateral import–export flows, tariff structures, elasticity differentials between developed and developing economies, geographic distance, and import demand projections. Using weighted trade values from 2020–2024 as the base period to project country-to-country export potential for 2030, these inputs are operationalized through calculated drivers such as gravity model parameters, tariff impact factors, and projected GDP per-capita growth. Through an analysis of hidden potentials, demand hotspots, and market conditions that are most favorable to success, this method enables firms to focus on target countries, maximize returns, and global expansion with data, backed by accuracy.
By factoring in the projected importer demand gap that is currently unmet and could be potential opportunity, it identifies the potential for the Exporter (Country) among 190 countries, against the general trade analysis, which identifies the biggest importer or exporter.
To discover high-growth global markets and optimize your business strategy:
Click Here
Pricing
- Single User License$ 1,995
- Department License$ 2,400
- Site License$ 3,120
- Global License$ 3,795

Leadership Perspectives from Industry Events
Search
Thought Leadership and Analyst Meet


Our Clients
6WResearch In News
- India Air Conditioner Market Set for Strong Rebound in 2026 After Weather-Led Correction and GST-Driven Recovery: 6Wresearch
- ADAS in India: How Automatic Emergency Braking, Blind Spot Detection & Driver Monitoring are Transforming Road Safety
- Doha a strategic location for EV manufacturing hub: IPA Qatar
- Demand for luxury TVs surging in the GCC, says Samsung
- Empowering Growth: The Thriving Journey of Bangladesh’s Cable Industry
- Demand for luxury TVs surging in the GCC, says Samsung
Latest Reports
- Nicaragua RPG Gaming Market (2026-2032)
- New Zealand RPG Gaming Market (2026-2032)
- Netherlands RPG Gaming Market (2026-2032)
- Nauru RPG Gaming Market (2026-2032)
- Namibia RPG Gaming Market (2026-2032)
- Mozambique RPG Gaming Market (2026-2032)
- Montenegro RPG Gaming Market (2026-2032)
- Mongolia RPG Gaming Market (2026-2032)
- Monaco RPG Gaming Market (2026-2032)
- Micronesia RPG Gaming Market (2026-2032)
Industry Events and Analyst Meet

HIMTEX 2026

India Refining Summit 2026

India EV Show 2026

EV tech India Expo 2026

Auto Tech Asia 2026
Whitepaper
- Middle East & Africa Commercial Security Market Click here to view more.
- Middle East & Africa Fire Safety Systems & Equipment Market Click here to view more.
- GCC Drone Market Click here to view more.
- Middle East Lighting Fixture Market Click here to view more.
- GCC Physical & Perimeter Security Market Click here to view more.