Qatar Potassium permanganate Market (2026-2032) Outlook | Value, Growth, Industry, Share, Forecast, Trends, Revenue, Size, Companies & Analysis
Market Forecast By Grade (Free Flowing Grade, Technical Grade, Pharmaceutical Grade), By Application (Water Treatment, Waste Water Treatment, Chemicals Manufacturing, Aquaculture, Metal Processing, Air and Gas Purification, Others) And Competitive Landscape
| Product Code: ETC091200 | Publication Date: Jun 2021 | Updated Date: Jun 2026 | Product Type: Report | |
| Publisher: 6Wresearch | Author: Ravi Bhandari | No. of Pages: 70 | No. of Figures: 35 | No. of Tables: 5 |
Qatar Potassium permanganate Market Size, Share & Growth Rate
The Qatar Potassium permanganate Market was estimated at USD 320 Million in 2025 and is projected to reach USD 449 Million by 2032, growing at a CAGR of 5.0% from 2026 to 2032. This growth trajectory is primarily fueled by the escalating demand for water treatment solutions, notably across sectors such as oil & gas, pharmaceuticals, and food processing. Furthermore, the Qatar government's commitment to implementing eco-friendly technologies is anticipated to bolster market expansion during this period.
Qatar Potassium permanganate Market Growth Rate Analysis (2021-2032)
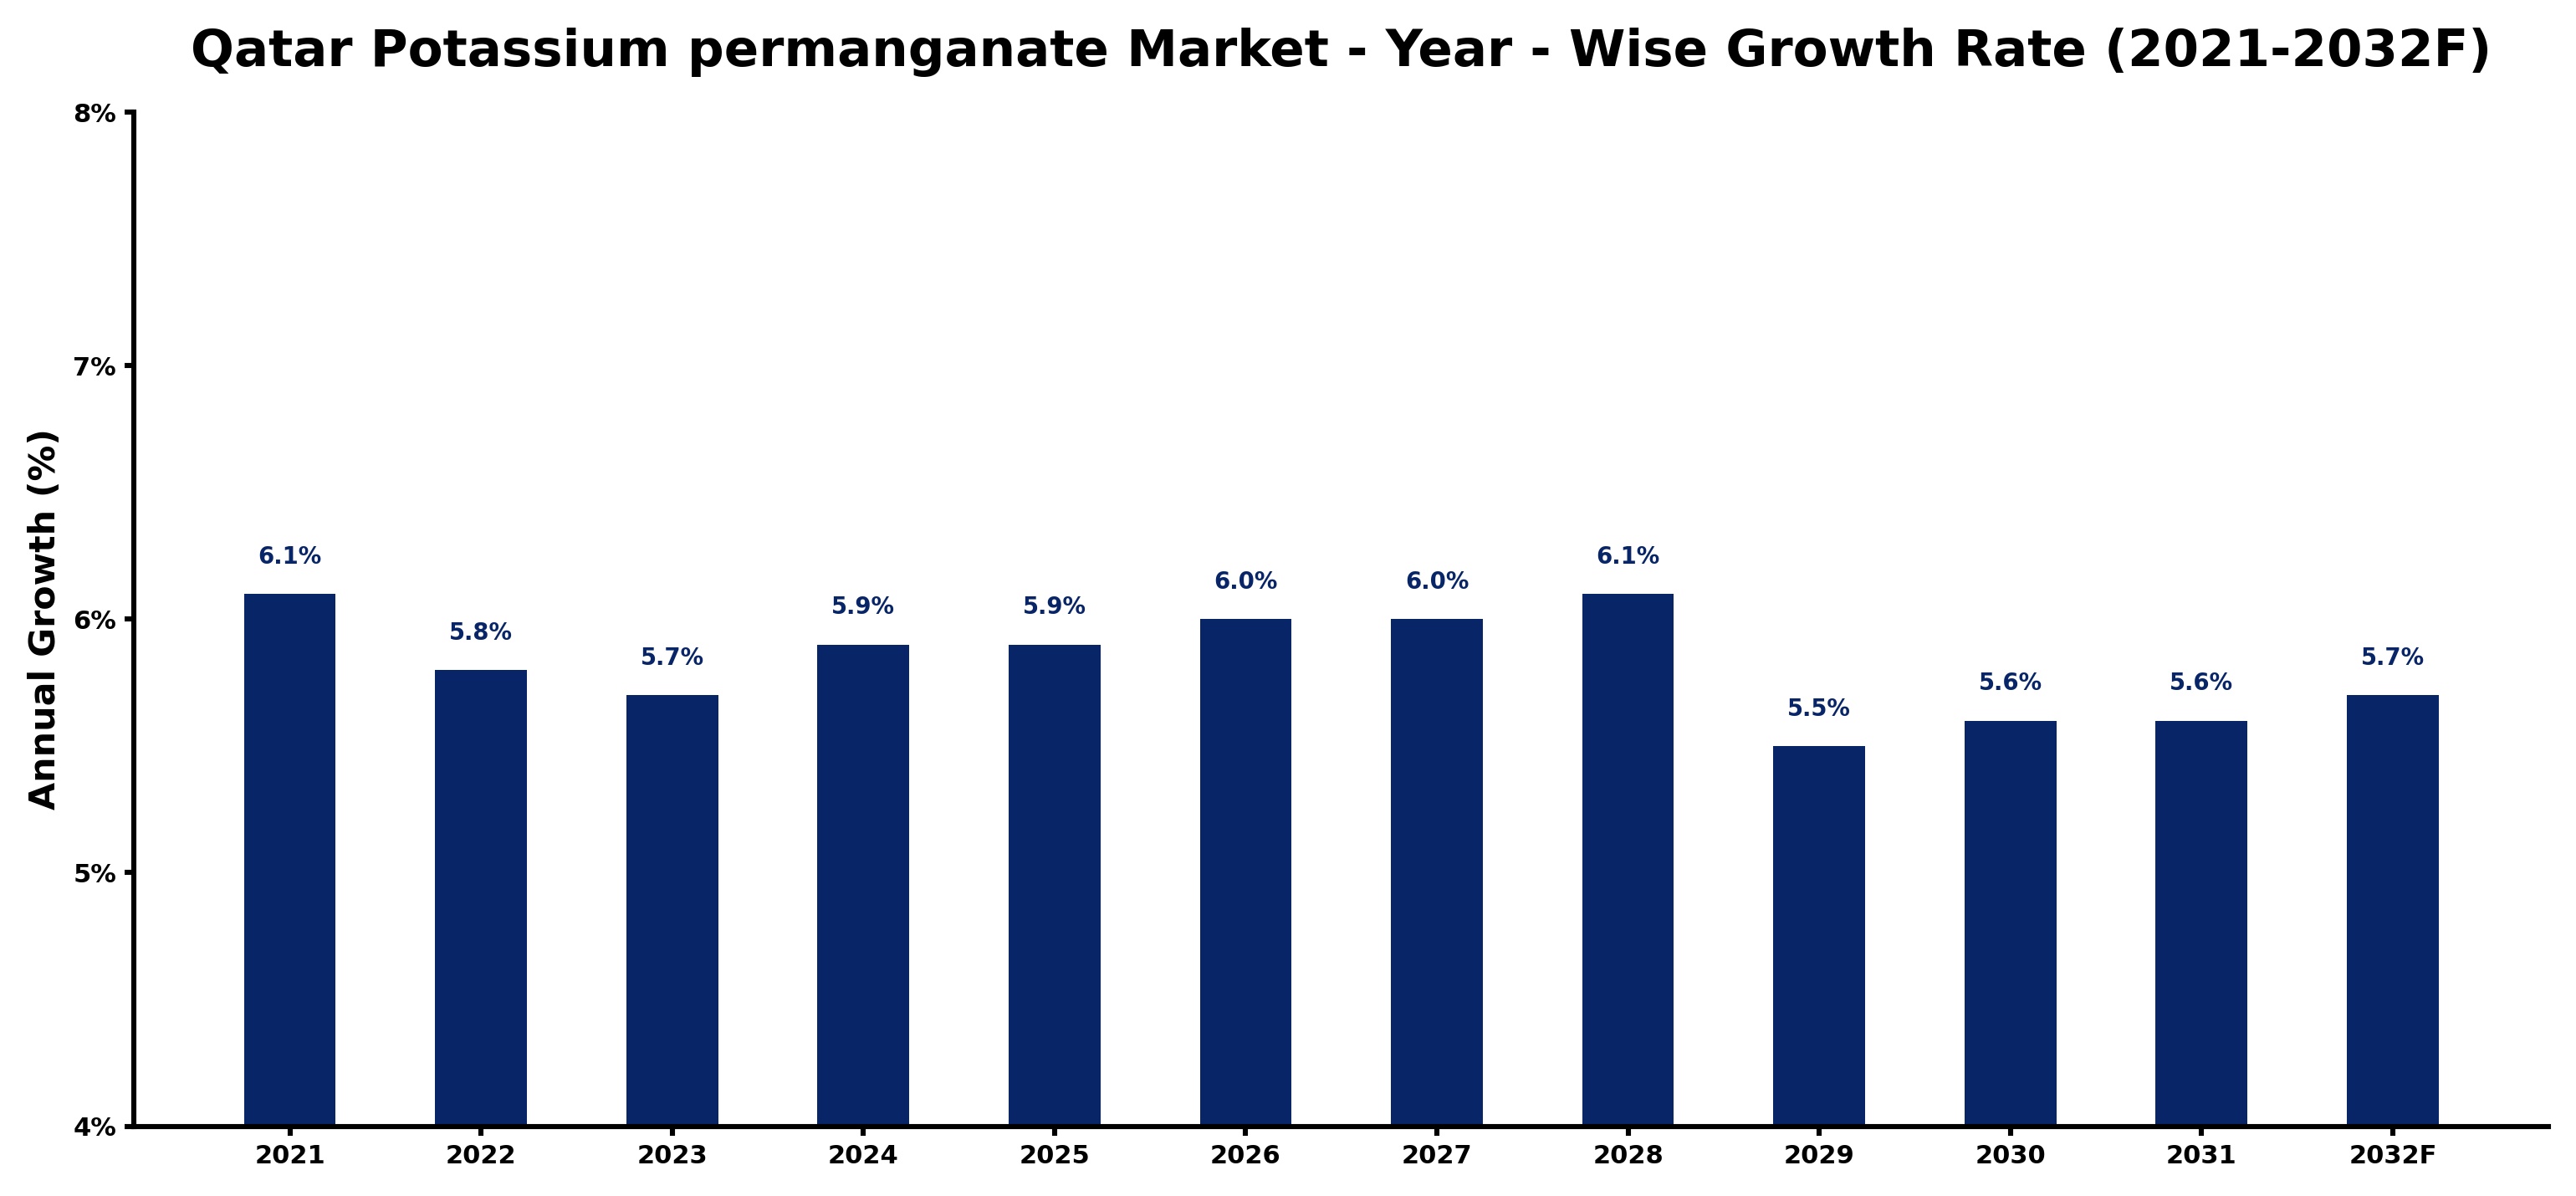
The Qatar potassium permanganate market has exhibited a stable growth pattern over the past few years, with growth rates of 6.1% in 2021, gradually declining to 5.7% in 2023 before regaining momentum to 5.9% in both 2024 and 2025. The fluctuations can be attributed to a combination of rising consumer demand in water treatment and pharmaceutical applications, alongside increased investments in industrial infrastructure, which support the consistent use of potassium permanganate. The market is anticipated to maintain a growth rate of around 6.0% up to 2027, thanks to ongoing digitalization in production processes that enhance efficiency. However, the growth is expected to slightly taper to 5.5% in 2029, reflecting market maturity and competitive pressures.
Qatar Potassium permanganate Market Year-wise Growth Rate and Key Drivers
This graph highlights how the Qatar Potassium permanganate Market has steadily grown over the past five years, supported by major growth factors.
The table below presents the year‑wise growth rates along with the key drivers influencing the market
| Year | Growth Rate | Major Drivers |
| 2021 | 6.1% | Refinery maintenance schedules boosted demand for potassium permanganate supplies |
| 2022 | 5.8% | Export driven investments boost local potassium permanganate manufacturing capacity |
| 2023 | 5.7% | Refinery maintenance schedules boosted potassium permanganate procurement activities |
| 2024 | 5.9% | New LNG infrastructure projects drive potassium permanganate production demand |
| 2025 | 5.9% | Modernized LNG infrastructure drives demand for potassium permanganate applications |
| 2026 | 6.0% | Technology integration in LNG projects boosts potassium permanganate demand |
| 2027 | 6.0% | Manufacturing investments in LNG infrastructure boost potassium permanganate demand |
| 2028 | 6.1% | Infrastructure projects boost demand for potassium permanganate in construction |
| 2029 | 5.5% | Potassium permanganate production scale up supports water treatment facility upgrades |
| 2030 | 5.6% | Advanced technology integration in LNG facilities boosted production efficiencies |
| 2031 | 5.6% | LNG infrastructure projects boost potassium permanganate production capacity utilization |
| 2032 | 5.7% | LNG infrastructure projects stimulated potassium permanganate demand across sectors |
Note - Market size estimations and growth projections presented in this report are based on 6Wresearch’s advanced forecasting approach, validated with industry datasets as of June 2026.
Qatar Potassium permanganate Market Synopsis
The potassium permanganate market in Qatar is currently characterized by a surge in demand driven by a focus on water quality and safety. As industries increasingly adopt stringent water treatment protocols, potassium permanganate has emerged as a preferred oxidizing agent, meeting both industrial and regulatory standards.
In addition, environmental protection initiatives are gaining traction within the region. There is a notable push towards sustainable practices, especially in water management and purification, which positions potassium permanganate as an indispensable chemical in maintaining water quality and supporting public health initiatives.
Qatar Potassium permanganate Market Key Takeaways
- Significant growth anticipated due to increasing industrial demand for water treatment solutions.
- Environmental sustainability initiatives are driving adoption across various sectors.
- Market resilience observed during the COVID-19 pandemic, underscoring the essential nature of potassium permanganate.
- Key players are crucial in ensuring the consistent supply and distribution of potassium permanganate to diverse industries.
- Future prospects highlight ongoing investments in eco-friendly technologies and water quality improvements.
Evaluation of Restraints in Qatar Potassium permanganate Market
Despite its promising growth, the Qatar potassium permanganate market faces notable challenges. One primary concern is the inherent safety risks associated with handling and storage of this strong oxidizing agent. The need for comprehensive training and stringent protocols is paramount to mitigate risks and ensure operational safety. Additionally, the market is tasked with maintaining product quality and navigating fluctuations in demand across varying sectors. The pressure to address environmental impacts tied to waste disposal and chemical usage also adds complexity to the operational landscape.
Qatar Potassium permanganate Market Trends
Emerging trends within the Qatar potassium permanganate market include a marked increase in innovative water treatment technologies. The integration of advanced filtration and purification systems that leverage potassium permanganate's properties reflects a shift towards more efficient industrial practices. Furthermore, the growing emphasis on research and development in chemical applications supports the diversification of potassium permanganate uses beyond traditional sectors.
Qatar Potassium permanganate Market Opportunities
As Qatar continues to invest in infrastructural projects and eco-friendly initiatives, the market presents substantial growth and investment opportunities. The rising focus on sustainable water management strategies indicates a promising trajectory for potassium permanganate applications in both urban and rural settings. Moreover, expanding awareness regarding health and environmental standards offers avenues for potential market entrants to innovate and capture niche segments.
Government Initiatives in the Qatar Potassium permanganate Market
The Qatari government is actively promoting policies aimed at enhancing water quality and sustainability across various industries. Initiatives supporting eco-friendly technologies and chemical treatments are at the forefront, driving the adoption of potassium permanganate. Public spending on water infrastructure, alongside regulatory frameworks that emphasize environmental safety, further complement the growth environment for this chemical.
Future Insights of the Qatar Potassium permanganate Market
Looking ahead to the period from 2026 to 2032, the Qatar potassium permanganate market is expected to evolve significantly. With anticipated increases in industrialization and urbanization, the demand for effective water treatment solutions will intensify. Continued governmental support for sustainability will likely catalyze innovations in the sector, further enhancing the relevance of potassium permanganate in contemporary applications.
Qatar Potassium permanganate Market Latest Developments (May 2025 - June 2026)
Recent developments in the Qatar potassium permanganate market have showcased strategic collaborations aimed at bolstering supply chains and improving distribution channels. Enhanced focus on regulatory compliance concerning environmental standards has also led to increased investments in safety protocols and sustainable practices. As the market adapts to evolving industry dynamics, players are prioritizing innovations that align with both operational efficiency and environmental stewardship.
Qatar Potassium permanganate Market - Key Attractiveness of the Report
- 10 Years of Market Numbers
- Historical Data Starting from 2022 to 2025
- Base Year: 2025
- Forecast Data until 2032
- Key Performance Indicators Impacting the Market
- Major Upcoming Developments and Projects
Key Highlights of the Report:
- Qatar Potassium permanganate Market Outlook
- Market Size of Qatar Potassium permanganate Market, 2025
- Forecast of Qatar Potassium permanganate Market, 2032
- Historical Data and Forecast of Qatar Potassium permanganate Revenues & Volume for the Period 2022-2032F
- Qatar Potassium permanganate Market Trend Evolution
- Qatar Potassium permanganate Market Drivers and Challenges
- Qatar Potassium permanganate Price Trends
- Qatar Potassium permanganate Porter's Five Forces
- Qatar Potassium permanganate Industry Life Cycle
- Historical Data and Forecast of Qatar Potassium permanganate Market Revenues & Volume By Grade for the Period 2022-2032F
- Historical Data and Forecast of Qatar Potassium permanganate Market Revenues & Volume By Free Flowing Grade for the Period 2022-2032F
- Historical Data and Forecast of Qatar Potassium permanganate Market Revenues & Volume By Technical Grade for the Period 2022-2032F
- Historical Data and Forecast of Qatar Potassium permanganate Market Revenues & Volume By Pharmaceutical Grade for the Period 2022-2032F
- Historical Data and Forecast of Qatar Potassium permanganate Market Revenues & Volume By Application for the Period 2022-2032F
- Historical Data and Forecast of Qatar Potassium permanganate Market Revenues & Volume By Water Treatment for the Period 2022-2032F
- Historical Data and Forecast of Qatar Potassium permanganate Market Revenues & Volume By Waste Water Treatment for the Period 2022-2032F
- Historical Data and Forecast of Qatar Potassium permanganate Market Revenues & Volume By Chemicals Manufacturing for the Period 2022-2032F
- Historical Data and Forecast of Qatar Potassium permanganate Market Revenues & Volume By Aquaculture for the Period 2022-2032F
- Historical Data and Forecast of Qatar Potassium permanganate Market Revenues & Volume By Metal Processing for the Period 2022-2032F
- Historical Data and Forecast of Qatar Potassium permanganate Market Revenues & Volume By Air and Gas Purification for the Period 2022-2032F
- Historical Data and Forecast of Qatar Potassium permanganate Market Revenues & Volume By Others for the Period 2022-2032F
- Qatar Potassium permanganate Import Export Trade Statistics
- Market Opportunity Assessment By Grade
- Market Opportunity Assessment By Application
- Qatar Potassium permanganate Top Companies Market Share
- Qatar Potassium permanganate Competitive Benchmarking By Technical and Operational Parameters
- Qatar Potassium permanganate Company Profiles
- Qatar Potassium permanganate Key Strategic Recommendations
Qatar Potassium permanganate Market - Frequently Asked Questions
The growth in the Qatar potassium permanganate market is primarily driven by the increasing need for effective water treatment solutions across various sectors, alongside heightened environmental awareness.
The pandemic had a limited direct impact on the market, as essential services like water treatment continued. Demand remained steady due to Qatar's strategic measures to maintain chemical supplies.
The market is expected to reach USD 449 Million by 2032, following a CAGR of 5.0% from 2026 to 2032, driven by various industrial applications and water treatment demands.
Stakeholders must navigate safety concerns related to handling the chemical, ensuring proper training and protocols to mitigate risks. Variability in demand across industries presents additional operational complexities.
Government policies are increasingly focusing on enhancing water quality and sustainability, creating a favorable environment for potassium permanganate adoption in water treatment and industrial applications.
6Wresearch actively monitors the Qatar Potassium permanganate Market and publishes its comprehensive annual report, highlighting emerging trends, growth drivers, revenue analysis, and forecast outlook. Our insights help businesses to make data-backed strategic decisions with ongoing market dynamics. Our analysts track relevent industries related to the Qatar Potassium permanganate Market, allowing our clients with actionable intelligence and reliable forecasts tailored to emerging regional needs.
Yes, we provide customisation as per your requirements. To learn more, feel free to contact us on sales@6wresearch.com
1 Executive Summary |
2 Introduction |
2.1 Key Highlights of the Report |
2.2 Report Description |
2.3 Market Scope & Segmentation |
2.4 Research Methodology |
2.5 Assumptions |
3 Qatar Potassium permanganate Market Overview |
3.1 Qatar Country Macro Economic Indicators |
3.2 Qatar Potassium permanganate Market Revenues & Volume, 2022 & 2032F |
3.3 Qatar Potassium permanganate Market - Industry Life Cycle |
3.4 Qatar Potassium permanganate Market - Porter's Five Forces |
3.5 Qatar Potassium permanganate Market Revenues & Volume Share, By Grade, 2022 & 2032F |
3.6 Qatar Potassium permanganate Market Revenues & Volume Share, By Application, 2022 & 2032F |
4 Qatar Potassium permanganate Market Dynamics |
4.1 Impact Analysis |
4.2 Market Drivers |
4.3 Market Restraints |
5 Qatar Potassium permanganate Market Trends |
6 Qatar Potassium permanganate Market, By Types |
6.1 Qatar Potassium permanganate Market, By Grade |
6.1.1 Overview and Analysis |
6.1.2 Qatar Potassium permanganate Market Revenues & Volume, By Grade, 2022-2032F |
6.1.3 Qatar Potassium permanganate Market Revenues & Volume, By Free Flowing Grade, 2022-2032F |
6.1.4 Qatar Potassium permanganate Market Revenues & Volume, By Technical Grade, 2022-2032F |
6.1.5 Qatar Potassium permanganate Market Revenues & Volume, By Pharmaceutical Grade, 2022-2032F |
6.2 Qatar Potassium permanganate Market, By Application |
6.2.1 Overview and Analysis |
6.2.2 Qatar Potassium permanganate Market Revenues & Volume, By Water Treatment, 2022-2032F |
6.2.3 Qatar Potassium permanganate Market Revenues & Volume, By Waste Water Treatment, 2022-2032F |
6.2.4 Qatar Potassium permanganate Market Revenues & Volume, By Chemicals Manufacturing, 2022-2032F |
6.2.5 Qatar Potassium permanganate Market Revenues & Volume, By Aquaculture, 2022-2032F |
6.2.6 Qatar Potassium permanganate Market Revenues & Volume, By Metal Processing, 2022-2032F |
6.2.7 Qatar Potassium permanganate Market Revenues & Volume, By Air and Gas Purification, 2022-2032F |
7 Qatar Potassium permanganate Market Import-Export Trade Statistics |
7.1 Qatar Potassium permanganate Market Export to Major Countries |
7.2 Qatar Potassium permanganate Market Imports from Major Countries |
8 Qatar Potassium permanganate Market Key Performance Indicators |
9 Qatar Potassium permanganate Market - Opportunity Assessment |
9.1 Qatar Potassium permanganate Market Opportunity Assessment, By Grade, 2022 & 2032F |
9.2 Qatar Potassium permanganate Market Opportunity Assessment, By Application, 2022 & 2032F |
10 Qatar Potassium permanganate Market - Competitive Landscape |
10.1 Qatar Potassium permanganate Market Revenue Share, By Companies, 2025 |
10.2 Qatar Potassium permanganate Market Competitive Benchmarking, By Operating and Technical Parameters |
11 Company Profiles |
12 Recommendations |
13 Disclaimer |
Global Go To Market Strategy - 2030
Export potential enables firms to identify high-growth global markets with greater confidence by combining advanced trade intelligence with a structured quantitative methodology. The framework analyzes emerging demand trends and country-level import patterns while integrating macroeconomic and trade datasets such as GDP and population forecasts, bilateral import–export flows, tariff structures, elasticity differentials between developed and developing economies, geographic distance, and import demand projections. Using weighted trade values from 2020–2024 as the base period to project country-to-country export potential for 2030, these inputs are operationalized through calculated drivers such as gravity model parameters, tariff impact factors, and projected GDP per-capita growth. Through an analysis of hidden potentials, demand hotspots, and market conditions that are most favorable to success, this method enables firms to focus on target countries, maximize returns, and global expansion with data, backed by accuracy.
By factoring in the projected importer demand gap that is currently unmet and could be potential opportunity, it identifies the potential for the Exporter (Country) among 190 countries, against the general trade analysis, which identifies the biggest importer or exporter.
To discover high-growth global markets and optimize your business strategy:
Click Here
Pricing
- Single User License$ 1,995
- Department License$ 2,400
- Site License$ 3,120
- Global License$ 3,795

Leadership Perspectives from Industry Events
Search
Thought Leadership and Analyst Meet


Our Clients
6WResearch In News
- India Air Conditioner Market Set for Strong Rebound in 2026 After Weather-Led Correction and GST-Driven Recovery: 6Wresearch
- ADAS in India: How Automatic Emergency Braking, Blind Spot Detection & Driver Monitoring are Transforming Road Safety
- Doha a strategic location for EV manufacturing hub: IPA Qatar
- Demand for luxury TVs surging in the GCC, says Samsung
- Empowering Growth: The Thriving Journey of Bangladesh’s Cable Industry
- Demand for luxury TVs surging in the GCC, says Samsung
Latest Reports
- Poland Fire Protection Systems Market (2026-2032)
- Cape Verde Portable Hand-Thrown Extinguisher Market (2026-2032)
- Canada Portable Hand-Thrown Extinguisher Market (2026-2032)
- Cameroon Portable Hand-Thrown Extinguisher Market (2026-2032)
- Burundi Portable Hand-Thrown Extinguisher Market (2026-2032)
- Burkina Faso Portable Hand-Thrown Extinguisher Market (2026-2032)
- Bulgaria Portable Hand-Thrown Extinguisher Market (2026-2032)
- Brunei Portable Hand-Thrown Extinguisher Market (2026-2032)
- Botswana Portable Hand-Thrown Extinguisher Market (2026-2032)
- Bosnia and Herzegovina Portable Hand-Thrown Extinguisher Market (2026-2032)
Industry Events and Analyst Meet

HIMTEX 2026

India Refining Summit 2026

India EV Show 2026

EV tech India Expo 2026

Auto Tech Asia 2026
Whitepaper
- Middle East & Africa Commercial Security Market Click here to view more.
- Middle East & Africa Fire Safety Systems & Equipment Market Click here to view more.
- GCC Drone Market Click here to view more.
- Middle East Lighting Fixture Market Click here to view more.
- GCC Physical & Perimeter Security Market Click here to view more.