Qatar Switchboards Market (2026-2032) | Analysis, Revenue, Size, Share, Companies, Outlook, Value, Trends, Forecast, Growth, Industry
Market Forecast By Type (Low-Voltage, Middle-Voltage, High-Voltage), By End-users (Industrial, Residential, Commercial, Other) And Competitive Landscape
| Product Code: ETC020941 | Publication Date: Jul 2023 | Updated Date: Jun 2026 | Product Type: Report | |
| Publisher: 6Wresearch | Author: Ravi Bhandari | No. of Pages: 70 | No. of Figures: 35 | No. of Tables: 5 |
Qatar Switchboards Market Summary
The qatar switchboards market was estimated at USD 469 Million in 2025 and is projected to reach USD 638 Million by 2032, growing at a CAGR of 5.6% from 2026 to 2032.
Qatar Switchboards Market Growth Rate Analysis (2021-2032)
The Qatar switchboards market has shown stable growth, with an annual increase of 5.3% in 2021, followed by 5.0% in 2022, and slight variations maintaining similar patterns through 2023 to 2032. Factors contributing to this growth include increasing investments in infrastructure and a robust energy transition strategy, driving demand for advanced switchboard technologies. The market is influenced by a steady rise in urbanization and industrial expansion, fostering a consistent need for efficient electrical management systems. Fluctuations in growth rates, such as the peak of 5.6% in 2026, reflect the adaptation to technological advancements and shifts in consumer demand, ensuring that the market remains agile and responsive to evolving business contexts.
Qatar Switchboards Market Year-wise Growth Rate and Key Drivers
This graph highlights how the Qatar Switchboards Market has steadily grown over the past five years, supported by major growth factors.
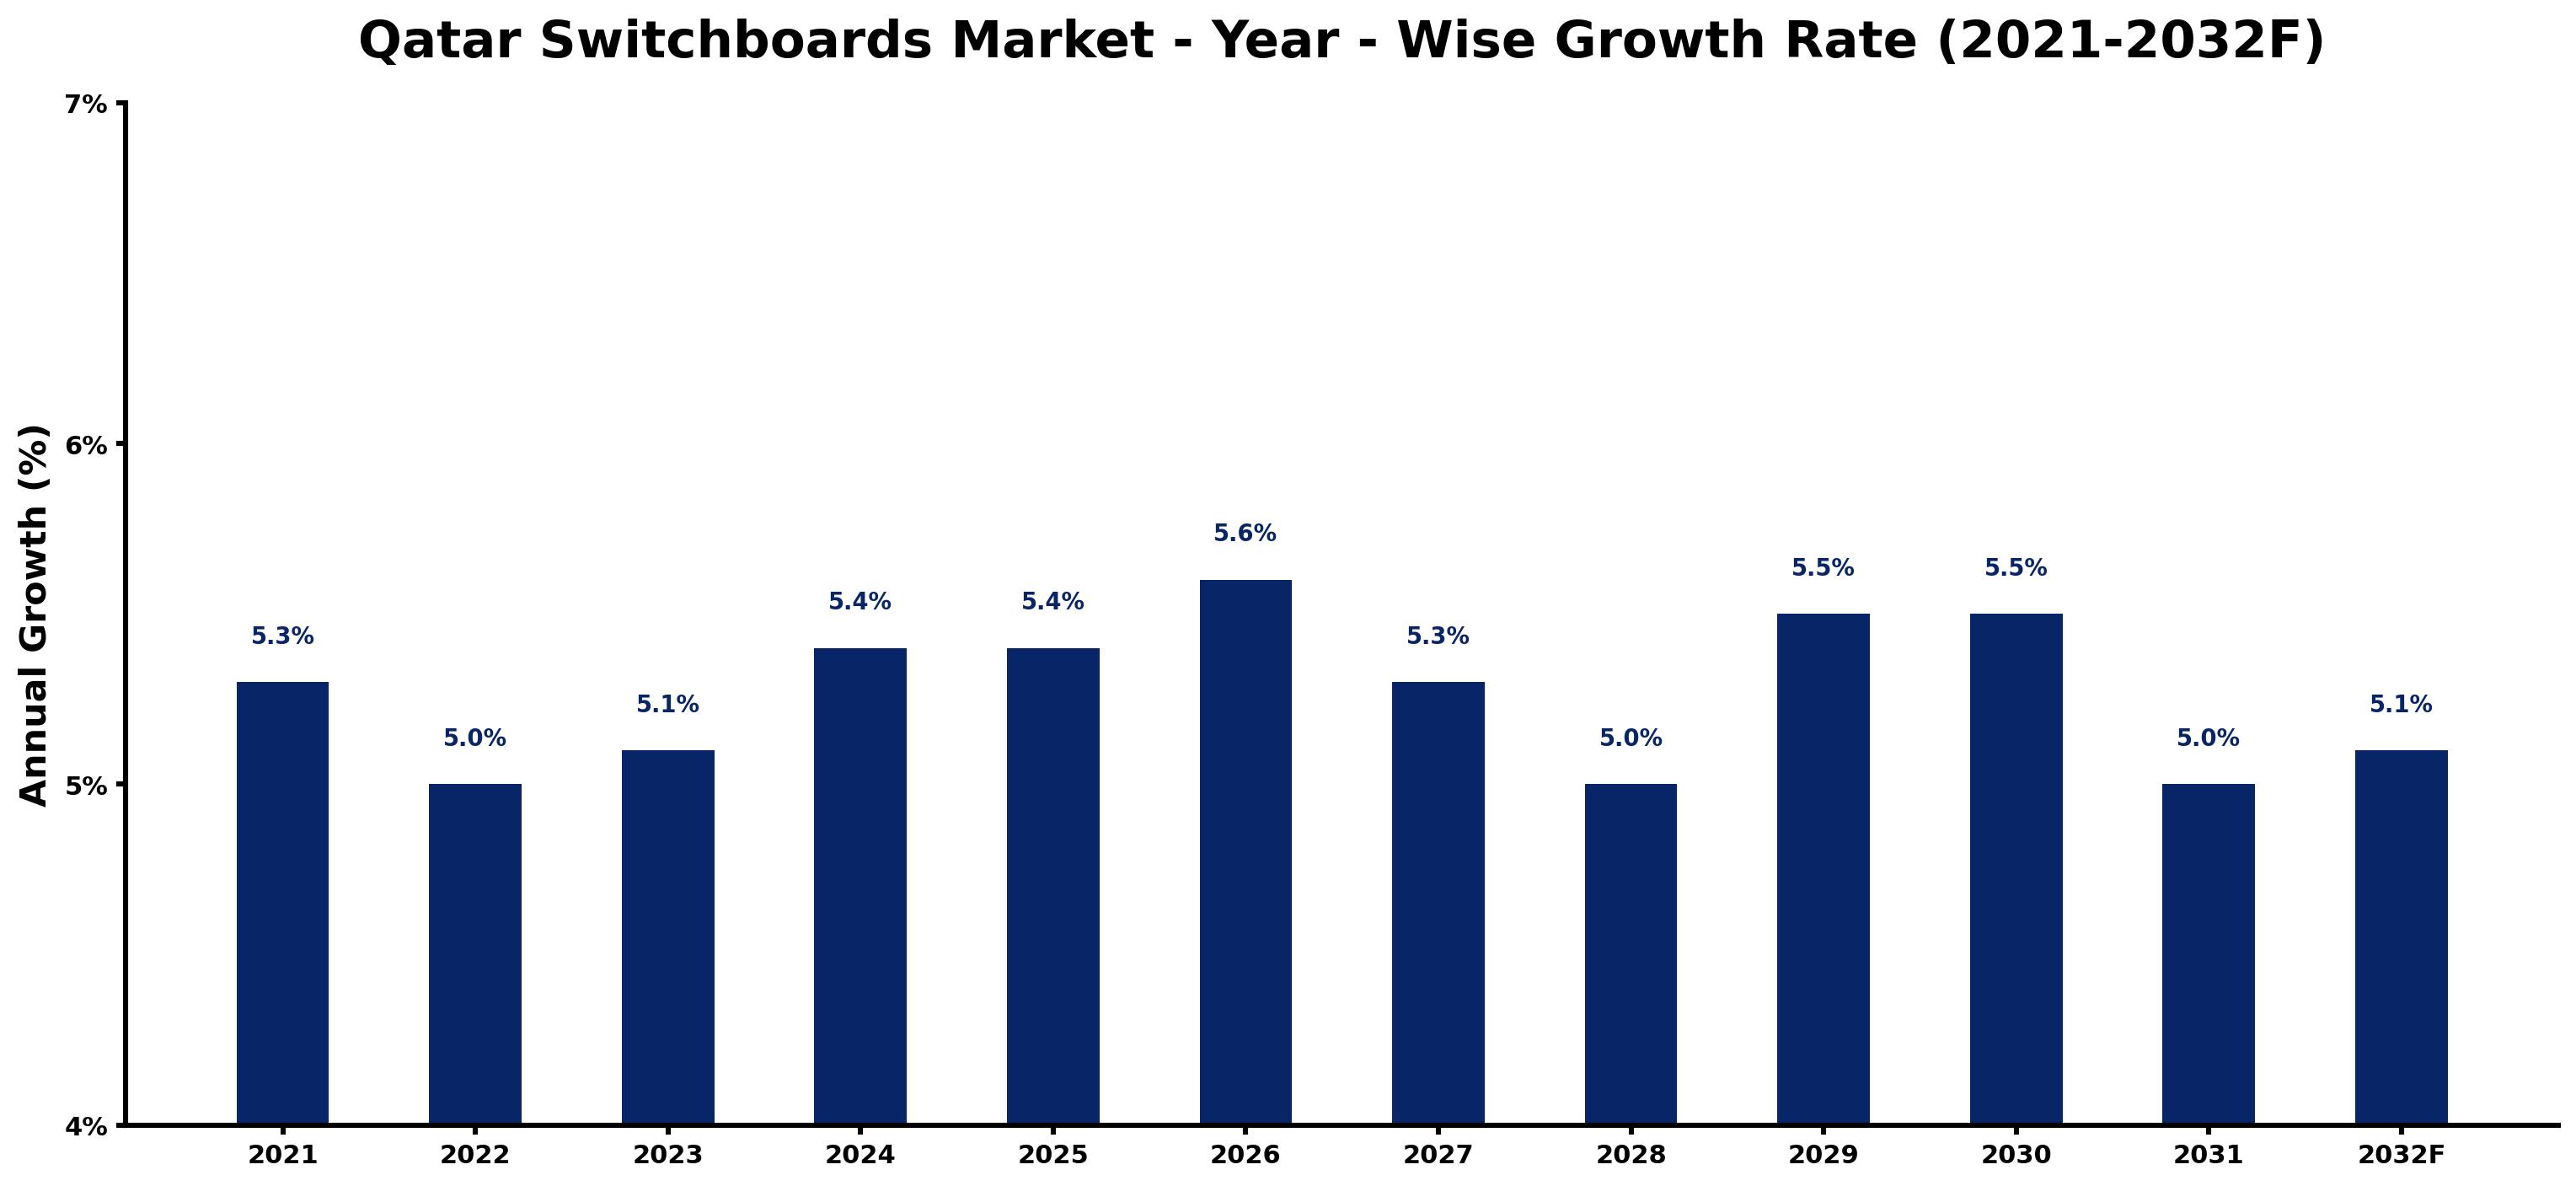
The table below presents the year wise growth rates along with the key drivers influencing the market
| Year | Growth Rate | Major Drivers |
| 2021 | 5.3% | Post-pandemic recovery led to increased investments in infrastructure projects across Qatar. |
| 2022 | 5.0% | Urban expansion initiatives prompted demand for efficient electrical distribution solutions. |
| 2023 | 5.1% | Local manufacturers focused on adapting products to meet Qatar's extreme climate requirements. |
| 2024 | 5.4% | Construction pipelines for FIFA-related projects ignited interest in advanced switchboard technologies. |
| 2025 | 5.4% | Growing emphasis on energy efficiency influenced corporate purchasing decisions for switchboard systems. |
| 2026 | 5.6% | Regional collaboration on smart city projects highlighted the need for integrated electrical solutions. |
| 2027 | 5.3% | Increased reliance on renewable energy sources required innovative switchboard designs and applications. |
| 2028 | 5.0% | Technological partnerships with international firms enhanced local capabilities for switchboard manufacturing. |
| 2029 | 5.5% | Market players began investing in research for modular switchboards catering to diverse sectors. |
| 2030 | 5.5% | Rising population density in urban areas necessitated upgrades to existing electrical infrastructures. |
| 2031 | 5.0% | Focus on sustainability standards prompted demand for environmentally-friendly switchboard materials. |
| 2032 | 5.1% | Digital transformation initiatives led to smart switchboard solutions integrating IoT capabilities. |
Note - Market size estimations and growth projections presented in this report are based on 6Wresearch's advanced forecasting approach, validated with industry datasets as of June 2026.
Qatar Switchboards Market Synopsis
The Qatar Switchboards Market is projected to reach 5.6% and witness significant growth during the forecast period (2026-2032). The anticipated compound annual growth rate (CAGR) of 5.4% is chiefly driven by escalating electricity demand across various sectors, coupled with robust industrial activities spurred by both domestic and foreign investments. These dynamics are prompting switchboard manufacturers to amplify their investments within the region. Additionally, the government's liberalization of foreign direct investment (FDI) policies has fostered an influx of new entrants into the market, while local companies are forging partnerships with international firms. This strategy enables them to enhance their product offerings through technology transfer, aligning with customer specifications for high-end solutions.
Qatar Switchboards Market Growth Drivers
The key drivers propelling the Qatar Switchboards Market include:
- Rapidly growing electricity consumption across commercial and residential sectors, indicating a rising need for effective power management solutions.
- Infrastructure developments associated with major events such as the FIFA World Cup 2022, necessitating substantial investments in electrical infrastructure.
- Government initiatives like the Qatar National Vision 2031, targeting energy grid expansion and cost-effective energy tariffs, enhancing the long-term industry outlook.
- Ongoing projects such as the Barzan Gas Project and North Field Expansion Project by the state-owned oil company, further amplifying the demand for switchboard solutions.
- Increased industrialization, leading to heightened commercial activities that necessitate sophisticated electrical distribution systems.
Qatar Switchboards Market Challenges and Restraints
Despite positive growth indicators, the Qatar Switchboards Market faces notable challenges:
- Intense competition from low-cost imports, particularly from nations like China and India, where lower labor costs lead to more competitive pricing.
- Potential economic uncertainties, which may lead to hesitancy among companies in investing in new infrastructure or modernization projects.
- Supply chain disruptions, exacerbated by global events, can hinder the procurement of essential components for switchboard manufacturing.
- Technological challenges that local firms may face while trying to keep pace with international standards and innovations in switchboard design and functionality.
- Market entry barriers for new players seeking to establish themselves in a landscape dominated by established competitors.
Qatar Switchboards Market Government Investment and Initiatives
The Government of Qatar has been actively involved in enhancing the switchboards market through a series of strategic investments and initiatives. Significant public spending has been directed towards infrastructure improvements, focusing on the modernization and expansion of the energy grid. The Qatar National Vision 2031 underscores the government's commitment to establishing a sustainable energy framework that supports economic diversification. Furthermore, recent policies aimed at attracting foreign investments have created a conducive environment for both local and international businesses to collaborate on technological advancements. These initiatives ensure that the switchboards market remains vibrant and responsive to the growing electricity demands throughout the region.
Qatar Switchboards Market Latest Developments (May 2025 - June 2026)
Recent developments in the Qatar Switchboards Market from May 2025 to June 2026 have indicated a continued push towards innovation and expansion. Industry stakeholders are increasingly focused on integrating smart switchboard technologies that enhance efficiency and reliability. Additionally, collaborative efforts between local firms and international technology providers have been evident, leading to improved product offerings tailored to meet the specific needs of Qatar's diverse market. The regulatory environment has also seen updates, aimed at streamlining processes for new market entrants, thereby supporting competition and innovation in the sector. Furthermore, the ongoing recovery from the Covid-19 pandemic has prompted companies to reassess their operational strategies, signifying a resilient approach to overcoming previous challenges.
Qatar Switchboards Market - Key Attractiveness of the Report
- 10 Years of Market Numbers
- Historical Data Starting from 2022 to 2025
- Base Year: 2025
- Forecast Data until 2032
- Key Performance Indicators Impacting the Market
- Major Upcoming Developments and Projects
Key Highlights of the Report:
- Qatar Switchboards Market Outlook
- Market Size of Qatar Switchboards Market, 2025
- Forecast of Qatar Switchboards Market, 2032
- Historical Data and Forecast of Qatar Switchboards Revenues & Volume for the Period 2022-2032F
- Qatar Switchboards Market Trend Evolution
- Qatar Switchboards Market Drivers and Challenges
- Qatar Switchboards Price Trends
- Qatar Switchboards Porter's Five Forces
- Qatar Switchboards Industry Life Cycle
- Historical Data and Forecast of Qatar Switchboards Market Revenues & Volume By Type for the Period 2022-2032F
- Historical Data and Forecast of Qatar Switchboards Market Revenues & Volume By Low-Voltage for the Period 2022-2032F
- Historical Data and Forecast of Qatar Switchboards Market Revenues & Volume By Middle-Voltage for the Period 2022-2032F
- Historical Data and Forecast of Qatar Switchboards Market Revenues & Volume By High-Voltage for the Period 2022-2032F
- Historical Data and Forecast of Qatar Switchboards Market Revenues & Volume By End-users for the Period 2022-2032F
- Historical Data and Forecast of Qatar Switchboards Market Revenues & Volume By Industrial for the Period 2022-2032F
- Historical Data and Forecast of Qatar Switchboards Market Revenues & Volume By Residential for the Period 2022-2032F
- Historical Data and Forecast of Qatar Switchboards Market Revenues & Volume By Commercial for the Period 2022-2032F
- Historical Data and Forecast of Qatar Switchboards Market Revenues & Volume By Other for the Period 2022-2032F
- Qatar Switchboards Import Export Trade Statistics
- Market Opportunity Assessment By Type
- Market Opportunity Assessment By End-users
- Qatar Switchboards Top Companies Market Share
- Qatar Switchboards Competitive Benchmarking By Technical and Operational Parameters
- Qatar Switchboards Company Profiles
- Qatar Switchboards Key Strategic Recommendations
Frequently Asked Questions About the Market Study (FAQs):
The Qatar Switchboards Market is projected to grow at a CAGR of 5.4% during the forecast period of 2026-2032.
Key growth drivers include increasing electricity consumption, infrastructure developments related to major events, and government investment in energy grid expansion.
Challenges include competition from low-cost imports and potential economic uncertainties affecting investment decisions.
The pandemic led to decreased demand and delayed projects due to economic uncertainty, impacting the overall sales of switchboard solutions.
6Wresearch actively monitors the Qatar Switchboards Market and publishes its comprehensive annual report, highlighting emerging trends, growth drivers, revenue analysis, and forecast outlook. Our insights help businesses to make data-backed strategic decisions with ongoing market dynamics. Our analysts track relevent industries related to the Qatar Switchboards Market, allowing our clients with actionable intelligence and reliable forecasts tailored to emerging regional needs.
Yes, we provide customisation as per your requirements. To learn more, feel free to contact us on sales@6wresearch.com
1 Executive Summary |
2 Introduction |
2.1 Key Highlights of the Report |
2.2 Report Description |
2.3 Market Scope & Segmentation |
2.4 Research Methodology |
2.5 Assumptions |
3 Qatar Switchboards Market Overview |
3.1 Qatar Country Macro Economic Indicators |
3.2 Qatar Switchboards Market Revenues & Volume, 2022 & 2032F |
3.3 Qatar Switchboards Market - Industry Life Cycle |
3.4 Qatar Switchboards Market - Porter's Five Forces |
3.5 Qatar Switchboards Market Revenues & Volume Share, By Type, 2022 & 2032F |
3.6 Qatar Switchboards Market Revenues & Volume Share, By End-users, 2022 & 2032F |
4 Qatar Switchboards Market Dynamics |
4.1 Impact Analysis |
4.2 Market Drivers |
4.3 Market Restraints |
5 Qatar Switchboards Market Trends |
6 Qatar Switchboards Market, By Types |
6.1 Qatar Switchboards Market, By Type |
6.1.1 Overview and Analysis |
6.1.2 Qatar Switchboards Market Revenues & Volume, By Type, 2022-2032F |
6.1.3 Qatar Switchboards Market Revenues & Volume, By Low-Voltage, 2022-2032F |
6.1.4 Qatar Switchboards Market Revenues & Volume, By Middle-Voltage, 2022-2032F |
6.1.5 Qatar Switchboards Market Revenues & Volume, By High-Voltage, 2022-2032F |
6.2 Qatar Switchboards Market, By End-users |
6.2.1 Overview and Analysis |
6.2.2 Qatar Switchboards Market Revenues & Volume, By Industrial, 2022-2032F |
6.2.3 Qatar Switchboards Market Revenues & Volume, By Residential, 2022-2032F |
6.2.4 Qatar Switchboards Market Revenues & Volume, By Commercial, 2022-2032F |
6.2.5 Qatar Switchboards Market Revenues & Volume, By Other, 2022-2032F |
7 Qatar Switchboards Market Import-Export Trade Statistics |
7.1 Qatar Switchboards Market Export to Major Countries |
7.2 Qatar Switchboards Market Imports from Major Countries |
8 Qatar Switchboards Market Key Performance Indicators |
9 Qatar Switchboards Market - Opportunity Assessment |
9.1 Qatar Switchboards Market Opportunity Assessment, By Type, 2022 & 2032F |
9.2 Qatar Switchboards Market Opportunity Assessment, By End-users, 2022 & 2032F |
10 Qatar Switchboards Market - Competitive Landscape |
10.1 Qatar Switchboards Market Revenue Share, By Companies, 2025 |
10.2 Qatar Switchboards Market Competitive Benchmarking, By Operating and Technical Parameters |
11 Company Profiles |
12 Recommendations |
13 Disclaimer |
Global Go To Market Strategy - 2030
Export potential enables firms to identify high-growth global markets with greater confidence by combining advanced trade intelligence with a structured quantitative methodology. The framework analyzes emerging demand trends and country-level import patterns while integrating macroeconomic and trade datasets such as GDP and population forecasts, bilateral import–export flows, tariff structures, elasticity differentials between developed and developing economies, geographic distance, and import demand projections. Using weighted trade values from 2020–2024 as the base period to project country-to-country export potential for 2030, these inputs are operationalized through calculated drivers such as gravity model parameters, tariff impact factors, and projected GDP per-capita growth. Through an analysis of hidden potentials, demand hotspots, and market conditions that are most favorable to success, this method enables firms to focus on target countries, maximize returns, and global expansion with data, backed by accuracy.
By factoring in the projected importer demand gap that is currently unmet and could be potential opportunity, it identifies the potential for the Exporter (Country) among 190 countries, against the general trade analysis, which identifies the biggest importer or exporter.
To discover high-growth global markets and optimize your business strategy:
Click Here
Pricing
- Single User License$ 1,995
- Department License$ 2,400
- Site License$ 3,120
- Global License$ 3,795

Leadership Perspectives from Industry Events
Search
Thought Leadership and Analyst Meet


Our Clients
6WResearch In News
- India Air Conditioner Market Set for Strong Rebound in 2026 After Weather-Led Correction and GST-Driven Recovery: 6Wresearch
- ADAS in India: How Automatic Emergency Braking, Blind Spot Detection & Driver Monitoring are Transforming Road Safety
- Doha a strategic location for EV manufacturing hub: IPA Qatar
- Demand for luxury TVs surging in the GCC, says Samsung
- Empowering Growth: The Thriving Journey of Bangladesh’s Cable Industry
- Demand for luxury TVs surging in the GCC, says Samsung
Latest Reports
- Poland Fire Protection Systems Market (2026-2032)
- Cape Verde Portable Hand-Thrown Extinguisher Market (2026-2032)
- Canada Portable Hand-Thrown Extinguisher Market (2026-2032)
- Cameroon Portable Hand-Thrown Extinguisher Market (2026-2032)
- Burundi Portable Hand-Thrown Extinguisher Market (2026-2032)
- Burkina Faso Portable Hand-Thrown Extinguisher Market (2026-2032)
- Bulgaria Portable Hand-Thrown Extinguisher Market (2026-2032)
- Brunei Portable Hand-Thrown Extinguisher Market (2026-2032)
- Botswana Portable Hand-Thrown Extinguisher Market (2026-2032)
- Bosnia and Herzegovina Portable Hand-Thrown Extinguisher Market (2026-2032)
Industry Events and Analyst Meet

HIMTEX 2026

India Refining Summit 2026

India EV Show 2026

EV tech India Expo 2026

Auto Tech Asia 2026
Whitepaper
- Middle East & Africa Commercial Security Market Click here to view more.
- Middle East & Africa Fire Safety Systems & Equipment Market Click here to view more.
- GCC Drone Market Click here to view more.
- Middle East Lighting Fixture Market Click here to view more.
- GCC Physical & Perimeter Security Market Click here to view more.