Qatar Tables Market (2026-2032) | Industry, Size, Trends, Growth, Value, Forecast, Analysis, Outlook, Companies, Revenue & Share
Market Forecast By Types (Fabric, Leather, Metal, Wooden, Others), By Applications (Family, Office, Others) And Competitive Landscape
| Product Code: ETC034681 | Publication Date: Jul 2023 | Updated Date: Jun 2026 | Product Type: Report | |
| Publisher: 6Wresearch | Author: Ravi Bhandari | No. of Pages: 70 | No. of Figures: 35 | No. of Tables: 5 |
Qatar Tables Market Summary
The qatar tables market was estimated at USD 497 Million in 2025 and is projected to reach USD 668 Million by 2032, growing at a CAGR of 5.0% from 2026 to 2032.
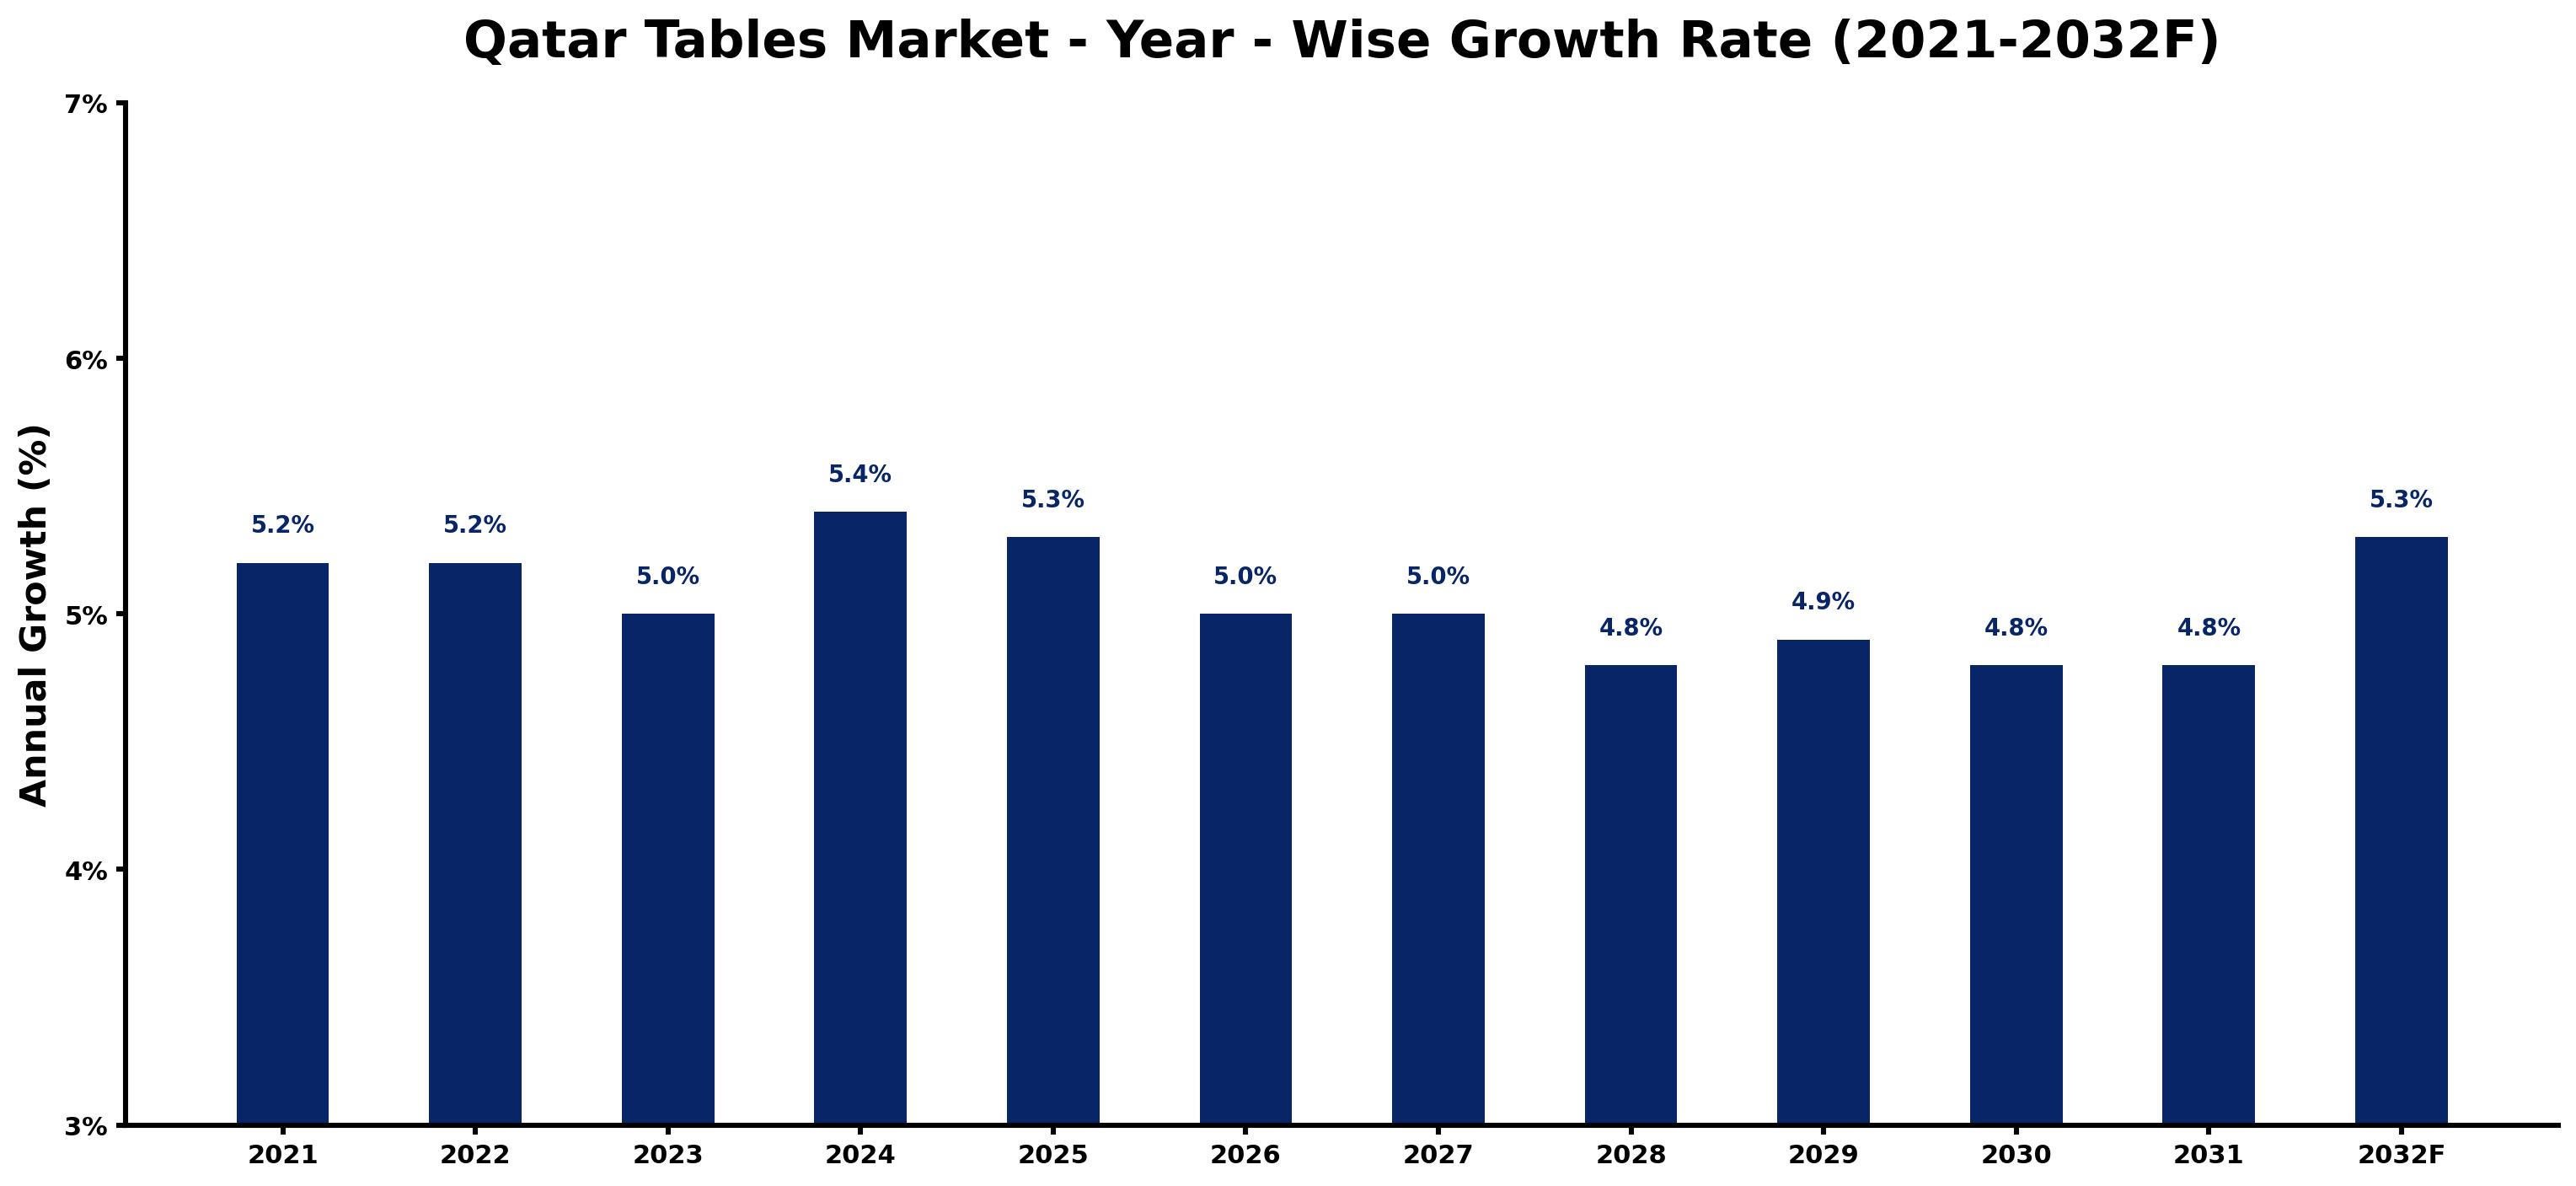
Qatar Tables Market Growth Rate Analysis (2021-2032)
The Qatar tables market has exhibited stable growth over the past several years, with notable increases of 5.2% in both 2021 and 2022. This robust expansion can be attributed to rising consumer demand and strategic investments in infrastructure ahead of global events, enhancing visibility for local products. As we moved into 2023, growth dipped slightly to 5.0%, impacted by supply chain disruptions and shifting consumer preferences. However, forecasts suggest a rebound, with a projected 5.4% growth in 2024, driven by advancements in technology and sustainable materials. By 2030, growth is expected to stabilize around 4.8%, reflecting a mature market adjusting to evolving consumer trends and economic conditions.
Qatar Tables Market Year-wise Growth Rate and Key Drivers
This graph highlights how the Qatar Tables Market has steadily grown over the past five years, supported by major growth factors.
The table below presents the year wise growth rates along with the key drivers influencing the market
| Year | Growth Rate | Major Drivers |
| 2021 | 5.2% | Post-lockdown retail projects initiated, enhancing furniture demand in hospitality and residential sectors. |
| 2022 | 5.2% | Increased expatriate population spurs interest in diverse table styles and designs. |
| 2023 | 5.0% | High-end developments in Lusail generate significant demand for premium table collections. |
| 2024 | 5.4% | Growth in local manufacturing reduces costs and increases availability of custom tables. |
| 2025 | 5.3% | Sustainable materials gain traction, influencing consumer preferences towards eco-friendly table options. |
| 2026 | 5.0% | Cultural events increase social gatherings, driving up dining and coffee table sales. |
| 2027 | 5.0% | E-commerce platforms expand, facilitating easier access to various table styles and prices. |
| 2028 | 4.8% | Home office trends lead to higher demand for multifunctional and ergonomic table designs. |
| 2029 | 4.9% | International design trends affect local tastes, pushing demand for unique and modern tables. |
| 2030 | 4.8% | Investment in luxury hotels boosts orders for custom tables suited to high-end interiors. |
| 2031 | 4.8% | A focus on outdoor living spaces leads to growth in patio and garden table sales. |
| 2032 | 5.3% | Economic diversification encourages innovation in table design, catering to niche markets. |
Note - Market size estimations and growth projections presented in this report are based on 6Wresearch's advanced forecasting approach, validated with industry datasets as of June 2026.
Qatar Tables Market Synopsis
The Qatar Tables Market is projected to reach 5.0% and witness significant growth during the forecast period (2026-2032). Qatar stands as a vital contributor to global commodity markets, driven by its robust investments in oil, gas, and natural resources. Despite its small geographical footprint, Qatar is recognized as one of the leading exporters of liquefied natural gas (LNG) worldwide. The nation's strategic location along the Persian Gulf facilitates efficient access to regional markets, enhancing its position in international trade and logistics. Furthermore, Qatar's impressive living standards, characterized by low-income inequality, contribute positively to its economic landscape.
Qatar Tables Market Growth Drivers
The Qatar Tables Market is poised for expansion, driven by several key factors:
- The demand for LNG from Asian countries is expected to escalate, fueling growth within Qatar's energy sector. As these nations continue to industrialize and urbanize, their reliance on clean energy alternatives will play a crucial role in shaping Qatar's energy export dynamics.
- Government initiatives geared towards infrastructure development are forecasted to stimulate significant economic activity. Increased public spending on construction and urban planning will lead to greater demand for related services and products, translating into opportunities for market participants.
- The influx of foreign investments into Qatar's economy is anticipated to further catalyze growth. As international investors seek opportunities in the region, sectors linked to energy, infrastructure, and services are likely to experience heightened activity, positively impacting the Qatar Tables Market.
- Qatar's commitment to renewable energy development enhances sustainability initiatives, creating long-term growth prospects. The government's ambition to diversify energy sources aligns with global energy transitions and supports the market's resilience.
- Regional geopolitical stability and trade agreements bolster Qatar's economic landscape. By maintaining strong trading relationships with neighboring countries, Qatar enhances its market reach and operational capacity, positively influencing the Qatar Tables Market.
Qatar Tables Market Challenges and Restraints
While the Qatar Tables Market presents numerous growth opportunities, it also faces several challenges:
- The volatility in global oil prices poses a persistent threat to Qatar's economic stability. Fluctuating oil revenues can lead to budgetary constraints, affecting government spending on critical infrastructure projects that support the tables market.
- Infrastructure development costs have surged, creating financial pressures on the government's budget. This scenario could potentially delay or scale back key projects essential for market growth, affecting overall economic momentum.
- The impacts of the Covid-19 pandemic have reverberated through the economy, leading to reduced consumer spending and lower demand for energy exports, thereby affecting market performance. Recovery from this disruption will require adaptive strategies and resilience.
- Global economic uncertainty continues to influence investor confidence, leading to a cautious approach by potential foreign investors. This could result in slower capital inflows into the Qatar Tables Market, which may hinder growth prospects.
- Environmental considerations and regulatory challenges related to energy production could impose additional compliance costs on market participants. Firms must navigate these complexities while striving to maintain operational efficiency and sustainability.
Qatar Tables Market Government Investment and Initiatives
The Qatari government has undertaken various initiatives aimed at fostering growth within the economy and, by extension, the Qatar Tables Market. Key investments and policies include:
- The National Vision 2030 framework outlines ambitious plans for economic diversification, focusing on enhancing infrastructure and investing in human capital. This comprehensive strategy supports sustained economic growth across multiple sectors.
- Public spending on infrastructure projects such as roads, bridges, and housing is prioritized to boost economic activity. These developments are critical for improving logistics and service delivery, thereby positively impacting the tables market.
- Incentives for foreign direct investment (FDI) aim to attract global players to Qatari industries, enhancing market competitiveness. The government continually seeks to create a conducive business environment through regulatory reforms.
- Commitment to renewable energy through government-backed projects and partnerships is fundamental for sustainable economic development. Initiatives targeting solar and wind energy projects are set to enhance energy security and create new market opportunities.
- Strategic partnerships with private organizations encourage innovation and technology transfer. These collaborations aim to unlock new business potentials in the Qatar Tables Market, driving efficiency and profitability.
Qatar Tables Market Latest Developments (May 2025 - June 2026)
Recent developments in the Qatar Tables Market indicate a sector adapting to both domestic and international shifts. Innovations in energy practices have commenced as Qatar seeks to strengthen its position in global markets, particularly in LNG exports. Ongoing infrastructure projects, catalyzed by government spending, are expected to bolster economic resilience during this recovery phase. Furthermore, collaborations between governmental bodies and private sectors are emphasizing sustainable practices while enhancing market efficiency.
Qatar Tables Market - Key Attractiveness of the Report
- 10 Years of Market Numbers
- Historical Data Starting from 2022 to 2025
- Base Year: 2025
- Forecast Data until 2032
- Key Performance Indicators Impacting the Market
- Major Upcoming Developments and Projects
Key Highlights of the Report:
- Qatar Tables Market Outlook
- Market Size of Qatar Tables Market, 2025
- Forecast of Qatar Tables Market, 2032
- Historical Data and Forecast of Qatar Tables Revenues & Volume for the Period 2022-2032F
- Qatar Tables Market Trend Evolution
- Qatar Tables Market Drivers and Challenges
- Qatar Tables Price Trends
- Qatar Tables Porter's Five Forces
- Qatar Tables Industry Life Cycle
- Historical Data and Forecast of Qatar Tables Market Revenues & Volume By Types for the Period 2022-2032F
- Historical Data and Forecast of Qatar Tables Market Revenues & Volume By Fabric for the Period 2022-2032F
- Historical Data and Forecast of Qatar Tables Market Revenues & Volume By Leather for the Period 2022-2032F
- Historical Data and Forecast of Qatar Tables Market Revenues & Volume By Metal for the Period 2022-2032F
- Historical Data and Forecast of Qatar Tables Market Revenues & Volume By Wooden for the Period 2022-2032F
- Historical Data and Forecast of Qatar Tables Market Revenues & Volume By Others for the Period 2022-2032F
- Historical Data and Forecast of Qatar Tables Market Revenues & Volume By Applications for the Period 2022-2032F
- Historical Data and Forecast of Qatar Tables Market Revenues & Volume By Family for the Period 2022-2032F
- Historical Data and Forecast of Qatar Tables Market Revenues & Volume By Office for the Period 2022-2032F
- Historical Data and Forecast of Qatar Tables Market Revenues & Volume By Others for the Period 2022-2032F
- Qatar Tables Import Export Trade Statistics
- Market Opportunity Assessment By Types
- Market Opportunity Assessment By Applications
- Qatar Tables Top Companies Market Share
- Qatar Tables Competitive Benchmarking By Technical and Operational Parameters
- Qatar Tables Company Profiles
- Qatar Tables Key Strategic Recommendations
Frequently Asked Questions About the Market Study (FAQs):
While specific numbers are not disclosed, growth is anticipated due to increasing demand for LNG and government investments in infrastructure.
The government is investing heavily in infrastructure projects and encouraging foreign investments to promote economic diversification.
Challenges include fluctuations in oil prices, increased infrastructure costs, and the ongoing impacts of the Covid-19 pandemic.
Renewable energy initiatives are integral to Qatar's economic strategy, promoting sustainability and potentially unlocking new market opportunities.
6Wresearch actively monitors the Qatar Tables Market and publishes its comprehensive annual report, highlighting emerging trends, growth drivers, revenue analysis, and forecast outlook. Our insights help businesses to make data-backed strategic decisions with ongoing market dynamics. Our analysts track relevent industries related to the Qatar Tables Market, allowing our clients with actionable intelligence and reliable forecasts tailored to emerging regional needs.
Yes, we provide customisation as per your requirements. To learn more, feel free to contact us on sales@6wresearch.com
1 Executive Summary |
2 Introduction |
2.1 Key Highlights of the Report |
2.2 Report Description |
2.3 Market Scope & Segmentation |
2.4 Research Methodology |
2.5 Assumptions |
3 Qatar Tables Market Overview |
3.1 Qatar Country Macro Economic Indicators |
3.2 Qatar Tables Market Revenues & Volume, 2022 & 2032F |
3.3 Qatar Tables Market - Industry Life Cycle |
3.4 Qatar Tables Market - Porter's Five Forces |
3.5 Qatar Tables Market Revenues & Volume Share, By Types, 2022 & 2032F |
3.6 Qatar Tables Market Revenues & Volume Share, By Applications, 2022 & 2032F |
4 Qatar Tables Market Dynamics |
4.1 Impact Analysis |
4.2 Market Drivers |
4.3 Market Restraints |
5 Qatar Tables Market Trends |
6 Qatar Tables Market, By Types |
6.1 Qatar Tables Market, By Types |
6.1.1 Overview and Analysis |
6.1.2 Qatar Tables Market Revenues & Volume, By Types, 2022-2032F |
6.1.3 Qatar Tables Market Revenues & Volume, By Fabric, 2022-2032F |
6.1.4 Qatar Tables Market Revenues & Volume, By Leather, 2022-2032F |
6.1.5 Qatar Tables Market Revenues & Volume, By Metal, 2022-2032F |
6.1.6 Qatar Tables Market Revenues & Volume, By Wooden, 2022-2032F |
6.1.7 Qatar Tables Market Revenues & Volume, By Others, 2022-2032F |
6.2 Qatar Tables Market, By Applications |
6.2.1 Overview and Analysis |
6.2.2 Qatar Tables Market Revenues & Volume, By Family, 2022-2032F |
6.2.3 Qatar Tables Market Revenues & Volume, By Office, 2022-2032F |
6.2.4 Qatar Tables Market Revenues & Volume, By Others, 2022-2032F |
7 Qatar Tables Market Import-Export Trade Statistics |
7.1 Qatar Tables Market Export to Major Countries |
7.2 Qatar Tables Market Imports from Major Countries |
8 Qatar Tables Market Key Performance Indicators |
9 Qatar Tables Market - Opportunity Assessment |
9.1 Qatar Tables Market Opportunity Assessment, By Types, 2022 & 2032F |
9.2 Qatar Tables Market Opportunity Assessment, By Applications, 2022 & 2032F |
10 Qatar Tables Market - Competitive Landscape |
10.1 Qatar Tables Market Revenue Share, By Companies, 2025 |
10.2 Qatar Tables Market Competitive Benchmarking, By Operating and Technical Parameters |
11 Company Profiles |
12 Recommendations |
13 Disclaimer |
Global Go To Market Strategy - 2030
Export potential enables firms to identify high-growth global markets with greater confidence by combining advanced trade intelligence with a structured quantitative methodology. The framework analyzes emerging demand trends and country-level import patterns while integrating macroeconomic and trade datasets such as GDP and population forecasts, bilateral import–export flows, tariff structures, elasticity differentials between developed and developing economies, geographic distance, and import demand projections. Using weighted trade values from 2020–2024 as the base period to project country-to-country export potential for 2030, these inputs are operationalized through calculated drivers such as gravity model parameters, tariff impact factors, and projected GDP per-capita growth. Through an analysis of hidden potentials, demand hotspots, and market conditions that are most favorable to success, this method enables firms to focus on target countries, maximize returns, and global expansion with data, backed by accuracy.
By factoring in the projected importer demand gap that is currently unmet and could be potential opportunity, it identifies the potential for the Exporter (Country) among 190 countries, against the general trade analysis, which identifies the biggest importer or exporter.
To discover high-growth global markets and optimize your business strategy:
Click Here
Pricing
- Single User License$ 1,995
- Department License$ 2,400
- Site License$ 3,120
- Global License$ 3,795

Leadership Perspectives from Industry Events
Search
Thought Leadership and Analyst Meet


Our Clients
6WResearch In News
- India Air Conditioner Market Set for Strong Rebound in 2026 After Weather-Led Correction and GST-Driven Recovery: 6Wresearch
- ADAS in India: How Automatic Emergency Braking, Blind Spot Detection & Driver Monitoring are Transforming Road Safety
- Doha a strategic location for EV manufacturing hub: IPA Qatar
- Demand for luxury TVs surging in the GCC, says Samsung
- Empowering Growth: The Thriving Journey of Bangladesh’s Cable Industry
- Demand for luxury TVs surging in the GCC, says Samsung
Latest Reports
- Nicaragua RPG Gaming Market (2026-2032)
- New Zealand RPG Gaming Market (2026-2032)
- Netherlands RPG Gaming Market (2026-2032)
- Nauru RPG Gaming Market (2026-2032)
- Namibia RPG Gaming Market (2026-2032)
- Mozambique RPG Gaming Market (2026-2032)
- Montenegro RPG Gaming Market (2026-2032)
- Mongolia RPG Gaming Market (2026-2032)
- Monaco RPG Gaming Market (2026-2032)
- Micronesia RPG Gaming Market (2026-2032)
Industry Events and Analyst Meet

HIMTEX 2026

India Refining Summit 2026

India EV Show 2026

EV tech India Expo 2026

Auto Tech Asia 2026
Whitepaper
- Middle East & Africa Commercial Security Market Click here to view more.
- Middle East & Africa Fire Safety Systems & Equipment Market Click here to view more.
- GCC Drone Market Click here to view more.
- Middle East Lighting Fixture Market Click here to view more.
- GCC Physical & Perimeter Security Market Click here to view more.