Mexico Tables Market (2026-2032) | Companies, Size, Growth, Outlook, Industry, Share, Forecast, Analysis, Trends, Value & Revenue
Market Forecast By Types (Fabric, Leather, Metal, Wooden, Others), By Applications (Family, Office, Others) And Competitive Landscape
| Product Code: ETC034643 | Publication Date: Oct 2020 | Updated Date: Jun 2026 | Product Type: Report | |
| Publisher: 6Wresearch | Author: Ravi Bhandari | No. of Pages: 70 | No. of Figures: 35 | No. of Tables: 5 |
Mexico Tables Market Summary
The mexico tables market was estimated at USD 184 Million in 2025 and is projected to reach USD 211 Million by 2032, growing at a CAGR of 1.3% from 2026 to 2032.
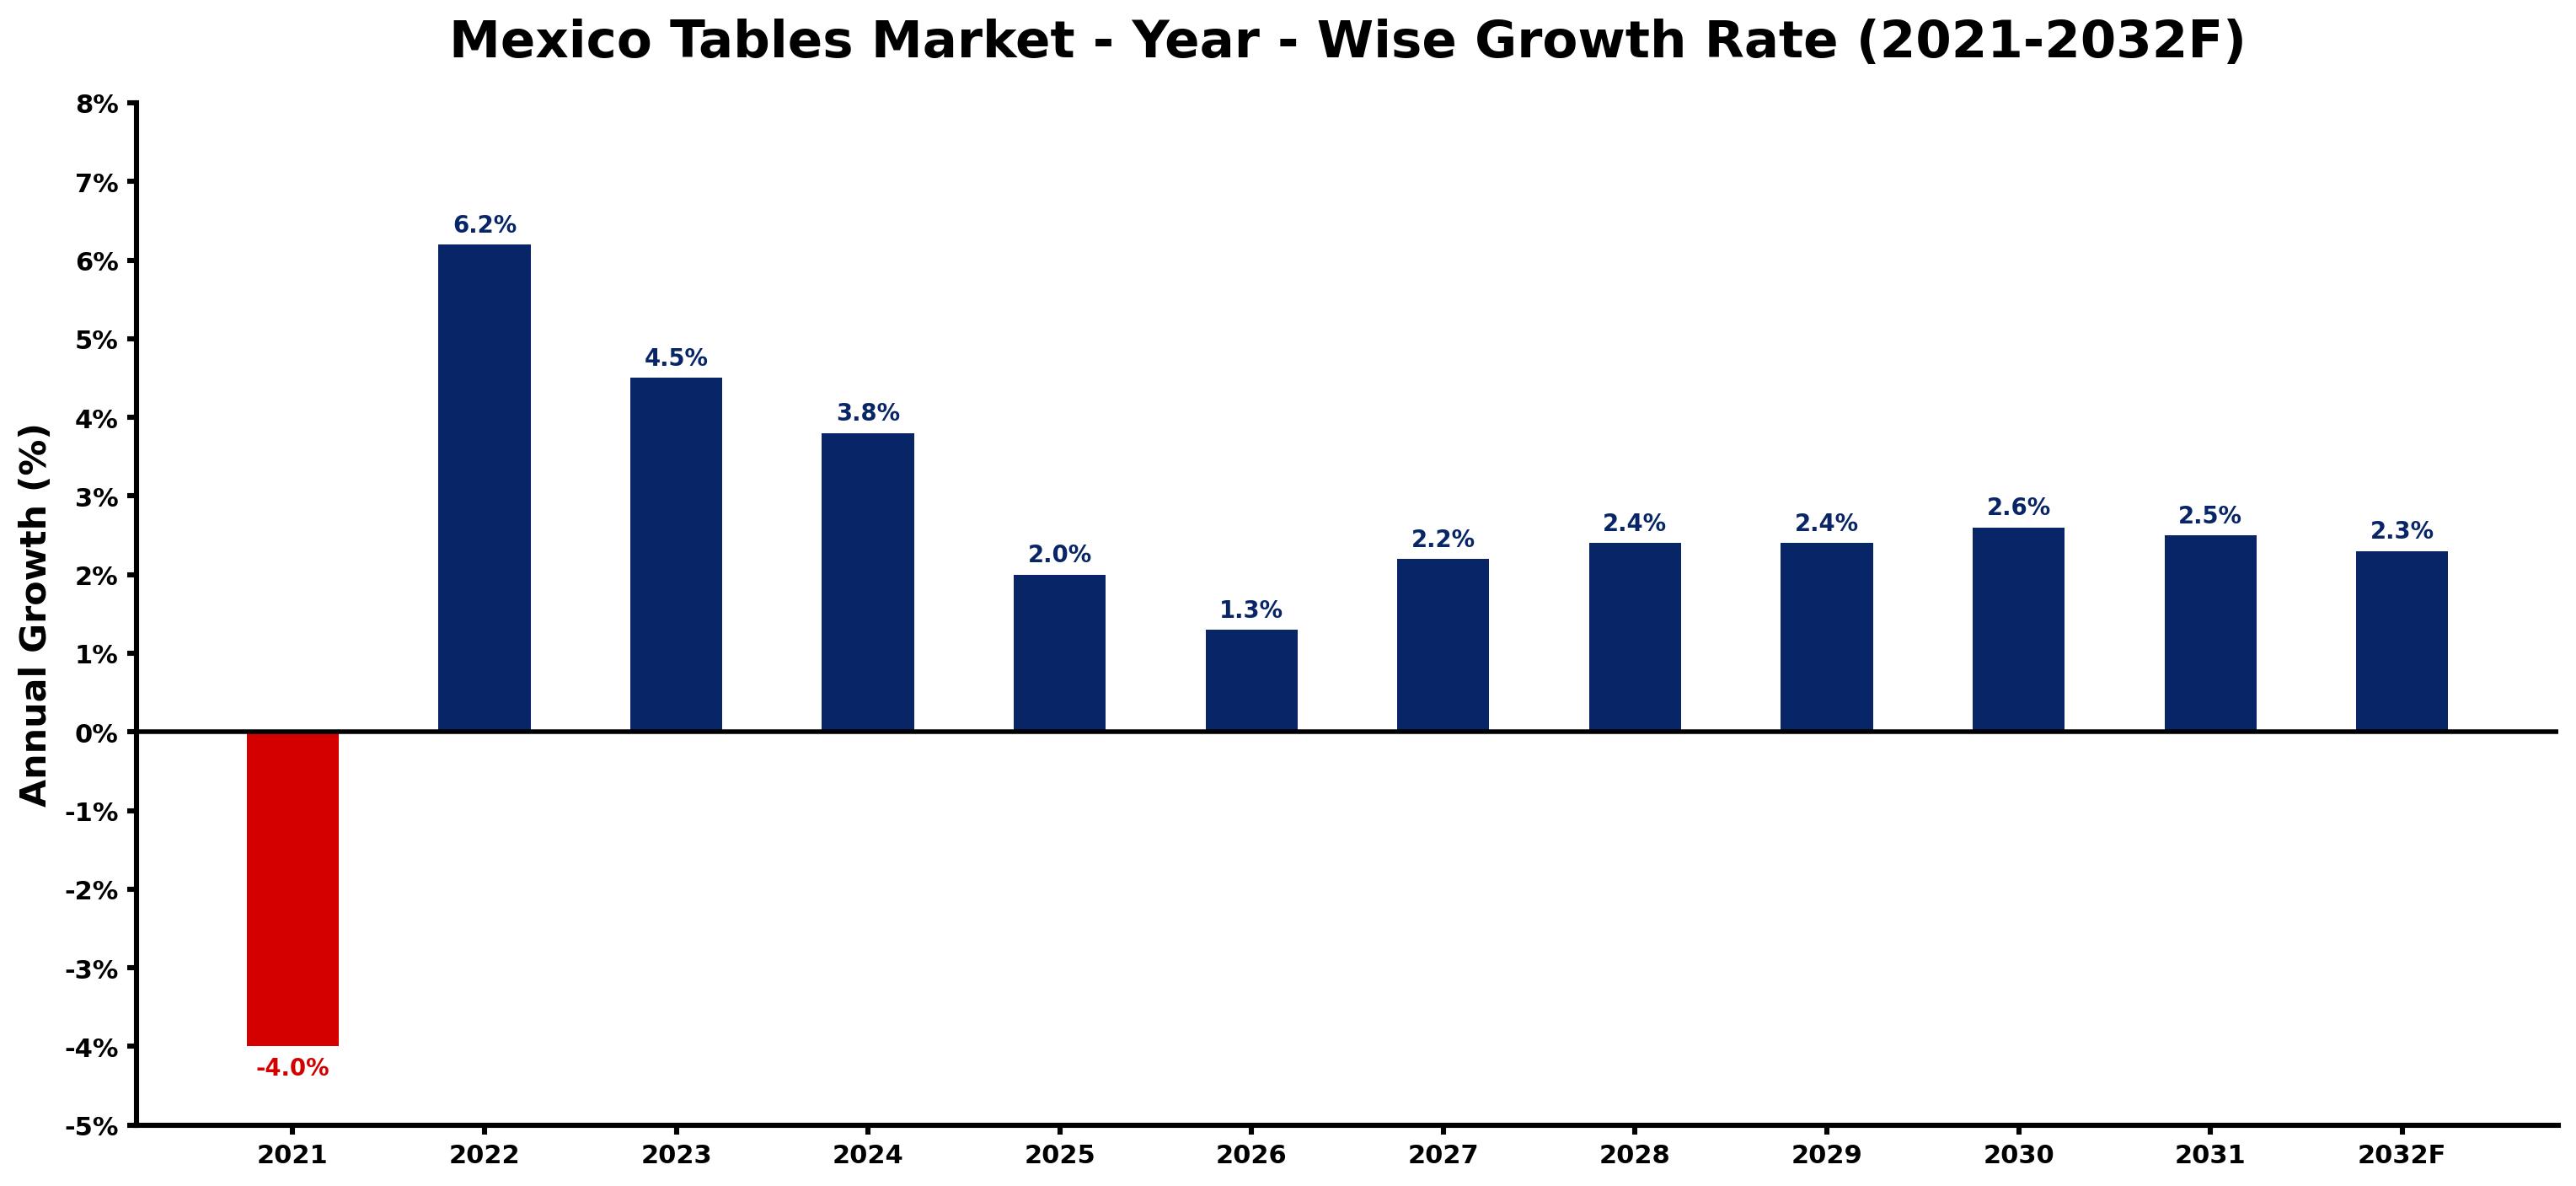
Mexico Tables Market Growth Rate Analysis (2021-2032)
The tables market in Mexico has shown a dynamic recovery following a decline of 4.0% in 2021, largely influenced by pandemic-related disruptions and shifting consumer preferences. The resurgence began in 2022, with growth registering at 6.2% as domestic manufacturing adapted to new consumer demands and online retail expanded. This upward trend continued into 2023 at 4.5%, supported by increased investment in residential and commercial spaces. While growth is expected to moderate at 3.8% in 2024, ongoing infrastructure developments and an emphasis on sustainable materials will drive demand into 2028 and beyond, stabilizing annual growth around 2.4% to 2.6% as the market balances modernization with traditional designs.
Mexico Tables Market Year-wise Growth Rate and Key Drivers
This graph highlights how the Mexico Tables Market has steadily grown over the past five years, supported by major growth factors.
The table below presents the year wise growth rates along with the key drivers influencing the market
| Year | Growth Rate | Major Drivers |
| 2021 | -4.0% | Supply chain disruptions and a shortage of key materials hindered production capabilities in the furniture sector. |
| 2022 | 6.2% | Local artisans began revitalizing traditional designs, appealing to cultural heritage enthusiasts. |
| 2023 | 4.5% | Increased urbanization prompted a greater focus on multifunctional furniture solutions in cities. |
| 2024 | 3.8% | Online retail platforms expanded, making furniture shopping more accessible across Mexico. |
| 2025 | 2.0% | Increasing disposable income shifted consumer preferences towards premium and artisanal table options. |
| 2026 | 1.3% | Sustainability trends encouraged eco-friendly materials and practices in table manufacturing. |
| 2027 | 2.2% | Outdoor furniture gained popularity as urban dwellers sought leisure spaces in small apartments. |
| 2028 | 2.4% | Technological innovations enabled customizable designs tailored to individual consumer preferences. |
| 2029 | 2.4% | Collaborations between designers and manufacturers introduced unique products to the market. |
| 2030 | 2.6% | Import tariffs influenced local production increases, bolstering domestic table manufacturing industries. |
| 2031 | 2.5% | Social media marketing grew essential, allowing brands to connect directly with consumers. |
| 2032 | 2.3% | A shift towards minimalism and functionality defined consumer tastes in table designs. |
Note - Market size estimations and growth projections presented in this report are based on 6Wresearch's advanced forecasting approach, validated with industry datasets as of June 2026.
Mexico Tables Market Synopsis
The Mexico Tables Market is projected to reach 1.3% and witness significant growth during the forecast period (2026-2032). This market encompasses a wide array of table types, catering to both residential and commercial sectors. The design focus on functional and aesthetically pleasing attributes is driving an increased demand for various table categories, including dining tables, office desks, and outdoor furniture. Market participants are responding to this demand by incorporating innovative materials and versatile designs to create customizable solutions tailored to the evolving preferences of consumers and businesses.
Mexico Tables Market Growth Drivers
The growth of the Mexico Tables Market is significantly influenced by several key factors:
- Increased Investment in Hospitality: As the hospitality sector continues to expand in Mexico, the demand for dining and outdoor tables has risen, fueling market growth.
- Growth in Residential Development: The ongoing construction of residential properties is accompanied by a heightened interest in home furnishings, particularly tables that combine functionality and style.
- Office Space Expansion: The growth of co-working spaces and the need for ergonomic office furniture are driving the demand for office desks, positively impacting the tables market.
- Shifts in Consumer Preferences: There is a noticeable trend towards customizable and multifunctional furniture, leading manufacturers to innovate continually to meet diverse consumer needs.
- Sustainability Trends: As consumers have become more environmentally conscious, the demand for sustainable and eco-friendly table designs is rising, driving manufacturers to adapt to these preferences.
Mexico Tables Market Challenges and Restraints
The Mexico Tables Market faces various challenges that could impact its trajectory:
- Competition from International Manufacturers: Local producers are experiencing increased competition from global companies, leading to pricing pressures and necessitating a focus on product differentiation.
- Environmental Sustainability Obligations: Adhering to sustainable practices can require significant investments in research and development, which may pose a challenge, especially for smaller manufacturers.
- Supply Chain Vulnerabilities: Disruptions in supply chains due to global events can lead to delays in production and delivery, impacting market stability.
- Compliance with Regulations: The furniture sector must navigate complex regulatory environments related to product safety and standards, which can increase operational costs.
- Market Saturation: An oversaturated market with a wide variety of products can lead to consumer confusion and make it difficult for brands to establish strong market presence.
Mexico Tables Market Trends and Opportunities
Several emerging trends and opportunities are shaping the Mexico Tables Market:
- Innovative Material Usage: The introduction of new materials, including recycled and composite materials, offers opportunities for creating unique table designs that attract eco-conscious consumers.
- Technological Integration: The incorporation of technology into furniture design, such as built-in charging ports and smart functionalities, is becoming increasingly popular.
- Customization Options: The rise in consumer demand for personalized furniture solutions is prompting brands to offer customizable tables that cater to specific aesthetic and functional requirements.
- Online Sales Channels: The growth of e-commerce has created opportunities for table manufacturers to reach broader audiences and engage with consumers directly through online platforms.
- Increased Focus on Ergonomics: As health and wellness trends gain prominence, there is a significant opportunity for manufacturers to develop ergonomic table designs that promote better posture and comfort.
Mexico Tables Market Government Investment and Initiatives
The government's role in the Mexico Tables Market is crucial, with several initiatives aimed at enhancing the industry:
- Regulatory Standards: Government regulations ensure compliance with safety and quality standards, which helps maintain consumer trust and satisfaction within the market.
- Public Investment in Infrastructure: Ongoing investments in infrastructure, such as new commercial spaces and residential developments, indirectly boost the demand for tables.
- Incentives for Sustainable Practices: The government encourages businesses to adopt eco-friendly practices, often providing incentives for the use of sustainable materials and production processes.
- Support for Local Manufacturing: Policies aimed at supporting local manufacturers through grants and funding help establish a more resilient furniture industry.
- Promotion of Exports: Government initiatives designed to promote the export of Mexican manufactured furniture, including tables, can open up new markets for domestic producers.
Mexico Tables Market Latest Developments (May 2025 - June 2026)
Recent developments in the Mexico Tables Market have highlighted a shift towards innovation and sustainability:
- An increase in collaborations between designers and manufacturers has led to the creation of unique, stylish tables that cater to a diverse clientele.
- Industry stakeholders are increasingly prioritizing the use of sustainable materials, responding to consumer demand for environmentally friendly products.
- The rise of online platforms has caused many manufacturers to adapt their sales strategies, increasing their digital presence to better reach consumers.
- Attendees at furniture expos have noted a focus on multifunctional designs that cater to smaller living spaces, aligning with urbanization trends in Mexico.
- Manufacturers are adopting smart technology integration to enhance the functionality of tables, thereby appealing to tech-savvy consumers.
Mexico Tables Market - Key Attractiveness of the Report
- 10 Years of Market Numbers
- Historical Data Starting from 2022 to 2025
- Base Year: 2025
- Forecast Data until 2032
- Key Performance Indicators Impacting the Market
- Major Upcoming Developments and Projects
Key Highlights of the Report:
- Mexico Tables Market Outlook
- Market Size of Mexico Tables Market, 2025
- Forecast of Mexico Tables Market, 2032
- Historical Data and Forecast of Mexico Tables Revenues & Volume for the Period 2022-2032F
- Mexico Tables Market Trend Evolution
- Mexico Tables Market Drivers and Challenges
- Mexico Tables Price Trends
- Mexico Tables Porter's Five Forces
- Mexico Tables Industry Life Cycle
- Historical Data and Forecast of Mexico Tables Market Revenues & Volume By Types for the Period 2022-2032F
- Historical Data and Forecast of Mexico Tables Market Revenues & Volume By Fabric for the Period 2022-2032F
- Historical Data and Forecast of Mexico Tables Market Revenues & Volume By Leather for the Period 2022-2032F
- Historical Data and Forecast of Mexico Tables Market Revenues & Volume By Metal for the Period 2022-2032F
- Historical Data and Forecast of Mexico Tables Market Revenues & Volume By Wooden for the Period 2022-2032F
- Historical Data and Forecast of Mexico Tables Market Revenues & Volume By Others for the Period 2022-2032F
- Historical Data and Forecast of Mexico Tables Market Revenues & Volume By Applications for the Period 2022-2032F
- Historical Data and Forecast of Mexico Tables Market Revenues & Volume By Family for the Period 2022-2032F
- Historical Data and Forecast of Mexico Tables Market Revenues & Volume By Office for the Period 2022-2032F
- Historical Data and Forecast of Mexico Tables Market Revenues & Volume By Others for the Period 2022-2032F
- Mexico Tables Import Export Trade Statistics
- Market Opportunity Assessment By Types
- Market Opportunity Assessment By Applications
- Mexico Tables Top Companies Market Share
- Mexico Tables Competitive Benchmarking By Technical and Operational Parameters
- Mexico Tables Company Profiles
- Mexico Tables Key Strategic Recommendations
Frequently Asked Questions About the Market Study (FAQs):
The growth is primarily driven by increased investments in hospitality, residential development, and the expansion of office spaces, alongside shifting consumer preferences.
Key challenges include competition from international manufacturers, sustainability compliance, and market saturation affecting pricing strategies.
The government supports the market through regulatory standards, public investment in infrastructure, and incentives for sustainable practices.
Emerging trends include the use of innovative materials, technological integration in designs, and a growing focus on customization options to meet diverse consumer needs.
6Wresearch actively monitors the Mexico Tables Market and publishes its comprehensive annual report, highlighting emerging trends, growth drivers, revenue analysis, and forecast outlook. Our insights help businesses to make data-backed strategic decisions with ongoing market dynamics. Our analysts track relevent industries related to the Mexico Tables Market, allowing our clients with actionable intelligence and reliable forecasts tailored to emerging regional needs.
Yes, we provide customisation as per your requirements. To learn more, feel free to contact us on sales@6wresearch.com
1 Executive Summary |
2 Introduction |
2.1 Key Highlights of the Report |
2.2 Report Description |
2.3 Market Scope & Segmentation |
2.4 Research Methodology |
2.5 Assumptions |
3 Mexico Tables Market Overview |
3.1 Mexico Country Macro Economic Indicators |
3.2 Mexico Tables Market Revenues & Volume, 2022 & 2032F |
3.3 Mexico Tables Market - Industry Life Cycle |
3.4 Mexico Tables Market - Porter's Five Forces |
3.5 Mexico Tables Market Revenues & Volume Share, By Types, 2022 & 2032F |
3.6 Mexico Tables Market Revenues & Volume Share, By Applications, 2022 & 2032F |
4 Mexico Tables Market Dynamics |
4.1 Impact Analysis |
4.2 Market Drivers |
4.2.1 Growing tourism industry in Mexico leading to increased demand for tables in hotels, restaurants, and resorts. |
4.2.2 Rising disposable income and urbanization driving higher demand for furniture, including tables, in residential spaces. |
4.2.3 Expansion of the hospitality sector in Mexico boosting the need for tables in new establishments. |
4.3 Market Restraints |
4.3.1 Fluctuating raw material prices impacting the manufacturing cost of tables. |
4.3.2 Economic instability and currency fluctuations affecting consumer spending on non-essential items like tables. |
4.3.3 Intense competition from domestic and international table manufacturers leading to pricing pressures. |
5 Mexico Tables Market Trends |
6 Mexico Tables Market, By Types |
6.1 Mexico Tables Market, By Types |
6.1.1 Overview and Analysis |
6.1.2 Mexico Tables Market Revenues & Volume, By Types, 2022-2032F |
6.1.3 Mexico Tables Market Revenues & Volume, By Fabric, 2022-2032F |
6.1.4 Mexico Tables Market Revenues & Volume, By Leather, 2022-2032F |
6.1.5 Mexico Tables Market Revenues & Volume, By Metal, 2022-2032F |
6.1.6 Mexico Tables Market Revenues & Volume, By Wooden, 2022-2032F |
6.1.7 Mexico Tables Market Revenues & Volume, By Others, 2022-2032F |
6.2 Mexico Tables Market, By Applications |
6.2.1 Overview and Analysis |
6.2.2 Mexico Tables Market Revenues & Volume, By Family, 2022-2032F |
6.2.3 Mexico Tables Market Revenues & Volume, By Office, 2022-2032F |
6.2.4 Mexico Tables Market Revenues & Volume, By Others, 2022-2032F |
7 Mexico Tables Market Import-Export Trade Statistics |
7.1 Mexico Tables Market Export to Major Countries |
7.2 Mexico Tables Market Imports from Major Countries |
8 Mexico Tables Market Key Performance Indicators |
8.1 Average order value per customer in the tables market. |
8.2 Percentage of repeat customers indicating customer loyalty and satisfaction. |
8.3 Number of new product launches and innovations in the tables market. |
8.4 Employee productivity and efficiency in table manufacturing processes. |
8.5 Customer satisfaction ratings related to table quality and design. |
9 Mexico Tables Market - Opportunity Assessment |
9.1 Mexico Tables Market Opportunity Assessment, By Types, 2022 & 2032F |
9.2 Mexico Tables Market Opportunity Assessment, By Applications, 2022 & 2032F |
10 Mexico Tables Market - Competitive Landscape |
10.1 Mexico Tables Market Revenue Share, By Companies, 2025 |
10.2 Mexico Tables Market Competitive Benchmarking, By Operating and Technical Parameters |
11 Company Profiles |
12 Recommendations |
13 Disclaimer |
Global Go To Market Strategy - 2030
Export potential enables firms to identify high-growth global markets with greater confidence by combining advanced trade intelligence with a structured quantitative methodology. The framework analyzes emerging demand trends and country-level import patterns while integrating macroeconomic and trade datasets such as GDP and population forecasts, bilateral import–export flows, tariff structures, elasticity differentials between developed and developing economies, geographic distance, and import demand projections. Using weighted trade values from 2020–2024 as the base period to project country-to-country export potential for 2030, these inputs are operationalized through calculated drivers such as gravity model parameters, tariff impact factors, and projected GDP per-capita growth. Through an analysis of hidden potentials, demand hotspots, and market conditions that are most favorable to success, this method enables firms to focus on target countries, maximize returns, and global expansion with data, backed by accuracy.
By factoring in the projected importer demand gap that is currently unmet and could be potential opportunity, it identifies the potential for the Exporter (Country) among 190 countries, against the general trade analysis, which identifies the biggest importer or exporter.
To discover high-growth global markets and optimize your business strategy:
Click Here
Pricing
- Single User License$ 1,995
- Department License$ 2,400
- Site License$ 3,120
- Global License$ 3,795

Leadership Perspectives from Industry Events
Search
Thought Leadership and Analyst Meet


Our Clients
6WResearch In News
- India Air Conditioner Market Set for Strong Rebound in 2026 After Weather-Led Correction and GST-Driven Recovery: 6Wresearch
- ADAS in India: How Automatic Emergency Braking, Blind Spot Detection & Driver Monitoring are Transforming Road Safety
- Doha a strategic location for EV manufacturing hub: IPA Qatar
- Demand for luxury TVs surging in the GCC, says Samsung
- Empowering Growth: The Thriving Journey of Bangladesh’s Cable Industry
- Demand for luxury TVs surging in the GCC, says Samsung
Latest Reports
- Poland Fire Protection Systems Market (2026-2032)
- Cape Verde Portable Hand-Thrown Extinguisher Market (2026-2032)
- Canada Portable Hand-Thrown Extinguisher Market (2026-2032)
- Cameroon Portable Hand-Thrown Extinguisher Market (2026-2032)
- Burundi Portable Hand-Thrown Extinguisher Market (2026-2032)
- Burkina Faso Portable Hand-Thrown Extinguisher Market (2026-2032)
- Bulgaria Portable Hand-Thrown Extinguisher Market (2026-2032)
- Brunei Portable Hand-Thrown Extinguisher Market (2026-2032)
- Botswana Portable Hand-Thrown Extinguisher Market (2026-2032)
- Bosnia and Herzegovina Portable Hand-Thrown Extinguisher Market (2026-2032)
Industry Events and Analyst Meet

HIMTEX 2026

India Refining Summit 2026

India EV Show 2026

EV tech India Expo 2026

Auto Tech Asia 2026
Whitepaper
- Middle East & Africa Commercial Security Market Click here to view more.
- Middle East & Africa Fire Safety Systems & Equipment Market Click here to view more.
- GCC Drone Market Click here to view more.
- Middle East Lighting Fixture Market Click here to view more.
- GCC Physical & Perimeter Security Market Click here to view more.