Brazil Tables Market (2026-2032) | Forecast, Trends, Revenue, Industry, Share, Value, Outlook, Analysis, Companies, Growth & Size
Market Forecast By Types (Fabric, Leather, Metal, Wooden, Others), By Applications (Family, Office, Others) And Competitive Landscape
| Product Code: ETC034642 | Publication Date: Oct 2020 | Updated Date: Jun 2026 | Product Type: Report | |
| Publisher: 6Wresearch | Author: Ravi Bhandari | No. of Pages: 70 | No. of Figures: 35 | No. of Tables: 5 |
Brazil Tables Market Summary
The brazil tables market was estimated at USD 165 Million in 2025 and is projected to reach USD 196 Million by 2032, growing at a CAGR of 2.8% from 2026 to 2032.
Brazil Tables Market Growth Rate Analysis (2021-2032)
The Brazilian tables market has displayed a notable upward trend after a decline of 1.2% in 2021. Driven by a rebound in consumer demand and increased investments in home furnishing, growth surged to 4.8% in 2022, with subsequent increases of 3.6% in 2023 and 4.5% projected for 2024. This resurgence can be attributed to a combination of rising disposable incomes and a growing preference for versatile, multi-functional furniture that aligns with contemporary lifestyles. However, growth rates are expected to moderate to around 2.9% by 2027, reflecting potential market saturation and shifts in consumer behavior as digitalization continues to reshape purchasing habits.
Brazil Tables Market Year-wise Growth Rate and Key Drivers
This graph highlights how the Brazil Tables Market has steadily grown over the past five years, supported by major growth factors.
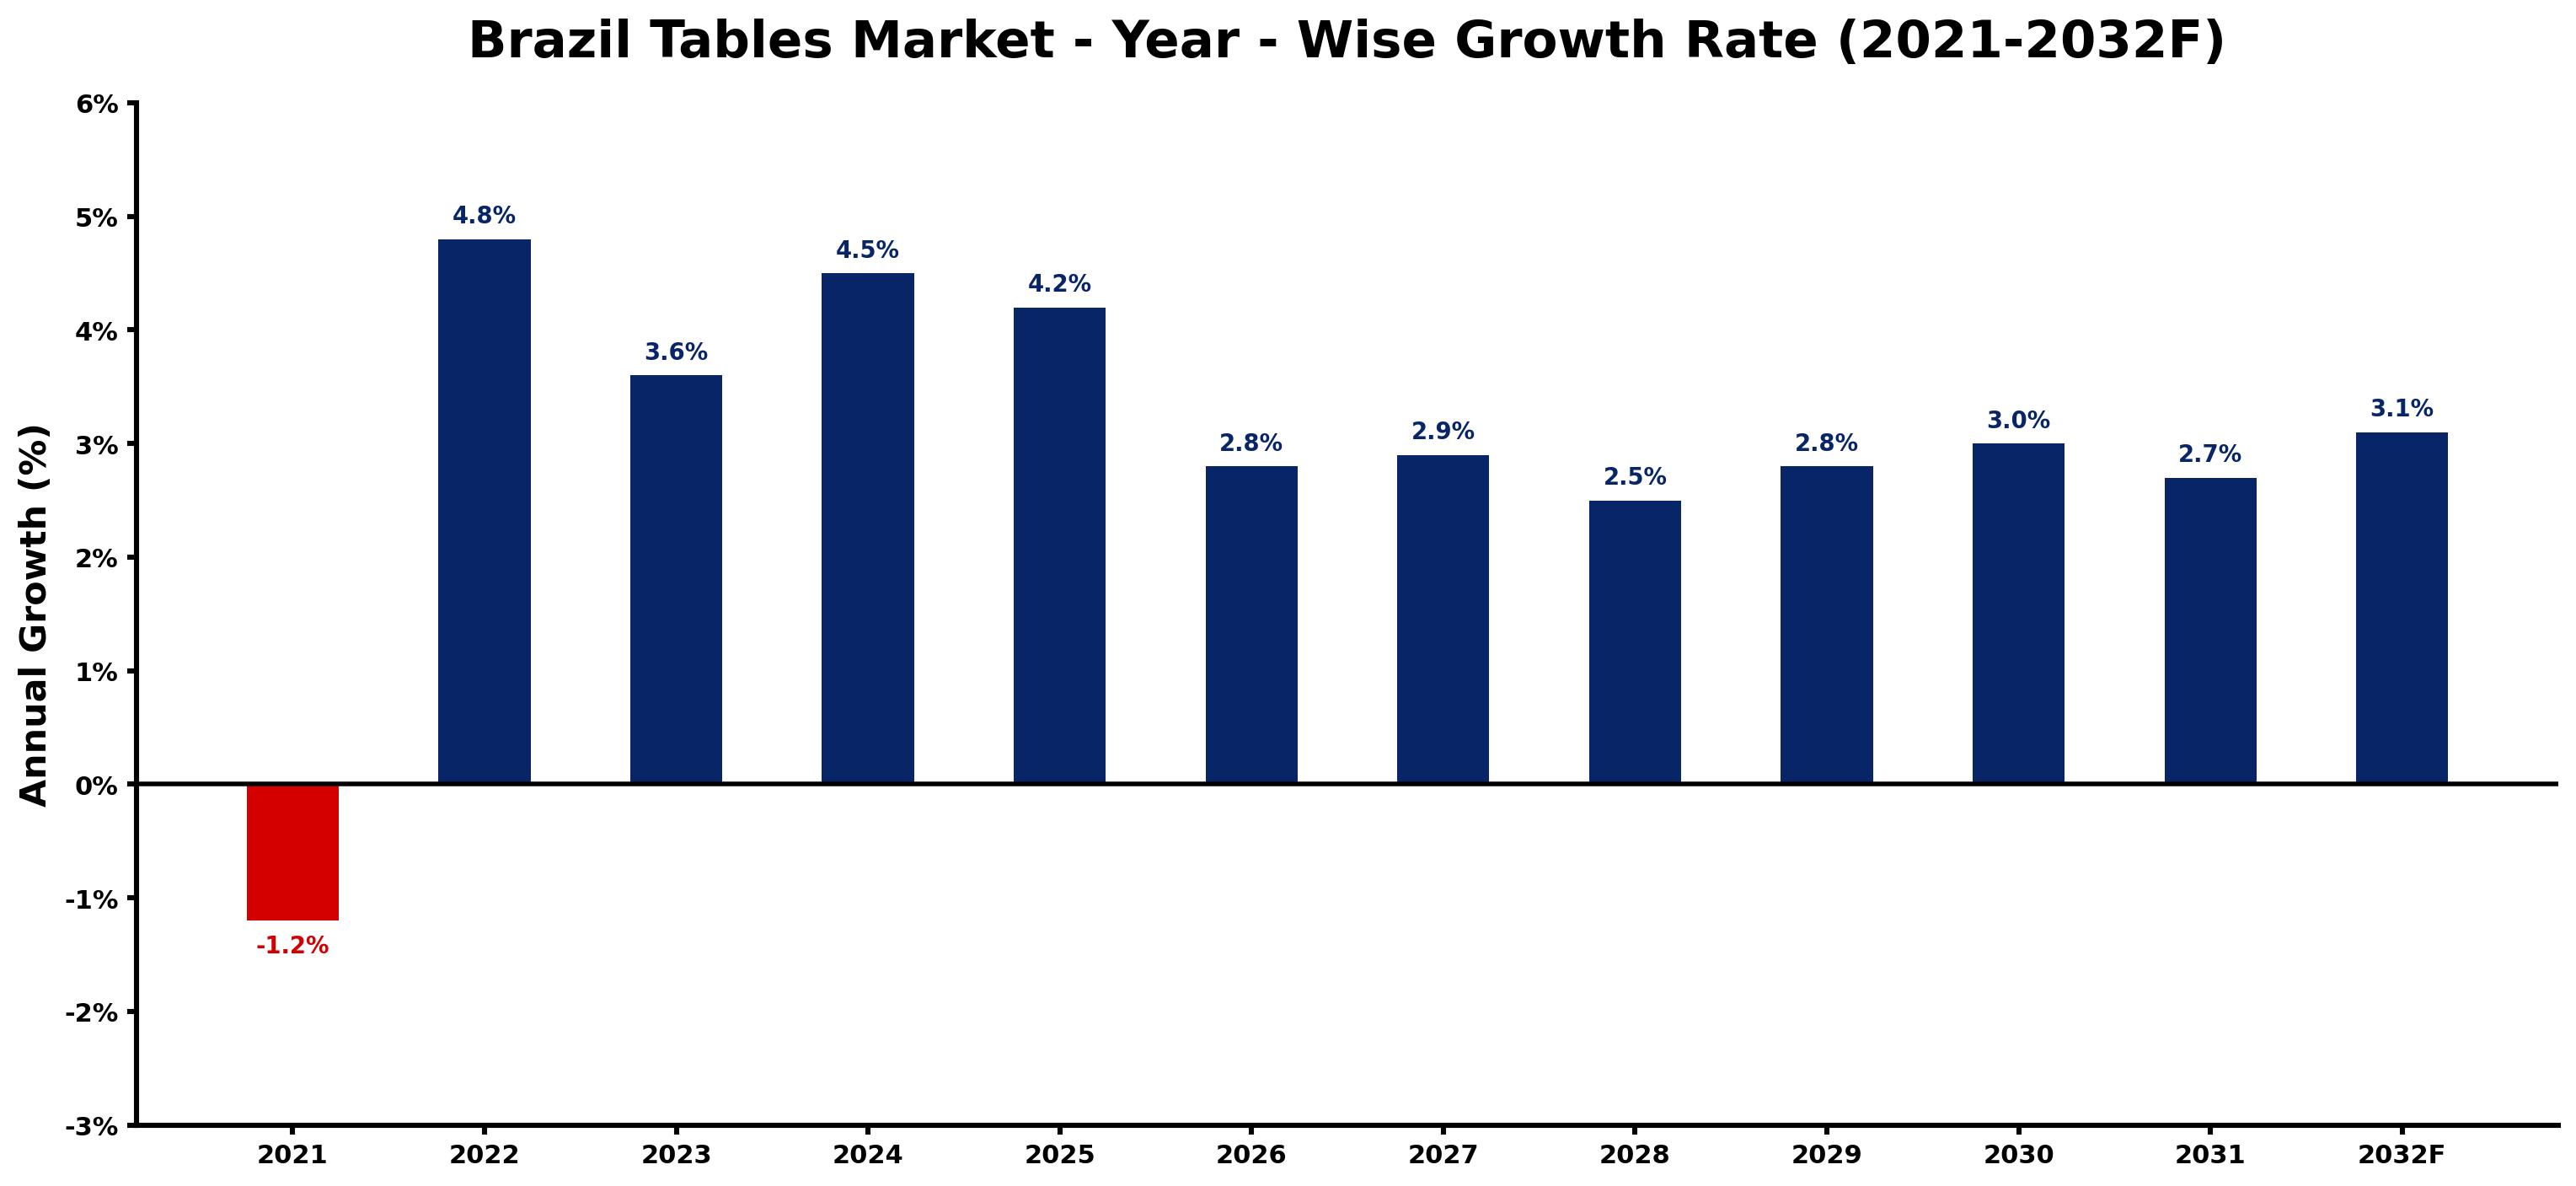
The table below presents the year wise growth rates along with the key drivers influencing the market
| Year | Growth Rate | Major Drivers |
| 2021 | -1.2% | Supply chain disruptions limited availability of quality materials, hindering production and reducing overall market supply for tables. |
| 2022 | 4.8% | E-commerce platforms expanding, enhancing accessibility to diverse table designs. |
| 2023 | 3.6% | Urbanization trends causing increased demand for multifunctional furniture solutions. |
| 2024 | 4.5% | Rising disposable incomes allowing consumers to invest in premium furniture offerings. |
| 2025 | 4.2% | Cultural influences driving interest in regional artisan furniture craftsmanship. |
| 2026 | 2.8% | Technological innovations enabling customized table designs and rapid production cycles. |
| 2027 | 2.9% | Increased focus on interior design trends elevating demand for aesthetic dining solutions. |
| 2028 | 2.5% | Collaborative living spaces gaining popularity, emphasizing shared furniture functionalities. |
| 2029 | 2.8% | Sustainability certifications becoming essential for consumers when choosing furniture products. |
| 2030 | 3.0% | Home office setups prompting demand for versatile tables catering to work-from-home needs. |
| 2031 | 2.7% | Expanding middle class nurturing a market for affordable yet stylish furniture options. |
| 2032 | 3.1% | Investment in local manufacturing promising to reduce costs and improve supply chains. |
Note - Market size estimations and growth projections presented in this report are based on 6Wresearch's advanced forecasting approach, validated with industry datasets as of June 2026.
Brazil Tables Market Synopsis
The Brazil Tables Market is projected to reach 2.8% and witness significant growth during the forecast period (2026-2032). As consumer preferences evolve towards contemporary and multifunctional designs, the market adapts to meet the demand for aesthetically appealing yet practical tables. This shift not only caters to residential needs but also spans corporate and public environment requirements.
Brazil Tables Market Growth Drivers
Several factors drive the growth of the Brazil Tables Market. The expanding hospitality sector plays a significant role, as hotels and restaurants increasingly seek unique table designs to enhance customer experience. Additionally, the boom in commercial spaces demands stylish functional furniture, particularly tables, which can harmonize with diverse interior styles. There is also a notable increase in overall construction activities across the country, providing ample opportunities for table manufacturers to cater to new residential and commercial developments.
- The growing use of tables in innovative office layouts reflects the demand for collaborative working spaces, urging businesses to invest in attractive yet functional furniture.
- Consumer trends emphasizing minimalism and multifunctionality lead to a rise in demand for space-saving tables that can serve multiple purposes, enhancing their appeal in urban environments.
- Increased disposable incomes among the Brazilian middle class are contributing to a willingness to invest in higher-quality furniture that marries style with functionality.
- Urbanization and migration to city centers further necessitate adaptable furniture solutions, placing unique demands on table designs to meet compact living conditions.
- The popularity of online furniture shopping provides consumers with greater access to diverse table designs, contributing to an increase in market competition and innovation.
Brazil Tables Market Challenges and Restraints
Despite its growth, the Brazil Tables Market faces several challenges that impact its trajectory. Rapidly changing design preferences compel manufacturers to remain agile, often requiring frequent updates to product lines which can be costly. Additionally, economic uncertainties, including fluctuating currency and inflation rates, may inhibit consumer spending on non-essential furniture, straining market expansion.
- The market's reliance on trends in lifestyle and interior design can lead to quick fluctuations in demand for specific table types, necessitating constant market monitoring.
- Import tariffs on raw materials can inflate production costs for manufacturers, potentially leading to higher prices for consumers and reducing overall market attractiveness.
- Environmental regulations around sustainable manufacturing practices require investment in eco-friendly materials and processes, which may not be feasible for all players in the market.
- Consumer education regarding functionality and design innovation may lag, hampering market growth as customers may prioritize cost over quality or design.
- Seasonal changes in buying patterns, particularly before major holidays, can create unpredictable sales cycles, complicating inventory and production management for manufacturers.
Brazil Tables Market Government Investment and Initiatives
Government policy plays a crucial role in shaping the Brazil Tables Market. Initiatives that promote ergonomic workplaces and sustainable production practices create a favorable environment for the furniture industry. Public spending often targets the refurbishment of public spaces, which includes the furnishing of tables in schools, parks, and government buildings, thereby stimulating demand.
- Programs encouraging eco-friendly manufacturing are pivotal, as they push companies to adopt practices that align with national sustainability goals.
- Local government incentives for businesses investing in innovative furniture design can catalyze advancements in the tables market.
- Policy initiatives aimed at improving urban infrastructure contribute indirectly to greater demand for furniture, including tables, for newly developed public and private spaces.
- Public health campaigns advocating for ergonomic furniture use in workplaces enhance awareness of the importance of quality tables, further driving market demand.
- Investment in the hospitality sector from federal programs can enhance public-private partnerships, resulting in increased demand for unique table designs in the evolving tourist industry.
Brazil Tables Market Latest Developments (May 2025 - June 2026)
Recent trends in the Brazil Tables Market indicate a shift towards innovation in design and functionality as manufacturers explore new materials and construction methods. Collaborations between designers and architects are becoming more prevalent, particularly in the commercial sector, where there is a demand for bespoke solutions that address specific client needs. The acceptance of online purchasing continues to evolve, with an increasing number of consumers opting to view and buy tables online, influencing the way manufacturers approach marketing and sales.
- The rise of remote and hybrid working models has spurred demand for tables that offer more than just a surface, encouraging designs that facilitate collaboration and adaptability.
- Events and trade shows focused on furniture have seen a resurgence, providing a platform for new ideas and innovations to enter the market.
- Technological advancements are being integrated into table designs, including smart tables that incorporate charging capabilities and connectivity features.
- Consumer interest in sustainability is prompting manufacturers to explore recycled materials, further enhancing their market positioning as eco-conscious brands.
- Prominent design trends include the use of bold colors and textures, responding to a growing consumer desire for individuality in furniture choices.
Brazil Tables Market - Key Attractiveness of the Report
- 10 Years of Market Numbers
- Historical Data Starting from 2022 to 2025
- Base Year: 2025
- Forecast Data until 2032
- Key Performance Indicators Impacting the Market
- Major Upcoming Developments and Projects
Key Highlights of the Report:
- Brazil Tables Market Outlook
- Market Size of Brazil Tables Market, 2025
- Forecast of Brazil Tables Market, 2032
- Historical Data and Forecast of Brazil Tables Revenues & Volume for the Period 2022-2032F
- Brazil Tables Market Trend Evolution
- Brazil Tables Market Drivers and Challenges
- Brazil Tables Price Trends
- Brazil Tables Porter's Five Forces
- Brazil Tables Industry Life Cycle
- Historical Data and Forecast of Brazil Tables Market Revenues & Volume By Types for the Period 2022-2032F
- Historical Data and Forecast of Brazil Tables Market Revenues & Volume By Fabric for the Period 2022-2032F
- Historical Data and Forecast of Brazil Tables Market Revenues & Volume By Leather for the Period 2022-2032F
- Historical Data and Forecast of Brazil Tables Market Revenues & Volume By Metal for the Period 2022-2032F
- Historical Data and Forecast of Brazil Tables Market Revenues & Volume By Wooden for the Period 2022-2032F
- Historical Data and Forecast of Brazil Tables Market Revenues & Volume By Others for the Period 2022-2032F
- Historical Data and Forecast of Brazil Tables Market Revenues & Volume By Applications for the Period 2022-2032F
- Historical Data and Forecast of Brazil Tables Market Revenues & Volume By Family for the Period 2022-2032F
- Historical Data and Forecast of Brazil Tables Market Revenues & Volume By Office for the Period 2022-2032F
- Historical Data and Forecast of Brazil Tables Market Revenues & Volume By Others for the Period 2022-2032F
- Brazil Tables Import Export Trade Statistics
- Market Opportunity Assessment By Types
- Market Opportunity Assessment By Applications
- Brazil Tables Top Companies Market Share
- Brazil Tables Competitive Benchmarking By Technical and Operational Parameters
- Brazil Tables Company Profiles
- Brazil Tables Key Strategic Recommendations
Frequently Asked Questions About the Market Study (FAQs):
The growth is primarily driven by the expanding hospitality sector, increasing urbanization, and the rising demand for multifunctional furniture.
Challenges include rapidly changing consumer preferences, economic uncertainties affecting consumer spending, and environmental regulations impacting manufacturing processes.
Government initiatives focusing on ergonomic workplace guidelines and sustainable production practices significantly shape market dynamics and consumer demand.
Recent developments include the integration of technology in table design, a shift towards environmentally sustainable materials, and the growth of online purchasing trends.
6Wresearch actively monitors the Brazil Tables Market and publishes its comprehensive annual report, highlighting emerging trends, growth drivers, revenue analysis, and forecast outlook. Our insights help businesses to make data-backed strategic decisions with ongoing market dynamics. Our analysts track relevent industries related to the Brazil Tables Market, allowing our clients with actionable intelligence and reliable forecasts tailored to emerging regional needs.
Yes, we provide customisation as per your requirements. To learn more, feel free to contact us on sales@6wresearch.com
1 Executive Summary |
2 Introduction |
2.1 Key Highlights of the Report |
2.2 Report Description |
2.3 Market Scope & Segmentation |
2.4 Research Methodology |
2.5 Assumptions |
3 Brazil Tables Market Overview |
3.1 Brazil Country Macro Economic Indicators |
3.2 Brazil Tables Market Revenues & Volume, 2022 & 2032F |
3.3 Brazil Tables Market - Industry Life Cycle |
3.4 Brazil Tables Market - Porter's Five Forces |
3.5 Brazil Tables Market Revenues & Volume Share, By Types, 2022 & 2032F |
3.6 Brazil Tables Market Revenues & Volume Share, By Applications, 2022 & 2032F |
4 Brazil Tables Market Dynamics |
4.1 Impact Analysis |
4.2 Market Drivers |
4.2.1 Growing demand for furniture in Brazil |
4.2.2 Increasing disposable income of consumers |
4.2.3 Rising trend of home renovation and interior decoration |
4.3 Market Restraints |
4.3.1 Fluctuating raw material prices |
4.3.2 Competition from imported tables |
4.3.3 Economic instability affecting consumer spending |
5 Brazil Tables Market Trends |
6 Brazil Tables Market, By Types |
6.1 Brazil Tables Market, By Types |
6.1.1 Overview and Analysis |
6.1.2 Brazil Tables Market Revenues & Volume, By Types, 2022-2032F |
6.1.3 Brazil Tables Market Revenues & Volume, By Fabric, 2022-2032F |
6.1.4 Brazil Tables Market Revenues & Volume, By Leather, 2022-2032F |
6.1.5 Brazil Tables Market Revenues & Volume, By Metal, 2022-2032F |
6.1.6 Brazil Tables Market Revenues & Volume, By Wooden, 2022-2032F |
6.1.7 Brazil Tables Market Revenues & Volume, By Others, 2022-2032F |
6.2 Brazil Tables Market, By Applications |
6.2.1 Overview and Analysis |
6.2.2 Brazil Tables Market Revenues & Volume, By Family, 2022-2032F |
6.2.3 Brazil Tables Market Revenues & Volume, By Office, 2022-2032F |
6.2.4 Brazil Tables Market Revenues & Volume, By Others, 2022-2032F |
7 Brazil Tables Market Import-Export Trade Statistics |
7.1 Brazil Tables Market Export to Major Countries |
7.2 Brazil Tables Market Imports from Major Countries |
8 Brazil Tables Market Key Performance Indicators |
8.1 Average selling price of tables in Brazil |
8.2 Number of new product launches in the tables segment |
8.3 Consumer sentiment towards purchasing furniture |
8.4 Retail foot traffic in furniture stores |
8.5 Percentage of households investing in home decor |
9 Brazil Tables Market - Opportunity Assessment |
9.1 Brazil Tables Market Opportunity Assessment, By Types, 2022 & 2032F |
9.2 Brazil Tables Market Opportunity Assessment, By Applications, 2022 & 2032F |
10 Brazil Tables Market - Competitive Landscape |
10.1 Brazil Tables Market Revenue Share, By Companies, 2025 |
10.2 Brazil Tables Market Competitive Benchmarking, By Operating and Technical Parameters |
11 Company Profiles |
12 Recommendations |
13 Disclaimer |
Global Go To Market Strategy - 2030
Export potential enables firms to identify high-growth global markets with greater confidence by combining advanced trade intelligence with a structured quantitative methodology. The framework analyzes emerging demand trends and country-level import patterns while integrating macroeconomic and trade datasets such as GDP and population forecasts, bilateral import–export flows, tariff structures, elasticity differentials between developed and developing economies, geographic distance, and import demand projections. Using weighted trade values from 2020–2024 as the base period to project country-to-country export potential for 2030, these inputs are operationalized through calculated drivers such as gravity model parameters, tariff impact factors, and projected GDP per-capita growth. Through an analysis of hidden potentials, demand hotspots, and market conditions that are most favorable to success, this method enables firms to focus on target countries, maximize returns, and global expansion with data, backed by accuracy.
By factoring in the projected importer demand gap that is currently unmet and could be potential opportunity, it identifies the potential for the Exporter (Country) among 190 countries, against the general trade analysis, which identifies the biggest importer or exporter.
To discover high-growth global markets and optimize your business strategy:
Click Here
Pricing
- Single User License$ 1,995
- Department License$ 2,400
- Site License$ 3,120
- Global License$ 3,795

Leadership Perspectives from Industry Events
Search
Thought Leadership and Analyst Meet


Our Clients
6WResearch In News
- India Air Conditioner Market Set for Strong Rebound in 2026 After Weather-Led Correction and GST-Driven Recovery: 6Wresearch
- ADAS in India: How Automatic Emergency Braking, Blind Spot Detection & Driver Monitoring are Transforming Road Safety
- Doha a strategic location for EV manufacturing hub: IPA Qatar
- Demand for luxury TVs surging in the GCC, says Samsung
- Empowering Growth: The Thriving Journey of Bangladesh’s Cable Industry
- Demand for luxury TVs surging in the GCC, says Samsung
Latest Reports
- Poland Fire Protection Systems Market (2026-2032)
- Cape Verde Portable Hand-Thrown Extinguisher Market (2026-2032)
- Canada Portable Hand-Thrown Extinguisher Market (2026-2032)
- Cameroon Portable Hand-Thrown Extinguisher Market (2026-2032)
- Burundi Portable Hand-Thrown Extinguisher Market (2026-2032)
- Burkina Faso Portable Hand-Thrown Extinguisher Market (2026-2032)
- Bulgaria Portable Hand-Thrown Extinguisher Market (2026-2032)
- Brunei Portable Hand-Thrown Extinguisher Market (2026-2032)
- Botswana Portable Hand-Thrown Extinguisher Market (2026-2032)
- Bosnia and Herzegovina Portable Hand-Thrown Extinguisher Market (2026-2032)
Industry Events and Analyst Meet

HIMTEX 2026

India Refining Summit 2026

India EV Show 2026

EV tech India Expo 2026

Auto Tech Asia 2026
Whitepaper
- Middle East & Africa Commercial Security Market Click here to view more.
- Middle East & Africa Fire Safety Systems & Equipment Market Click here to view more.
- GCC Drone Market Click here to view more.
- Middle East Lighting Fixture Market Click here to view more.
- GCC Physical & Perimeter Security Market Click here to view more.