Romania Copper Nitrate Market (2026-2032) Outlook | Forecast, Growth, Companies, Trends, Share, Industry, Analysis, Value, Size, Revenue
Market Forecast By Composition (Monohydrate, Sesquihydrate, Hemipentahydrate, Trihydrate, Hexahydrate), By Application (Organic Synthesis Processes, Laboratory Experiments, Textile Dyes, Polishing Agent, Others) And Competitive Landscape
| Product Code: ETC195990 | Publication Date: May 2022 | Updated Date: Apr 2026 | Product Type: Market Research Report | |
| Publisher: 6Wresearch | Author: Ravi Bhandari | No. of Pages: 60 | No. of Figures: 40 | No. of Tables: 7 |
Romania Copper Nitrate Market Size (2020-2030)
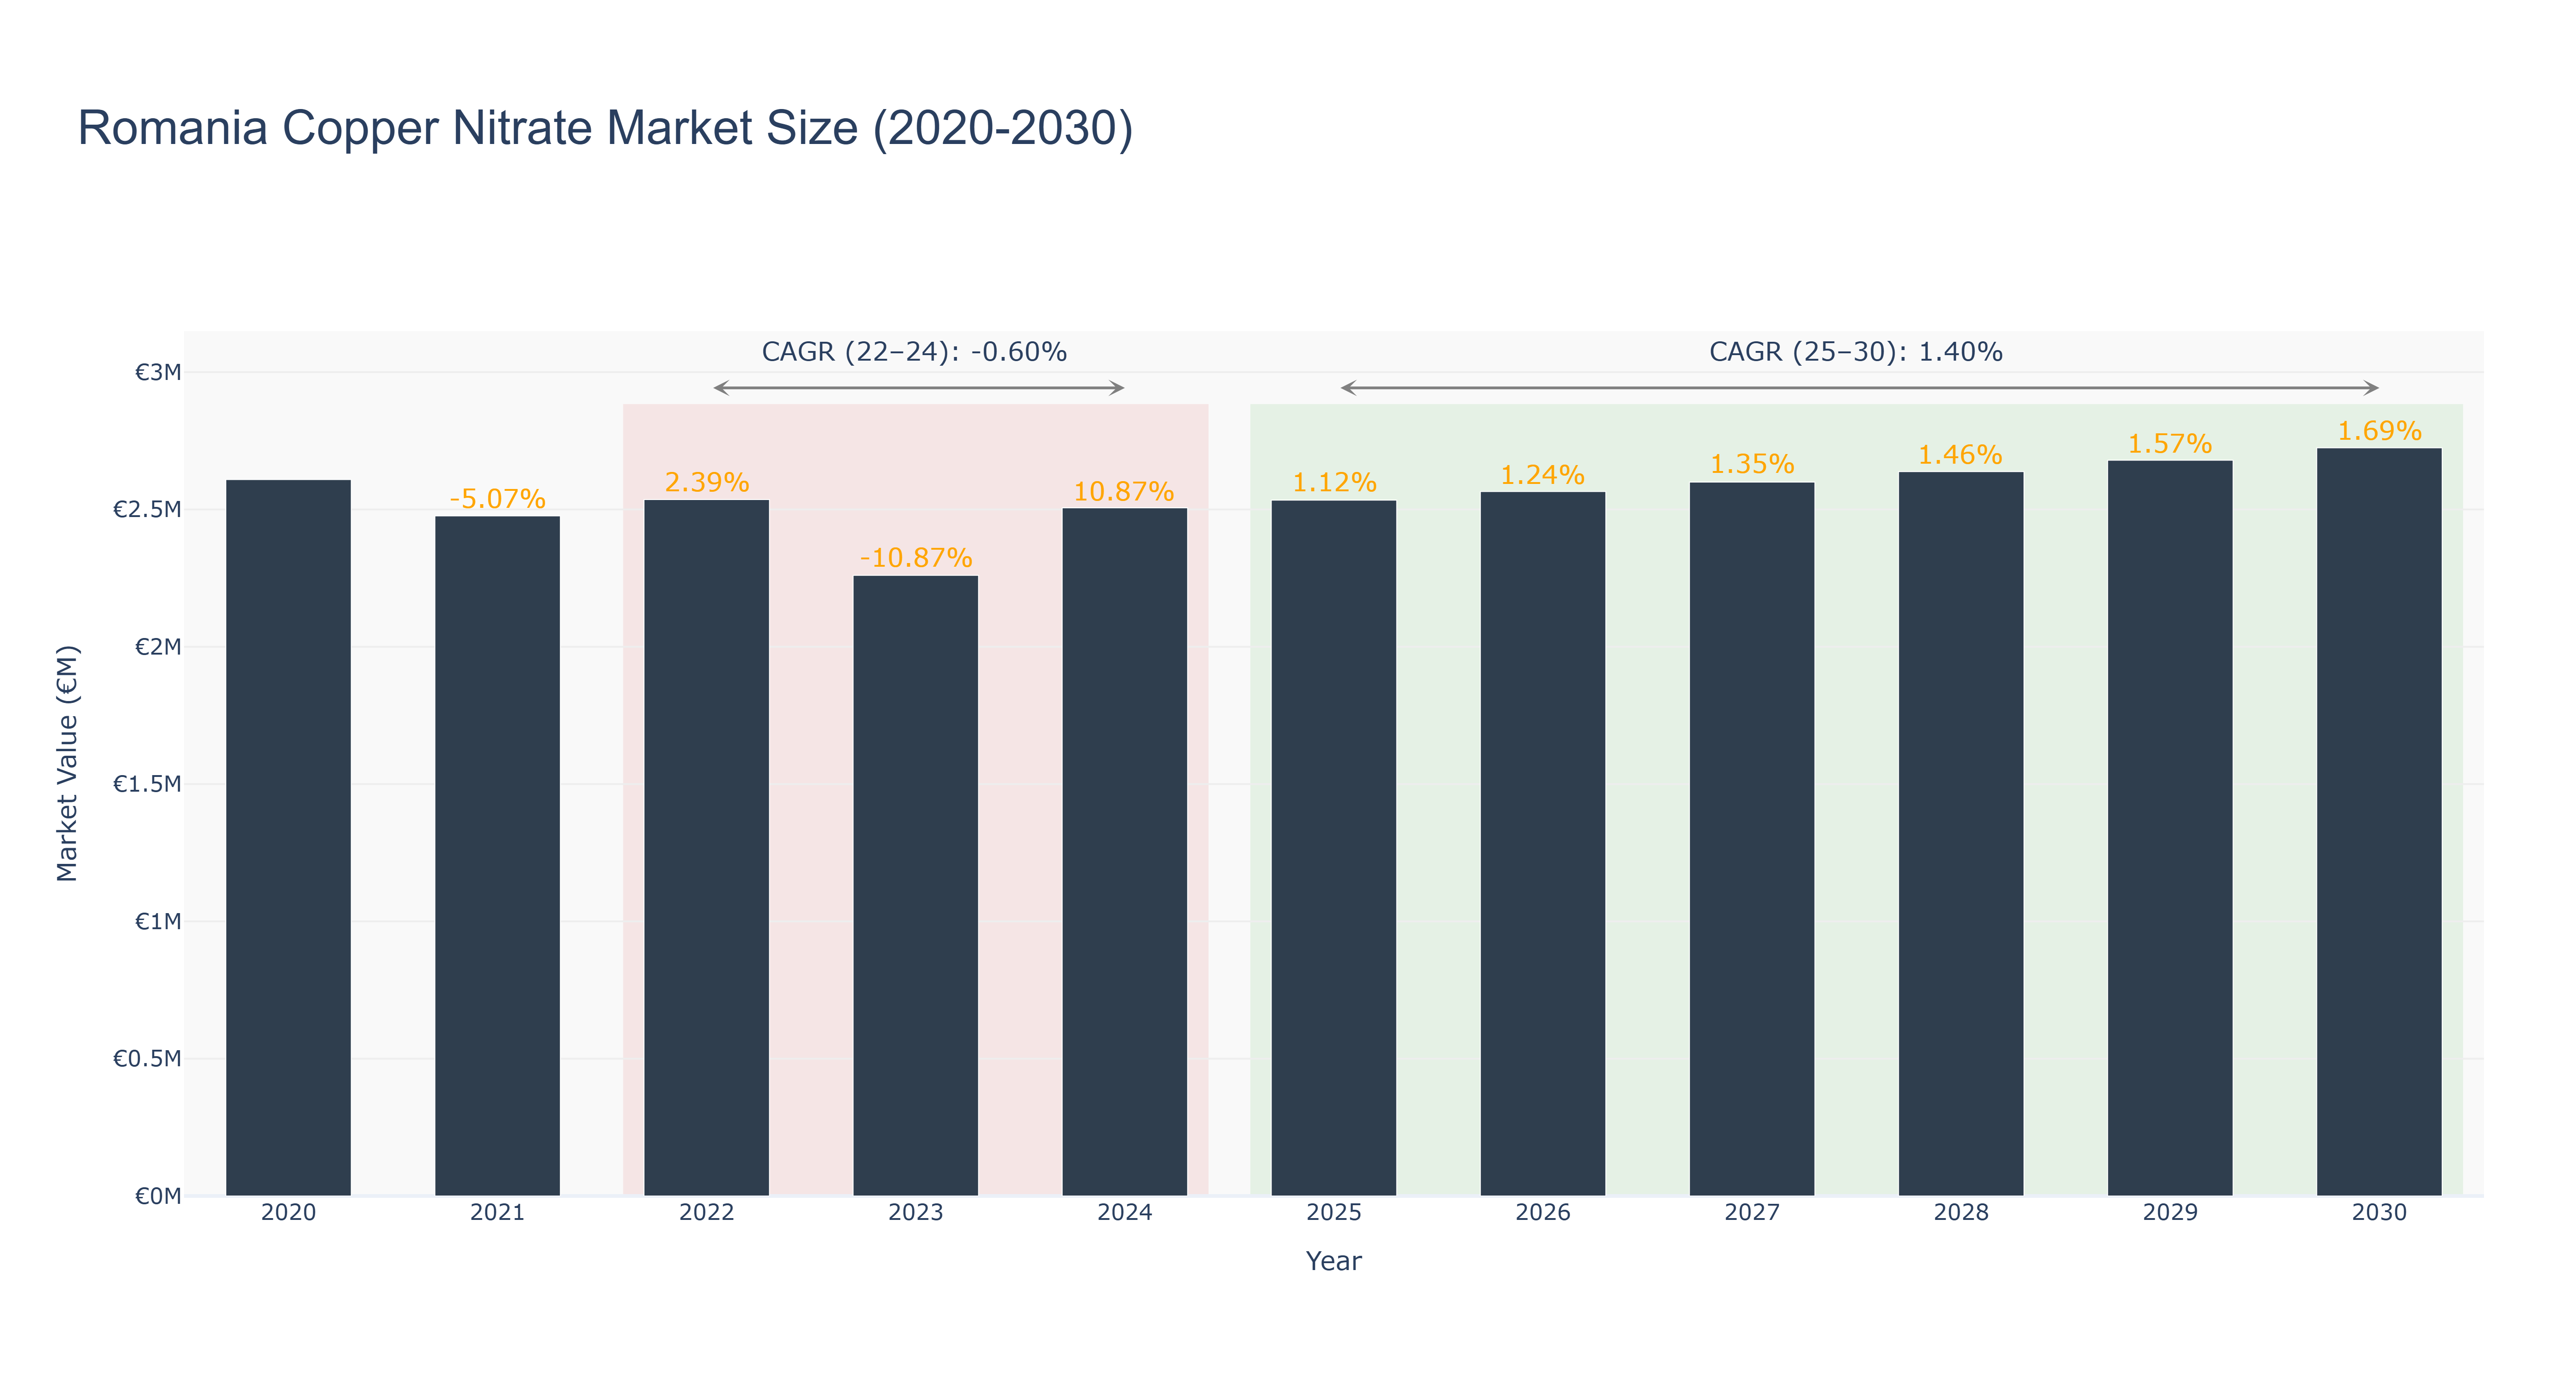
Romania Copper Nitrate Market has shown a fluctuating trend over the past decade. The peak market size of €2.72 million was observed in 2030, with a steady growth rate. The actual market size decreased from €2.61 million in 2020 to €2.51 million in 2024, attributed to the market's volatility and external factors. However, a forecasted growth is expected from 2025 to 2030, reaching €2.72 million, with a CAGR of 1.40%. The market experienced a decline in CAGR from 2022-24 due to economic uncertainties, but it is projected to improve from 2025-30, driven by increasing demand for copper nitrate in various industries. Recent developments in Romania's mining sector, such as new exploration projects and modernization initiatives, are expected to further boost the market's growth in the near future.
Romania Copper Nitrate Market: Production & Trade Performance (2019-2025)
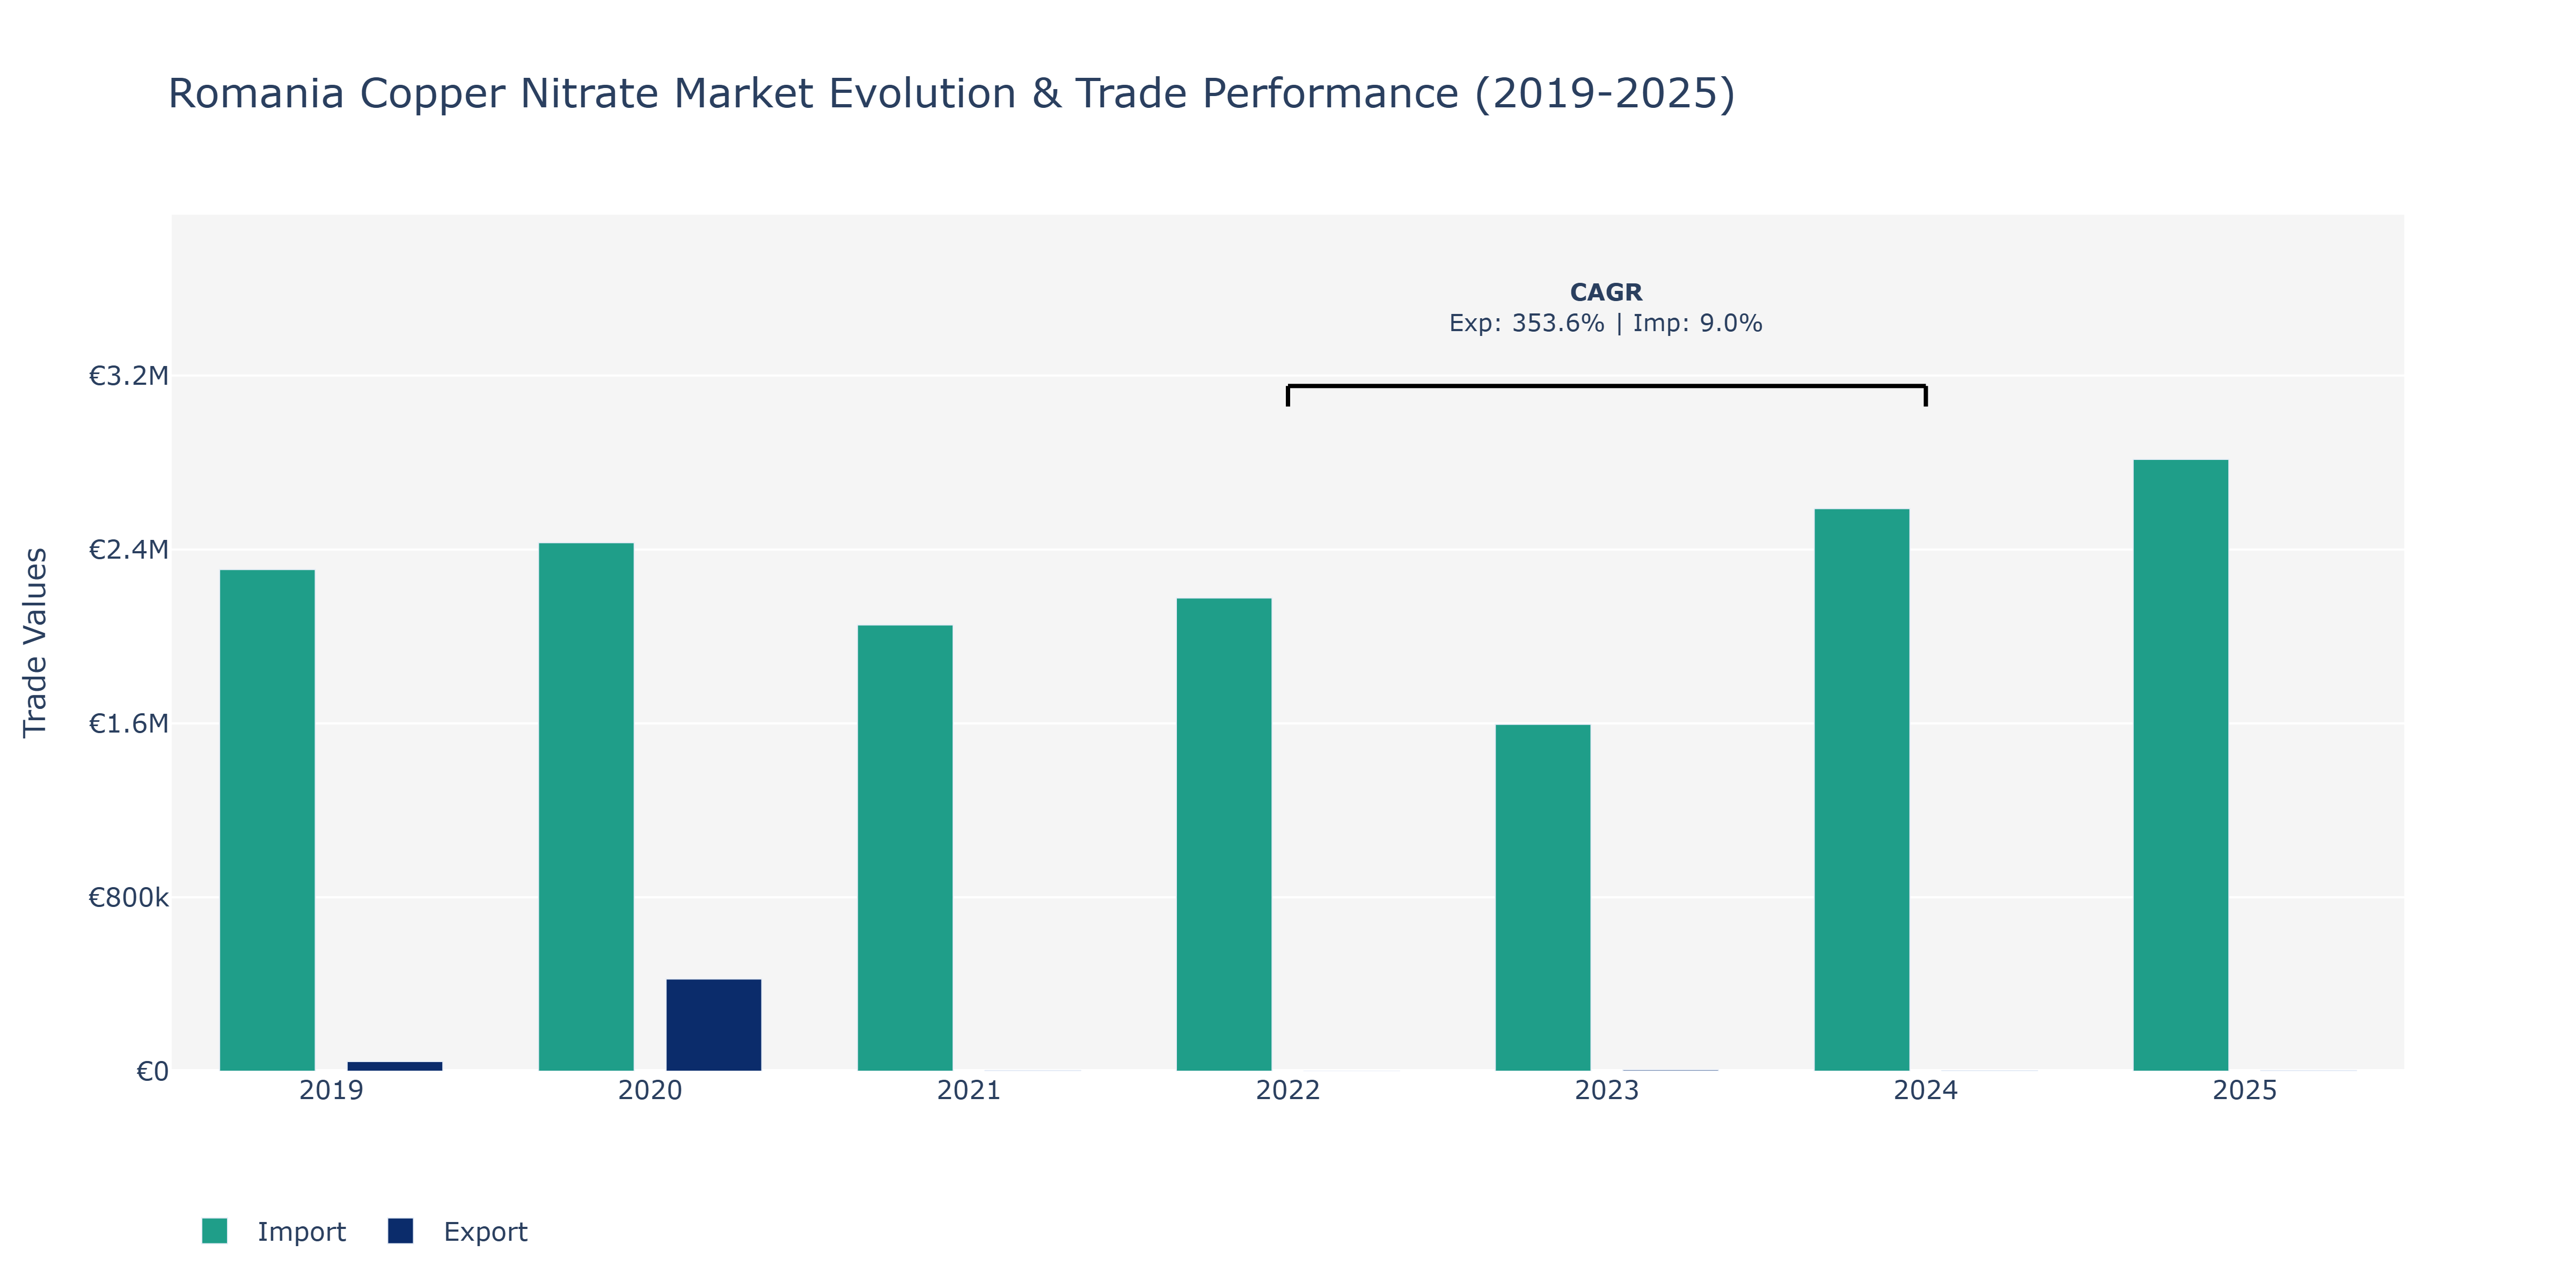
In the Romania Copper Nitrate Market, exports and imports displayed notable variations over the years. In 2019, exports stood at €44.57 thousand, with a substantial increase to €424.22 thousand in 2020, indicating a peak point. However, a sharp decline to €2.84 thousand in 2021 and a subsequent rise to €5.92 thousand in 2023 were observed. Similarly, imports surged from €2.31 million in 2019 to €2.81 million in 2024, showcasing a peak, followed by a slight decrease to €2.81 million in 2025. Imports experienced a dip in 2023 to €1.6 million. The fluctuations in exports can be attributed to global demand shifts for copper-based products and market competitiveness. For imports, factors like raw material availability, international trade policies, and domestic consumption patterns played a significant role. The increasing trend in exports post-2021 could be linked to strategic market expansions and product diversification efforts by key players in the copper nitrate industry.
Key Highlights of the Report:
- Romania Copper Nitrate Market Outlook
- Market Size of Romania Copper Nitrate Market, 2025
- Forecast of Romania Copper Nitrate Market, 2032
- Historical Data and Forecast of Romania Copper Nitrate Revenues & Volume for the Period 2022-2032F
- Romania Copper Nitrate Market Trend Evolution
- Romania Copper Nitrate Market Drivers and Challenges
- Romania Copper Nitrate Price Trends
- Romania Copper Nitrate Porter's Five Forces
- Romania Copper Nitrate Industry Life Cycle
- Historical Data and Forecast of Romania Copper Nitrate Market Revenues & Volume By Composition for the Period 2022-2032F
- Historical Data and Forecast of Romania Copper Nitrate Market Revenues & Volume By Monohydrate for the Period 2022-2032F
- Historical Data and Forecast of Romania Copper Nitrate Market Revenues & Volume By Sesquihydrate for the Period 2022-2032F
- Historical Data and Forecast of Romania Copper Nitrate Market Revenues & Volume By Hemipentahydrate for the Period 2022-2032F
- Historical Data and Forecast of Romania Copper Nitrate Market Revenues & Volume By Trihydrate for the Period 2022-2032F
- Historical Data and Forecast of Romania Copper Nitrate Market Revenues & Volume By Hexahydrate for the Period 2022-2032F
- Historical Data and Forecast of Romania Copper Nitrate Market Revenues & Volume By Application for the Period 2022-2032F
- Historical Data and Forecast of Romania Copper Nitrate Market Revenues & Volume By Organic Synthesis Processes for the Period 2022-2032F
- Historical Data and Forecast of Romania Copper Nitrate Market Revenues & Volume By Laboratory Experiments for the Period 2022-2032F
- Historical Data and Forecast of Romania Copper Nitrate Market Revenues & Volume By Textile Dyes for the Period 2022-2032F
- Historical Data and Forecast of Romania Copper Nitrate Market Revenues & Volume By Polishing Agent for the Period 2022-2032F
- Historical Data and Forecast of Romania Copper Nitrate Market Revenues & Volume By Others for the Period 2022-2032F
- Romania Copper Nitrate Import Export Trade Statistics
- Market Opportunity Assessment By Composition
- Market Opportunity Assessment By Application
- Romania Copper Nitrate Top Companies Market Share
- Romania Copper Nitrate Competitive Benchmarking By Technical and Operational Parameters
- Romania Copper Nitrate Company Profiles
- Romania Copper Nitrate Key Strategic Recommendations
Frequently Asked Questions About the Market Study (FAQs):
6Wresearch actively monitors the Romania Copper Nitrate Market and publishes its comprehensive annual report, highlighting emerging trends, growth drivers, revenue analysis, and forecast outlook. Our insights help businesses to make data-backed strategic decisions with ongoing market dynamics. Our analysts track relevent industries related to the Romania Copper Nitrate Market, allowing our clients with actionable intelligence and reliable forecasts tailored to emerging regional needs.
Yes, we provide customisation as per your requirements. To learn more, feel free to contact us on sales@6wresearch.com
1 Executive Summary |
2 Introduction |
2.1 Key Highlights of the Report |
2.2 Report Description |
2.3 Market Scope & Segmentation |
2.4 Research Methodology |
2.5 Assumptions |
3 Romania Copper Nitrate Market Overview |
3.1 Romania Country Macro Economic Indicators |
3.2 Romania Copper Nitrate Market Revenues & Volume, 2022 & 2032F |
3.3 Romania Copper Nitrate Market - Industry Life Cycle |
3.4 Romania Copper Nitrate Market - Porter's Five Forces |
3.5 Romania Copper Nitrate Market Revenues & Volume Share, By Composition, 2022 & 2032F |
3.6 Romania Copper Nitrate Market Revenues & Volume Share, By Application, 2022 & 2032F |
4 Romania Copper Nitrate Market Dynamics |
4.1 Impact Analysis |
4.2 Market Drivers |
4.2.1 Growing demand from the agriculture industry for fertilizers containing copper nitrate |
4.2.2 Increasing use of copper nitrate in the manufacturing of electronics and chemicals |
4.2.3 Rising investments in infrastructure and construction projects in Romania |
4.3 Market Restraints |
4.3.1 Fluctuating prices of raw materials used in copper nitrate production |
4.3.2 Stringent regulations and environmental concerns regarding the use of copper-based products |
4.3.3 Competition from substitute products in the market |
5 Romania Copper Nitrate Market Trends |
6 Romania Copper Nitrate Market, By Types |
6.1 Romania Copper Nitrate Market, By Composition |
6.1.1 Overview and Analysis |
6.1.2 Romania Copper Nitrate Market Revenues & Volume, By Composition, 2022 - 2032F |
6.1.3 Romania Copper Nitrate Market Revenues & Volume, By Monohydrate, 2022 - 2032F |
6.1.4 Romania Copper Nitrate Market Revenues & Volume, By Sesquihydrate, 2022 - 2032F |
6.1.5 Romania Copper Nitrate Market Revenues & Volume, By Hemipentahydrate, 2022 - 2032F |
6.1.6 Romania Copper Nitrate Market Revenues & Volume, By Trihydrate, 2022 - 2032F |
6.1.7 Romania Copper Nitrate Market Revenues & Volume, By Hexahydrate, 2022 - 2032F |
6.2 Romania Copper Nitrate Market, By Application |
6.2.1 Overview and Analysis |
6.2.2 Romania Copper Nitrate Market Revenues & Volume, By Organic Synthesis Processes, 2022 - 2032F |
6.2.3 Romania Copper Nitrate Market Revenues & Volume, By Laboratory Experiments, 2022 - 2032F |
6.2.4 Romania Copper Nitrate Market Revenues & Volume, By Textile Dyes, 2022 - 2032F |
6.2.5 Romania Copper Nitrate Market Revenues & Volume, By Polishing Agent, 2022 - 2032F |
6.2.6 Romania Copper Nitrate Market Revenues & Volume, By Others, 2022 - 2032F |
7 Romania Copper Nitrate Market Import-Export Trade Statistics |
7.1 Romania Copper Nitrate Market Export to Major Countries |
7.2 Romania Copper Nitrate Market Imports from Major Countries |
8 Romania Copper Nitrate Market Key Performance Indicators |
8.1 Percentage increase in the number of agriculture companies using copper nitrate-based fertilizers |
8.2 Growth in the number of electronics and chemical manufacturers incorporating copper nitrate in their products |
8.3 Number of new infrastructure and construction projects using copper nitrate as a corrosion inhibitor |
9 Romania Copper Nitrate Market - Opportunity Assessment |
9.1 Romania Copper Nitrate Market Opportunity Assessment, By Composition, 2022 & 2032F |
9.2 Romania Copper Nitrate Market Opportunity Assessment, By Application, 2022 & 2032F |
10 Romania Copper Nitrate Market - Competitive Landscape |
10.1 Romania Copper Nitrate Market Revenue Share, By Companies, 2025 |
10.2 Romania Copper Nitrate Market Competitive Benchmarking, By Operating and Technical Parameters |
11 Company Profiles |
12 Recommendations |
13 Disclaimer |
Global Go To Market Strategy - 2030
Export potential enables firms to identify high-growth global markets with greater confidence by combining advanced trade intelligence with a structured quantitative methodology. The framework analyzes emerging demand trends and country-level import patterns while integrating macroeconomic and trade datasets such as GDP and population forecasts, bilateral import–export flows, tariff structures, elasticity differentials between developed and developing economies, geographic distance, and import demand projections. Using weighted trade values from 2020–2024 as the base period to project country-to-country export potential for 2030, these inputs are operationalized through calculated drivers such as gravity model parameters, tariff impact factors, and projected GDP per-capita growth. Through an analysis of hidden potentials, demand hotspots, and market conditions that are most favorable to success, this method enables firms to focus on target countries, maximize returns, and global expansion with data, backed by accuracy.
By factoring in the projected importer demand gap that is currently unmet and could be potential opportunity, it identifies the potential for the Exporter (Country) among 190 countries, against the general trade analysis, which identifies the biggest importer or exporter.
To discover high-growth global markets and optimize your business strategy:
Click Here
Pricing
- Single User License$ 1,995
- Department License$ 2,400
- Site License$ 3,120
- Global License$ 3,795

Leadership Perspectives from Industry Events
Search
Thought Leadership and Analyst Meet


Our Clients
6WResearch In News
- India Air Conditioner Market Set for Strong Rebound in 2026 After Weather-Led Correction and GST-Driven Recovery: 6Wresearch
- ADAS in India: How Automatic Emergency Braking, Blind Spot Detection & Driver Monitoring are Transforming Road Safety
- Doha a strategic location for EV manufacturing hub: IPA Qatar
- Demand for luxury TVs surging in the GCC, says Samsung
- Empowering Growth: The Thriving Journey of Bangladesh’s Cable Industry
- Demand for luxury TVs surging in the GCC, says Samsung
Latest Reports
- Poland Fire Protection Systems Market (2026-2032)
- Cape Verde Portable Hand-Thrown Extinguisher Market (2026-2032)
- Canada Portable Hand-Thrown Extinguisher Market (2026-2032)
- Cameroon Portable Hand-Thrown Extinguisher Market (2026-2032)
- Burundi Portable Hand-Thrown Extinguisher Market (2026-2032)
- Burkina Faso Portable Hand-Thrown Extinguisher Market (2026-2032)
- Bulgaria Portable Hand-Thrown Extinguisher Market (2026-2032)
- Brunei Portable Hand-Thrown Extinguisher Market (2026-2032)
- Botswana Portable Hand-Thrown Extinguisher Market (2026-2032)
- Bosnia and Herzegovina Portable Hand-Thrown Extinguisher Market (2026-2032)
Industry Events and Analyst Meet

HIMTEX 2026

India Refining Summit 2026

India EV Show 2026

EV tech India Expo 2026

Auto Tech Asia 2026
Whitepaper
- Middle East & Africa Commercial Security Market Click here to view more.
- Middle East & Africa Fire Safety Systems & Equipment Market Click here to view more.
- GCC Drone Market Click here to view more.
- Middle East Lighting Fixture Market Click here to view more.
- GCC Physical & Perimeter Security Market Click here to view more.