Romania Glue Brush Market (2026-2032) Outlook | Value, Size, Companies, Analysis, Industry, Growth, Forecast, Trends, Share & Revenue
Market Forecast By Type (Wheel Shape, Cotton Swab, Others), By Application (Business Use, Industrial Applications, Others) And Competitive Landscape
| Product Code: ETC252618 | Publication Date: Aug 2022 | Updated Date: Apr 2026 | Product Type: Market Research Report | |
| Publisher: 6Wresearch | Author: Ravi Bhandari | No. of Pages: 75 | No. of Figures: 35 | No. of Tables: 20 |
Romania Glue Brush Market Size (2020-2030)
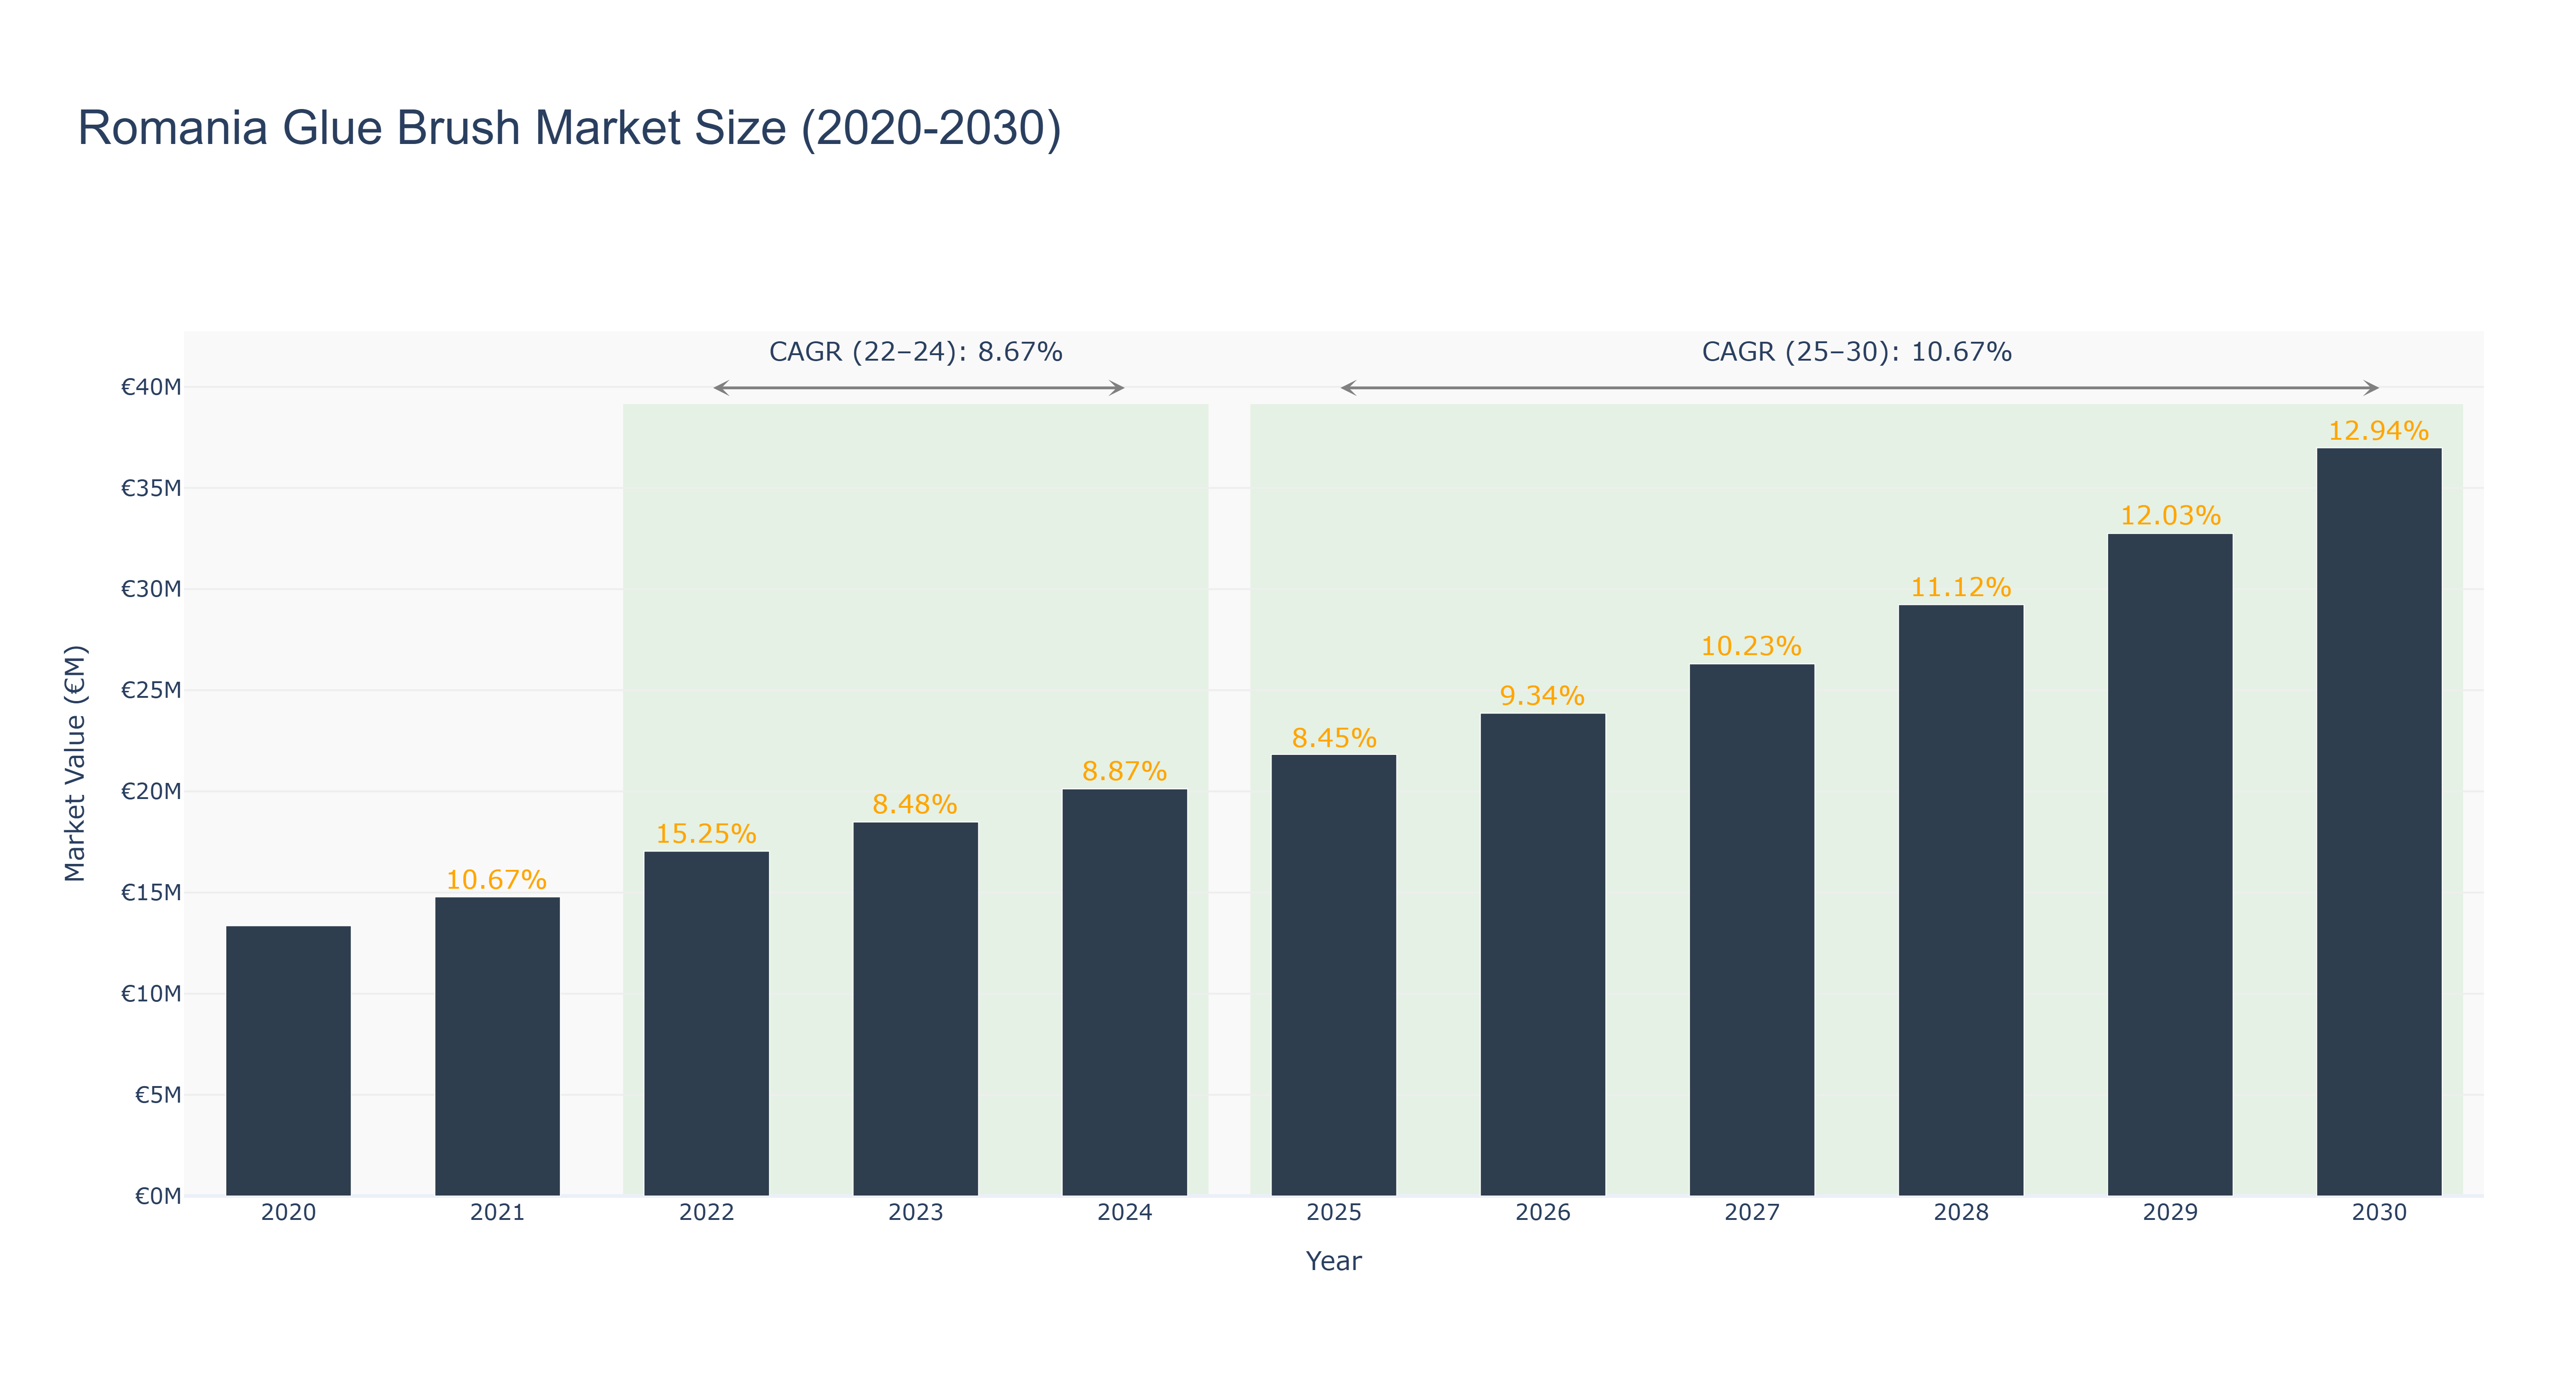
Romania Glue Brush Market has shown a consistent upward trend in market size over the years. The market peaked at €36.99 million in 2030, with a notable growth rate of 12.94% from the previous year. From 2020 to 2024, the market size steadily increased, driven by factors such as increased demand for adhesive products in various industries. Looking ahead, the forecasted market size from 2025 to 2030 is promising, with a CAGR of 10.67% for the period 2025-30. The market is expected to benefit from ongoing infrastructure projects in Romania, boosting the demand for glue brush products. Recent developments in the construction sector and upcoming infrastructure projects in the country are likely to further fuel the growth of the Romania Glue Brush Market.
Romania Glue Brush Market: Production & Trade Performance (2019-2025)
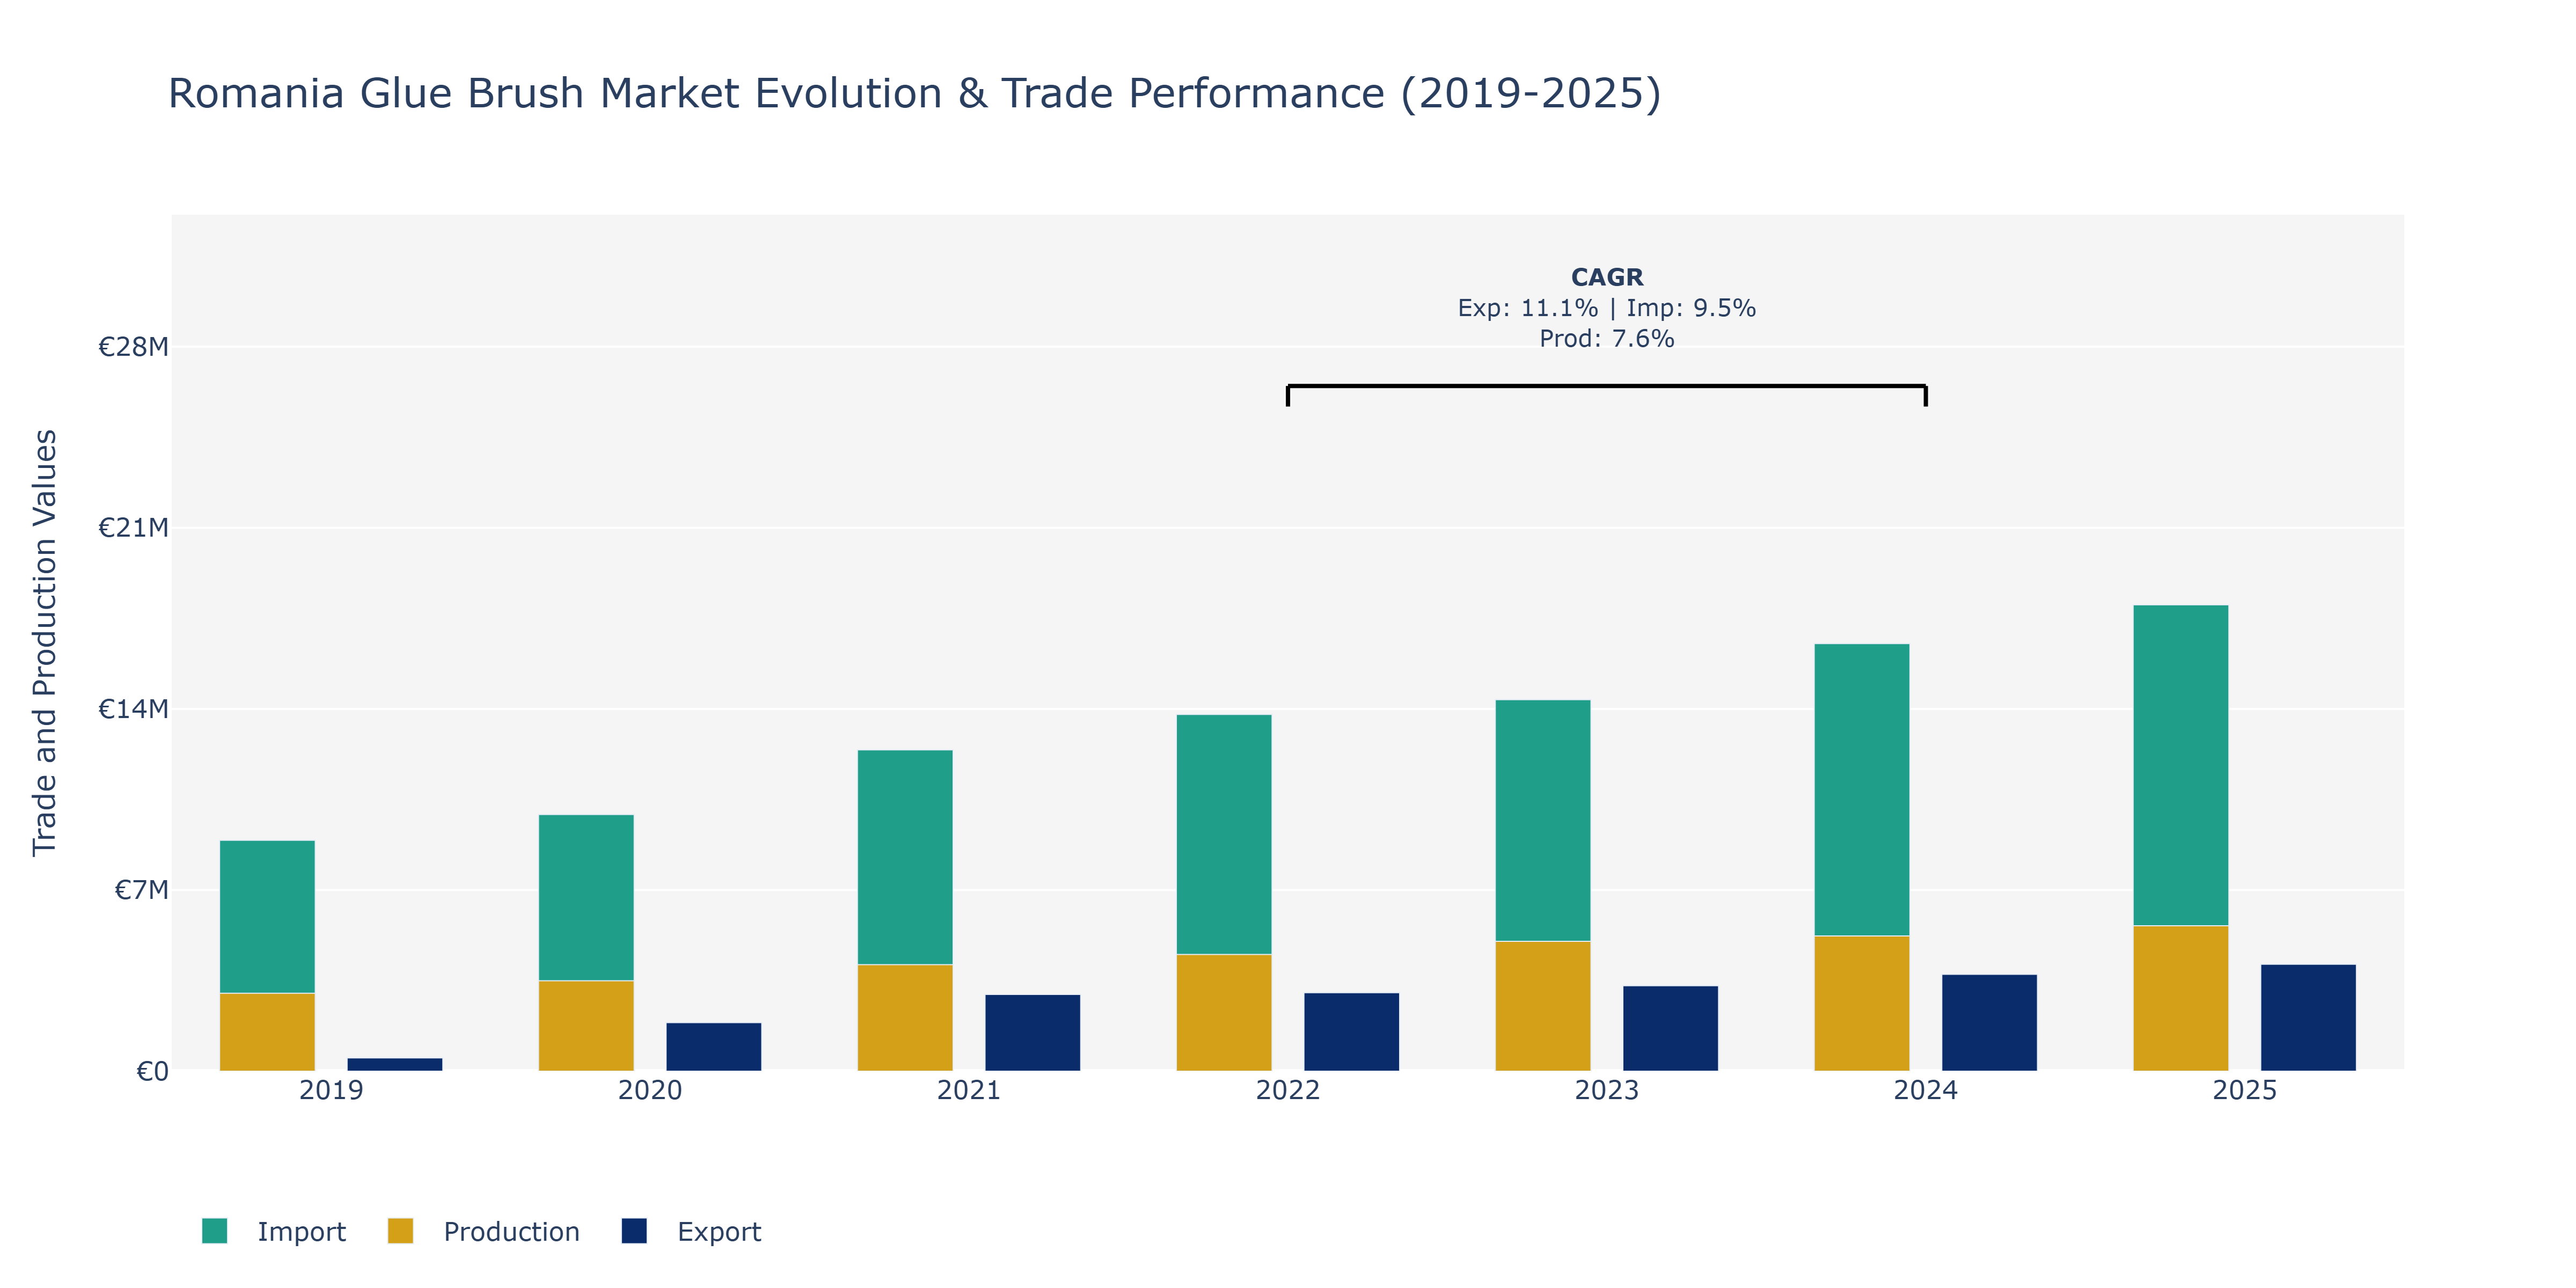
Between 2019 and 2025, the Romania Glue Brush Market witnessed notable shifts in Exports, Imports, and Production. Exports showed a consistent upward trajectory, more than tripling from €512.86 thousand in 2019 to approximately €4.13 million by 2025. The market saw a substantial rise in Imports, reaching around €18.02 million in 2025 from €8.92 million in 2019. Production value also displayed steady growth, increasing from €3.0 million in 2019 to over €5.6 million in 2025. Peak points were observed in 2025 for all three metrics. These trends can be attributed to Romania's expanding manufacturing sector, increasing international trade partnerships, and advancements in product quality and innovation. The demand for glue brushes in various industries such as construction, automotive, and crafts could have also fueled these growth patterns, aligning with the country's economic development and export competitiveness efforts.
Key Highlights of the Report:
- Romania Glue Brush Market Outlook
- Market Size of Romania Glue Brush Market, 2025
- Forecast of Romania Glue Brush Market, 2032
- Historical Data and Forecast of Romania Glue Brush Revenues & Volume for the Period 2022-2032F
- Romania Glue Brush Market Trend Evolution
- Romania Glue Brush Market Drivers and Challenges
- Romania Glue Brush Price Trends
- Romania Glue Brush Porter's Five Forces
- Romania Glue Brush Industry Life Cycle
- Historical Data and Forecast of Romania Glue Brush Market Revenues & Volume By Type for the Period 2022-2032F
- Historical Data and Forecast of Romania Glue Brush Market Revenues & Volume By Wheel Shape for the Period 2022-2032F
- Historical Data and Forecast of Romania Glue Brush Market Revenues & Volume By Cotton Swab for the Period 2022-2032F
- Historical Data and Forecast of Romania Glue Brush Market Revenues & Volume By Others for the Period 2022-2032F
- Historical Data and Forecast of Romania Glue Brush Market Revenues & Volume By Application for the Period 2022-2032F
- Historical Data and Forecast of Romania Glue Brush Market Revenues & Volume By Business Use for the Period 2022-2032F
- Historical Data and Forecast of Romania Glue Brush Market Revenues & Volume By Industrial Applications for the Period 2022-2032F
- Historical Data and Forecast of Romania Glue Brush Market Revenues & Volume By Others for the Period 2022-2032F
- Romania Glue Brush Import Export Trade Statistics
- Market Opportunity Assessment By Type
- Market Opportunity Assessment By Application
- Romania Glue Brush Top Companies Market Share
- Romania Glue Brush Competitive Benchmarking By Technical and Operational Parameters
- Romania Glue Brush Company Profiles
- Romania Glue Brush Key Strategic Recommendations
Frequently Asked Questions About the Market Study (FAQs):
6Wresearch actively monitors the Romania Glue Brush Market and publishes its comprehensive annual report, highlighting emerging trends, growth drivers, revenue analysis, and forecast outlook. Our insights help businesses to make data-backed strategic decisions with ongoing market dynamics. Our analysts track relevent industries related to the Romania Glue Brush Market, allowing our clients with actionable intelligence and reliable forecasts tailored to emerging regional needs.
Yes, we provide customisation as per your requirements. To learn more, feel free to contact us on sales@6wresearch.com
1 Executive Summary |
2 Introduction |
2.1 Key Highlights of the Report |
2.2 Report Description |
2.3 Market Scope & Segmentation |
2.4 Research Methodology |
2.5 Assumptions |
3 Romania Glue Brush Market Overview |
3.1 Romania Country Macro Economic Indicators |
3.2 Romania Glue Brush Market Revenues & Volume, 2022 & 2032F |
3.3 Romania Glue Brush Market - Industry Life Cycle |
3.4 Romania Glue Brush Market - Porter's Five Forces |
3.5 Romania Glue Brush Market Revenues & Volume Share, By Type, 2022 & 2032F |
3.6 Romania Glue Brush Market Revenues & Volume Share, By Application, 2022 & 2032F |
4 Romania Glue Brush Market Dynamics |
4.1 Impact Analysis |
4.2 Market Drivers |
4.2.1 Growing construction and DIY activities in Romania |
4.2.2 Increasing demand for eco-friendly and sustainable adhesive products |
4.2.3 Innovation in glue brush technology leading to improved application and efficiency |
4.3 Market Restraints |
4.3.1 Price fluctuations in raw materials impacting production costs |
4.3.2 Competition from alternative adhesive application methods like spray guns or rollers |
4.3.3 Regulatory challenges related to environmental standards and product safety |
5 Romania Glue Brush Market Trends |
6 Romania Glue Brush Market, By Types |
6.1 Romania Glue Brush Market, By Type |
6.1.1 Overview and Analysis |
6.1.2 Romania Glue Brush Market Revenues & Volume, By Type, 2022 - 2032F |
6.1.3 Romania Glue Brush Market Revenues & Volume, By Wheel Shape, 2022 - 2032F |
6.1.4 Romania Glue Brush Market Revenues & Volume, By Cotton Swab, 2022 - 2032F |
6.1.5 Romania Glue Brush Market Revenues & Volume, By Others, 2022 - 2032F |
6.2 Romania Glue Brush Market, By Application |
6.2.1 Overview and Analysis |
6.2.2 Romania Glue Brush Market Revenues & Volume, By Business Use, 2022 - 2032F |
6.2.3 Romania Glue Brush Market Revenues & Volume, By Industrial Applications, 2022 - 2032F |
6.2.4 Romania Glue Brush Market Revenues & Volume, By Others, 2022 - 2032F |
7 Romania Glue Brush Market Import-Export Trade Statistics |
7.1 Romania Glue Brush Market Export to Major Countries |
7.2 Romania Glue Brush Market Imports from Major Countries |
8 Romania Glue Brush Market Key Performance Indicators |
8.1 Percentage increase in demand for eco-friendly adhesive products |
8.2 Adoption rate of advanced glue brush technology in the market |
8.3 Customer satisfaction level with glue brush performance and durability |
8.4 Rate of new product development and innovation in the glue brush market |
9 Romania Glue Brush Market - Opportunity Assessment |
9.1 Romania Glue Brush Market Opportunity Assessment, By Type, 2022 & 2032F |
9.2 Romania Glue Brush Market Opportunity Assessment, By Application, 2022 & 2032F |
10 Romania Glue Brush Market - Competitive Landscape |
10.1 Romania Glue Brush Market Revenue Share, By Companies, 2025 |
10.2 Romania Glue Brush Market Competitive Benchmarking, By Operating and Technical Parameters |
11 Company Profiles |
12 Recommendations |
13 Disclaimer |
Global Go To Market Strategy - 2030
Export potential enables firms to identify high-growth global markets with greater confidence by combining advanced trade intelligence with a structured quantitative methodology. The framework analyzes emerging demand trends and country-level import patterns while integrating macroeconomic and trade datasets such as GDP and population forecasts, bilateral import–export flows, tariff structures, elasticity differentials between developed and developing economies, geographic distance, and import demand projections. Using weighted trade values from 2020–2024 as the base period to project country-to-country export potential for 2030, these inputs are operationalized through calculated drivers such as gravity model parameters, tariff impact factors, and projected GDP per-capita growth. Through an analysis of hidden potentials, demand hotspots, and market conditions that are most favorable to success, this method enables firms to focus on target countries, maximize returns, and global expansion with data, backed by accuracy.
By factoring in the projected importer demand gap that is currently unmet and could be potential opportunity, it identifies the potential for the Exporter (Country) among 190 countries, against the general trade analysis, which identifies the biggest importer or exporter.
To discover high-growth global markets and optimize your business strategy:
Click Here
Pricing
- Single User License$ 1,995
- Department License$ 2,400
- Site License$ 3,120
- Global License$ 3,795

Leadership Perspectives from Industry Events
Search
Thought Leadership and Analyst Meet


Our Clients
6WResearch In News
- India Air Conditioner Market Set for Strong Rebound in 2026 After Weather-Led Correction and GST-Driven Recovery: 6Wresearch
- ADAS in India: How Automatic Emergency Braking, Blind Spot Detection & Driver Monitoring are Transforming Road Safety
- Doha a strategic location for EV manufacturing hub: IPA Qatar
- Demand for luxury TVs surging in the GCC, says Samsung
- Empowering Growth: The Thriving Journey of Bangladesh’s Cable Industry
- Demand for luxury TVs surging in the GCC, says Samsung
Latest Reports
- Poland Fire Protection Systems Market (2026-2032)
- Cape Verde Portable Hand-Thrown Extinguisher Market (2026-2032)
- Canada Portable Hand-Thrown Extinguisher Market (2026-2032)
- Cameroon Portable Hand-Thrown Extinguisher Market (2026-2032)
- Burundi Portable Hand-Thrown Extinguisher Market (2026-2032)
- Burkina Faso Portable Hand-Thrown Extinguisher Market (2026-2032)
- Bulgaria Portable Hand-Thrown Extinguisher Market (2026-2032)
- Brunei Portable Hand-Thrown Extinguisher Market (2026-2032)
- Botswana Portable Hand-Thrown Extinguisher Market (2026-2032)
- Bosnia and Herzegovina Portable Hand-Thrown Extinguisher Market (2026-2032)
Industry Events and Analyst Meet

HIMTEX 2026

India Refining Summit 2026

India EV Show 2026

EV tech India Expo 2026

Auto Tech Asia 2026
Whitepaper
- Middle East & Africa Commercial Security Market Click here to view more.
- Middle East & Africa Fire Safety Systems & Equipment Market Click here to view more.
- GCC Drone Market Click here to view more.
- Middle East Lighting Fixture Market Click here to view more.
- GCC Physical & Perimeter Security Market Click here to view more.