| Product Code: ETC5759245 | Publication Date: Nov 2023 | Updated Date: Feb 2026 | Product Type: Market Research Report | |
| Publisher: 6Wresearch | Author: Ravi Bhandari | No. of Pages: 60 | No. of Figures: 30 | No. of Tables: 5 |
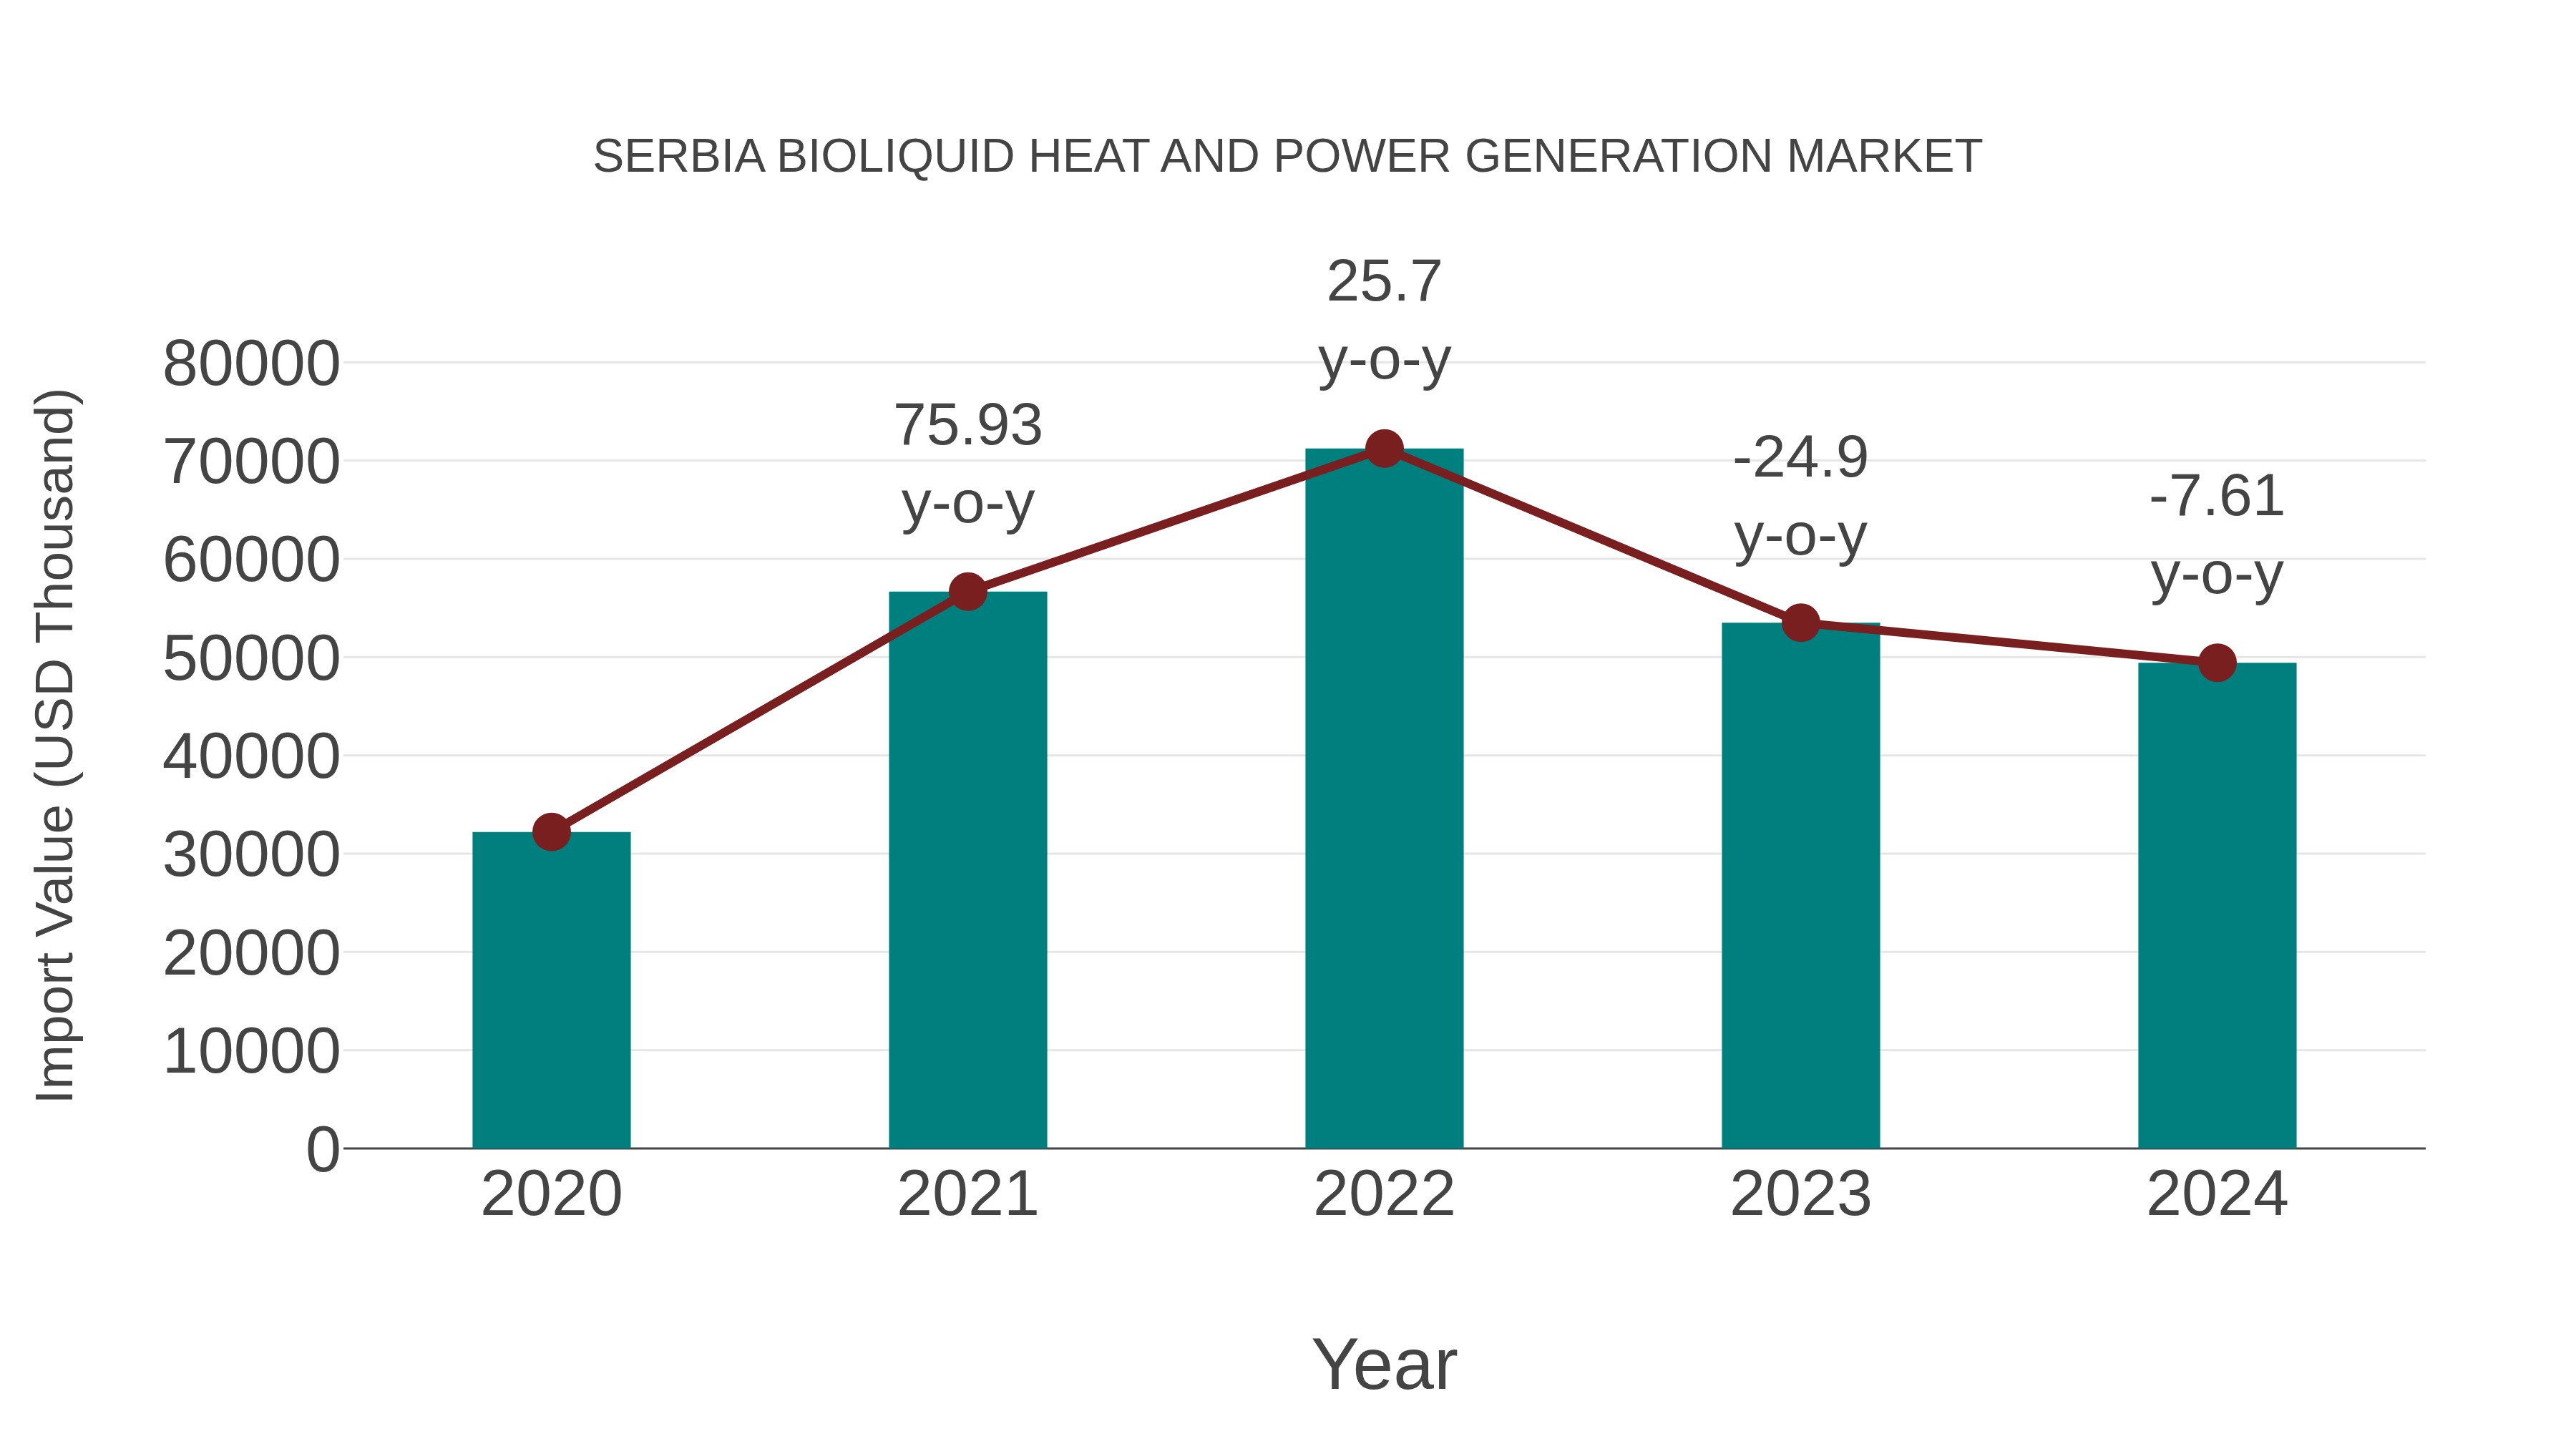
The import trend for bioliquid heat and power generation products in the Serbian market showed a steady increase over the past five years. This growth was driven by rising demand for sustainable energy solutions and government incentives supporting renewable energy sources.
1 Executive Summary |
2 Introduction |
2.1 Key Highlights of the Report |
2.2 Report Description |
2.3 Market Scope & Segmentation |
2.4 Research Methodology |
2.5 Assumptions |
3 Serbia Bioliquid Heat and Power Generation Market Overview |
3.1 Serbia Country Macro Economic Indicators |
3.2 Serbia Bioliquid Heat and Power Generation Market Revenues & Volume, 2022 & 2032F |
3.3 Serbia Bioliquid Heat and Power Generation Market - Industry Life Cycle |
3.4 Serbia Bioliquid Heat and Power Generation Market - Porter's Five Forces |
3.5 Serbia Bioliquid Heat and Power Generation Market Revenues & Volume Share, By Application, 2022 & 2032F |
3.6 Serbia Bioliquid Heat and Power Generation Market Revenues & Volume Share, By Type, 2022 & 2032F |
4 Serbia Bioliquid Heat and Power Generation Market Dynamics |
4.1 Impact Analysis |
4.2 Market Drivers |
4.2.1 Increasing government support and incentives for renewable energy projects |
4.2.2 Growing focus on reducing carbon emissions and transitioning to cleaner energy sources |
4.2.3 Rising demand for sustainable energy solutions in Serbia |
4.3 Market Restraints |
4.3.1 High initial investment costs for bioliquid heat and power generation infrastructure |
4.3.2 Lack of awareness and understanding about the benefits and potential of bioliquid energy |
4.3.3 Limited availability and accessibility of bioliquid feedstock sources |
5 Serbia Bioliquid Heat and Power Generation Market Trends |
6 Serbia Bioliquid Heat and Power Generation Market Segmentations |
6.1 Serbia Bioliquid Heat and Power Generation Market, By Application |
6.1.1 Overview and Analysis |
6.1.2 Serbia Bioliquid Heat and Power Generation Market Revenues & Volume, By Heat Production , 2022-2032F |
6.1.3 Serbia Bioliquid Heat and Power Generation Market Revenues & Volume, By Electricity Generation, 2022-2032F |
6.2 Serbia Bioliquid Heat and Power Generation Market, By Type |
6.2.1 Overview and Analysis |
6.2.2 Serbia Bioliquid Heat and Power Generation Market Revenues & Volume, By Bioethanol , 2022-2032F |
6.2.3 Serbia Bioliquid Heat and Power Generation Market Revenues & Volume, By Biodiesel, 2022-2032F |
7 Serbia Bioliquid Heat and Power Generation Market Import-Export Trade Statistics |
7.1 Serbia Bioliquid Heat and Power Generation Market Export to Major Countries |
7.2 Serbia Bioliquid Heat and Power Generation Market Imports from Major Countries |
8 Serbia Bioliquid Heat and Power Generation Market Key Performance Indicators |
8.1 Percentage increase in bioliquid heat and power generation capacity in Serbia |
8.2 Average cost per unit of bioliquid energy produced |
8.3 Number of new bioliquid heat and power generation projects initiated in a year |
9 Serbia Bioliquid Heat and Power Generation Market - Opportunity Assessment |
9.1 Serbia Bioliquid Heat and Power Generation Market Opportunity Assessment, By Application, 2022 & 2032F |
9.2 Serbia Bioliquid Heat and Power Generation Market Opportunity Assessment, By Type, 2022 & 2032F |
10 Serbia Bioliquid Heat and Power Generation Market - Competitive Landscape |
10.1 Serbia Bioliquid Heat and Power Generation Market Revenue Share, By Companies, 2025 |
10.2 Serbia Bioliquid Heat and Power Generation Market Competitive Benchmarking, By Operating and Technical Parameters |
11 Company Profiles |
12 Recommendations | 13 Disclaimer |

Export potential enables firms to identify high-growth global markets with greater confidence by combining advanced trade intelligence with a structured quantitative methodology. The framework analyzes emerging demand trends and country-level import patterns while integrating macroeconomic and trade datasets such as GDP and population forecasts, bilateral import–export flows, tariff structures, elasticity differentials between developed and developing economies, geographic distance, and import demand projections. Using weighted trade values from 2020–2024 as the base period to project country-to-country export potential for 2030, these inputs are operationalized through calculated drivers such as gravity model parameters, tariff impact factors, and projected GDP per-capita growth. Through an analysis of hidden potentials, demand hotspots, and market conditions that are most favorable to success, this method enables firms to focus on target countries, maximize returns, and global expansion with data, backed by accuracy.

By factoring in the projected importer demand gap that is currently unmet and could be potential opportunity, it identifies the potential for the Exporter (Country) among 190 countries, against the general trade analysis, which identifies the biggest importer or exporter.
To discover high-growth global markets and optimize your business strategy:
Click Here






























