Seychelles Desktop 3D Printing Market (2026-2032) | Size & Revenue, Outlook, Forecast, Segmentation, Analysis, Companies, Trends, Competitive Landscape, Industry, Value, Share, Growth
Market Forecast By Component (Hardware, Software, Services), By Technology (Stereolithography, Fuse Deposition Modeling, Selective Laser Sintering, Digital Light Processing, Laminated Object Manufacturing, Others), By Software (Design Software, Inspection Software, Printer Software, Scanning Software), By Application (Prototyping, Tooling, Functional Parts), By Vertical (Educational Purpose, Fashion & Jewelry, Objects, Dental/Healthcare, Food, Others), By Material (Plastic, Metal, Ceramic) And Competitive Landscape
| Product Code: ETC9228703 | Publication Date: Sep 2024 | Updated Date: Apr 2026 | Product Type: Market Research Report | |
| Publisher: 6Wresearch | Author: Sumit Sagar | No. of Pages: 75 | No. of Figures: 35 | No. of Tables: 20 |
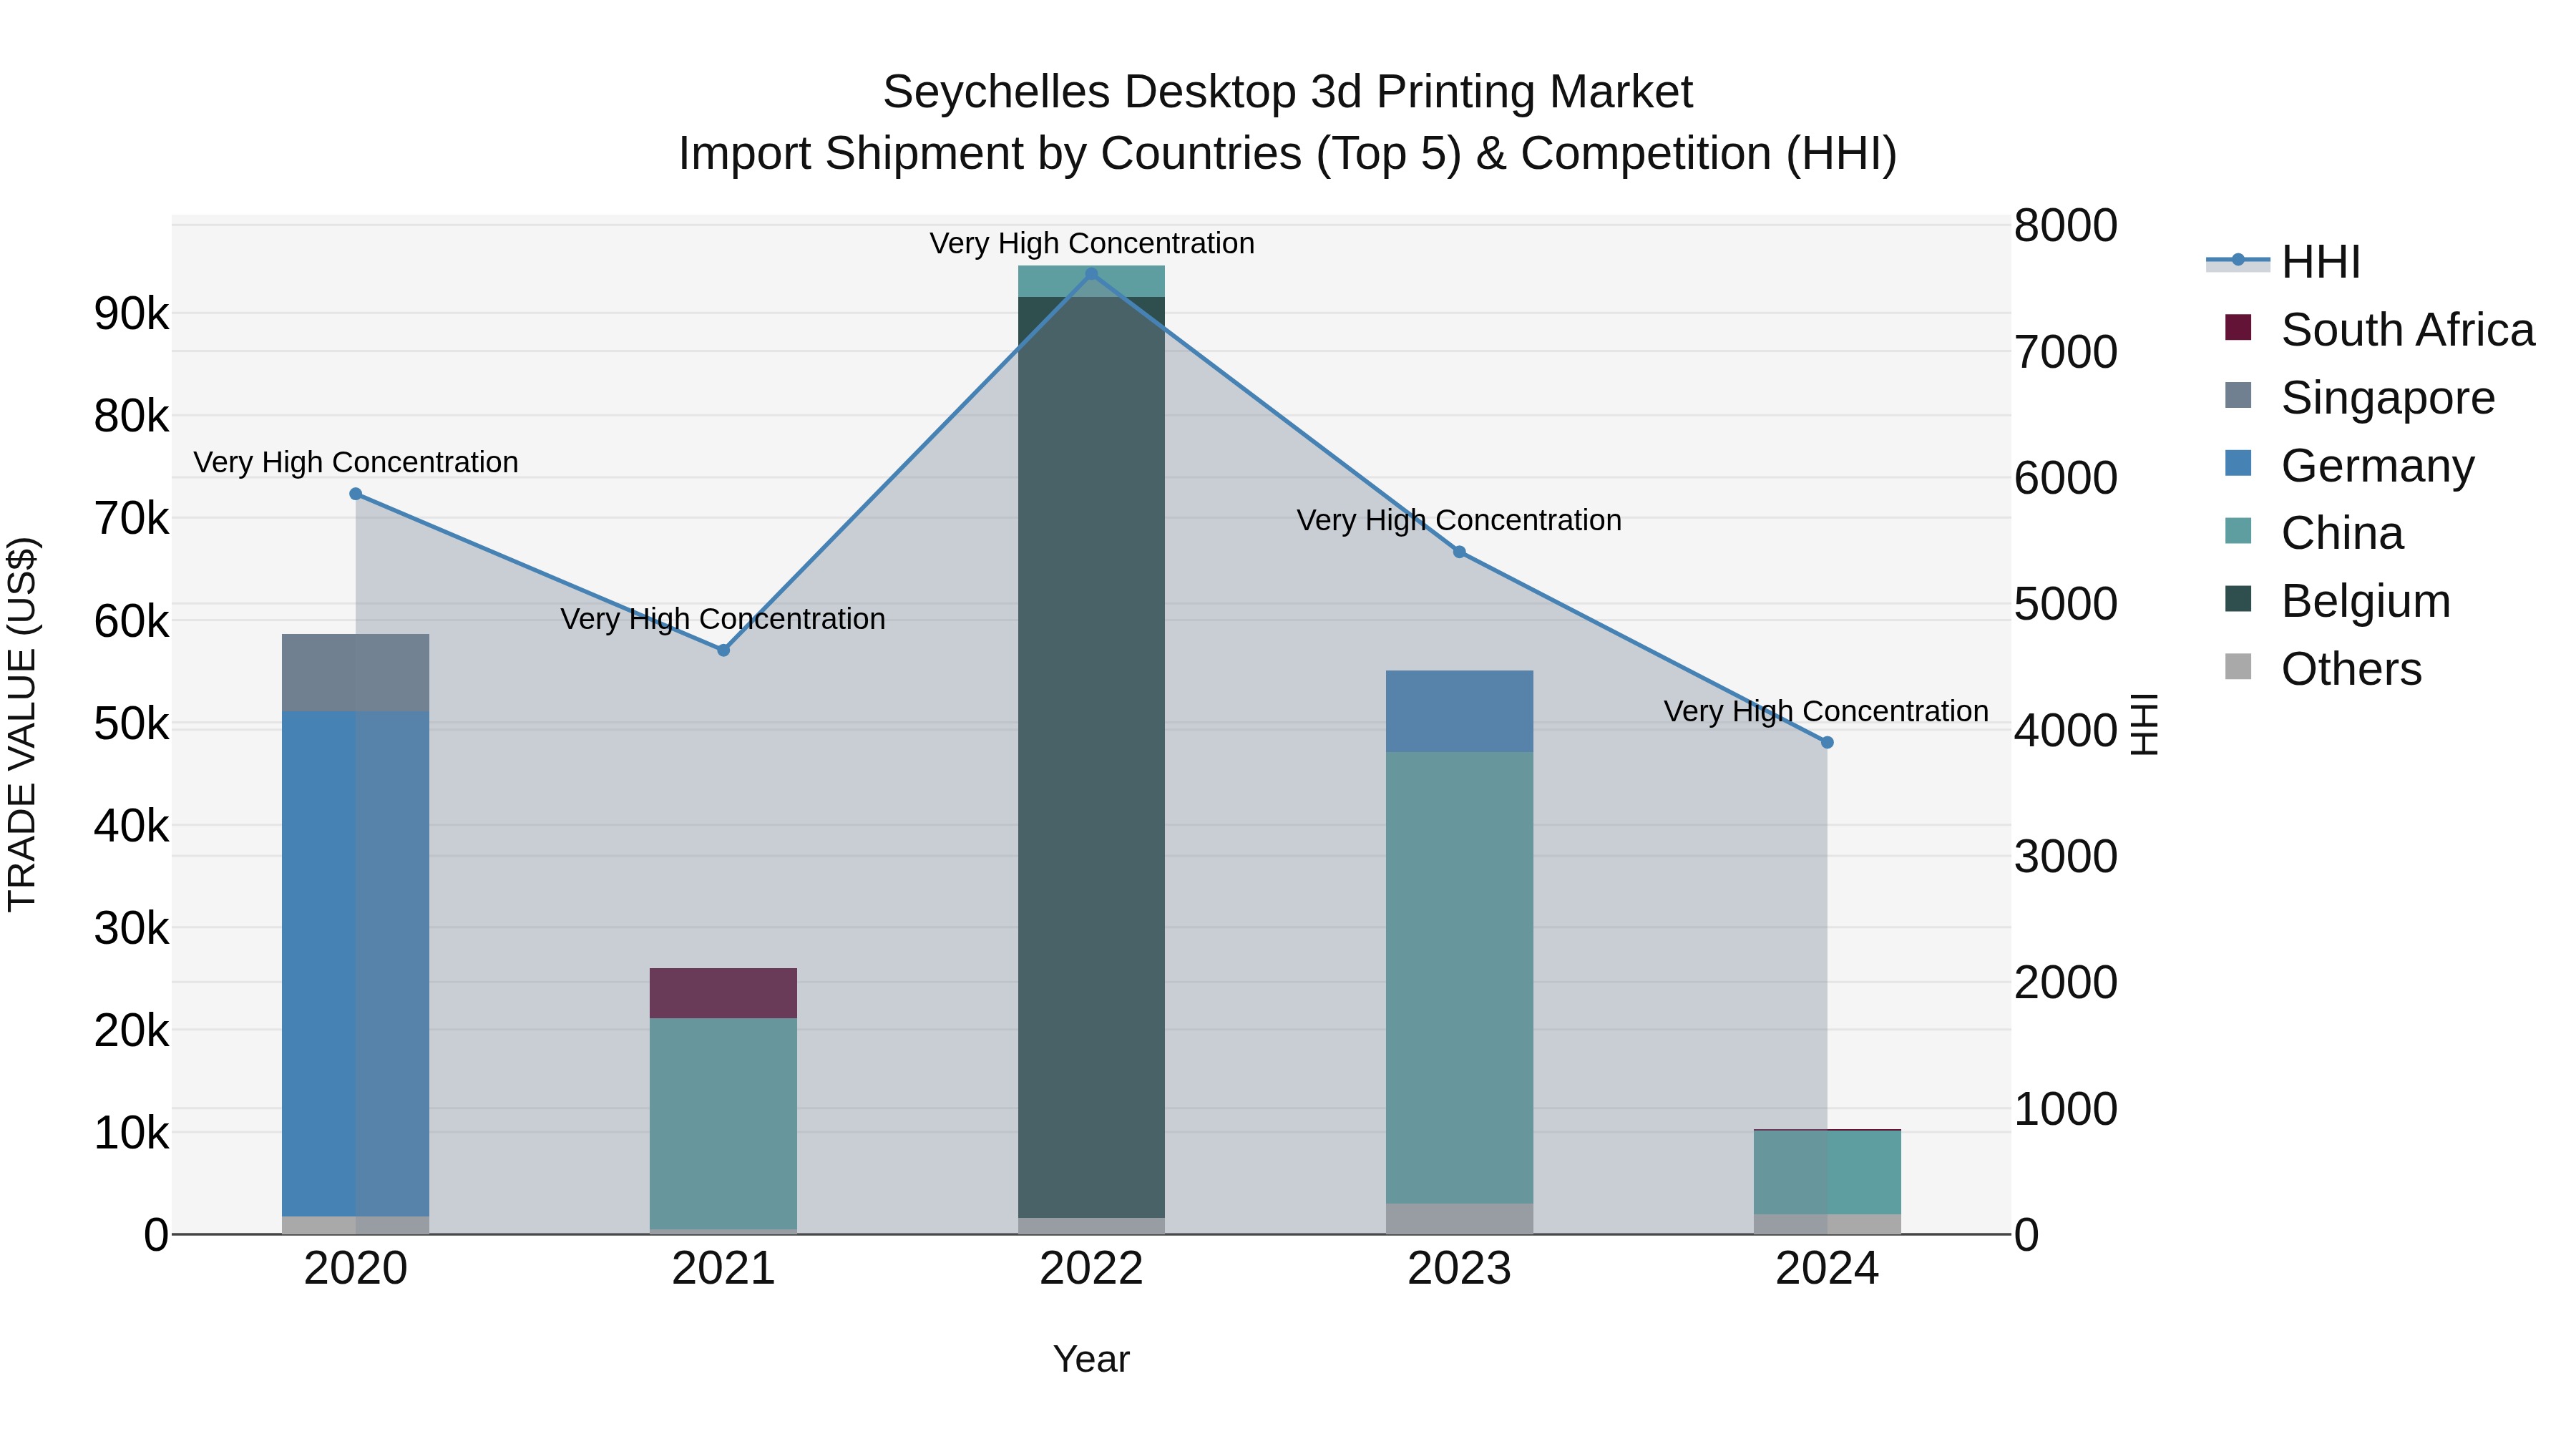
Seychelles Desktop 3d Printing Market: Top 5 Importing Countries and Market Competition (HHI) Analysis
Despite a high Herfindahl-Hirschman Index (HHI) indicating concentration, Seychelles continues to primarily import desktop 3D printers from China, India, Hong Kong, South Africa, and Sri Lanka. The market experienced a significant decline with a Compound Annual Growth Rate (CAGR) of -35.26% from 2020 to 2024, and a sharp decrease in growth rate of -81.31% from 2023 to 2024. This trend suggests a challenging environment for desktop 3D printing imports in Seychelles, potentially influenced by various factors impacting the industry.
Key Highlights of the Report:
- Seychelles Desktop 3D Printing Market Outlook
- Market Size of Seychelles Desktop 3D Printing Market, 2025
- Forecast of Seychelles Desktop 3D Printing Market, 2032
- Historical Data and Forecast of Seychelles Desktop 3D Printing Revenues & Volume for the Period 2022 - 2032
- Seychelles Desktop 3D Printing Market Trend Evolution
- Seychelles Desktop 3D Printing Market Drivers and Challenges
- Seychelles Desktop 3D Printing Price Trends
- Seychelles Desktop 3D Printing Porter's Five Forces
- Seychelles Desktop 3D Printing Industry Life Cycle
- Historical Data and Forecast of Seychelles Desktop 3D Printing Market Revenues & Volume By Component for the Period 2022 - 2032
- Historical Data and Forecast of Seychelles Desktop 3D Printing Market Revenues & Volume By Hardware for the Period 2022 - 2032
- Historical Data and Forecast of Seychelles Desktop 3D Printing Market Revenues & Volume By Software for the Period 2022 - 2032
- Historical Data and Forecast of Seychelles Desktop 3D Printing Market Revenues & Volume By Services for the Period 2022 - 2032
- Historical Data and Forecast of Seychelles Desktop 3D Printing Market Revenues & Volume By Technology for the Period 2022 - 2032
- Historical Data and Forecast of Seychelles Desktop 3D Printing Market Revenues & Volume By Stereolithography for the Period 2022 - 2032
- Historical Data and Forecast of Seychelles Desktop 3D Printing Market Revenues & Volume By Fuse Deposition Modeling for the Period 2022 - 2032
- Historical Data and Forecast of Seychelles Desktop 3D Printing Market Revenues & Volume By Selective Laser Sintering for the Period 2022 - 2032
- Historical Data and Forecast of Seychelles Desktop 3D Printing Market Revenues & Volume By Digital Light Processing for the Period 2022 - 2032
- Historical Data and Forecast of Seychelles Desktop 3D Printing Market Revenues & Volume By Laminated Object Manufacturing for the Period 2022 - 2032
- Historical Data and Forecast of Seychelles Desktop 3D Printing Market Revenues & Volume By Others for the Period 2022 - 2032
- Historical Data and Forecast of Seychelles Desktop 3D Printing Market Revenues & Volume By Software for the Period 2022 - 2032
- Historical Data and Forecast of Seychelles Desktop 3D Printing Market Revenues & Volume By Design Software for the Period 2022 - 2032
- Historical Data and Forecast of Seychelles Desktop 3D Printing Market Revenues & Volume By Inspection Software for the Period 2022 - 2032
- Historical Data and Forecast of Seychelles Desktop 3D Printing Market Revenues & Volume By Printer Software for the Period 2022 - 2032
- Historical Data and Forecast of Seychelles Desktop 3D Printing Market Revenues & Volume By Scanning Software for the Period 2022 - 2032
- Historical Data and Forecast of Seychelles Desktop 3D Printing Market Revenues & Volume By Application for the Period 2022 - 2032
- Historical Data and Forecast of Seychelles Desktop 3D Printing Market Revenues & Volume By Prototyping for the Period 2022 - 2032
- Historical Data and Forecast of Seychelles Desktop 3D Printing Market Revenues & Volume By Tooling for the Period 2022 - 2032
- Historical Data and Forecast of Seychelles Desktop 3D Printing Market Revenues & Volume By Functional Parts for the Period 2022 - 2032
- Historical Data and Forecast of Seychelles Desktop 3D Printing Market Revenues & Volume By Vertical for the Period 2022 - 2032
- Historical Data and Forecast of Seychelles Desktop 3D Printing Market Revenues & Volume By Educational Purpose for the Period 2022 - 2032
- Historical Data and Forecast of Seychelles Desktop 3D Printing Market Revenues & Volume By Fashion & Jewelry for the Period 2022 - 2032
- Historical Data and Forecast of Seychelles Desktop 3D Printing Market Revenues & Volume By Objects for the Period 2022 - 2032
- Historical Data and Forecast of Seychelles Desktop 3D Printing Market Revenues & Volume By Dental/Healthcare for the Period 2022 - 2032
- Historical Data and Forecast of Seychelles Desktop 3D Printing Market Revenues & Volume By Food for the Period 2022 - 2032
- Historical Data and Forecast of Seychelles Desktop 3D Printing Market Revenues & Volume By Others for the Period 2022 - 2032
- Historical Data and Forecast of Seychelles Desktop 3D Printing Market Revenues & Volume By Material for the Period 2022 - 2032
- Historical Data and Forecast of Seychelles Desktop 3D Printing Market Revenues & Volume By Plastic for the Period 2022 - 2032
- Historical Data and Forecast of Seychelles Desktop 3D Printing Market Revenues & Volume By Metal for the Period 2022 - 2032
- Historical Data and Forecast of Seychelles Desktop 3D Printing Market Revenues & Volume By Ceramic for the Period 2022 - 2032
- Seychelles Desktop 3D Printing Import Export Trade Statistics
- Market Opportunity Assessment By Component
- Market Opportunity Assessment By Technology
- Market Opportunity Assessment By Software
- Market Opportunity Assessment By Application
- Market Opportunity Assessment By Vertical
- Market Opportunity Assessment By Material
- Seychelles Desktop 3D Printing Top Companies Market Share
- Seychelles Desktop 3D Printing Competitive Benchmarking By Technical and Operational Parameters
- Seychelles Desktop 3D Printing Company Profiles
- Seychelles Desktop 3D Printing Key Strategic Recommendations
Frequently Asked Questions About the Market Study (FAQs):
6Wresearch actively monitors the Seychelles Desktop 3D Printing Market and publishes its comprehensive annual report, highlighting emerging trends, growth drivers, revenue analysis, and forecast outlook. Our insights help businesses to make data-backed strategic decisions with ongoing market dynamics. Our analysts track relevent industries related to the Seychelles Desktop 3D Printing Market, allowing our clients with actionable intelligence and reliable forecasts tailored to emerging regional needs.
Yes, we provide customisation as per your requirements. To learn more, feel free to contact us on sales@6wresearch.com
1 Executive Summary |
2 Introduction |
2.1 Key Highlights of the Report |
2.2 Report Description |
2.3 Market Scope & Segmentation |
2.4 Research Methodology |
2.5 Assumptions |
3 Seychelles Desktop 3D Printing Market Overview |
3.1 Seychelles Country Macro Economic Indicators |
3.2 Seychelles Desktop 3D Printing Market Revenues & Volume, 2022 & 2032F |
3.3 Seychelles Desktop 3D Printing Market - Industry Life Cycle |
3.4 Seychelles Desktop 3D Printing Market - Porter's Five Forces |
3.5 Seychelles Desktop 3D Printing Market Revenues & Volume Share, By Component, 2022 & 2032F |
3.6 Seychelles Desktop 3D Printing Market Revenues & Volume Share, By Technology, 2022 & 2032F |
3.7 Seychelles Desktop 3D Printing Market Revenues & Volume Share, By Software, 2022 & 2032F |
3.8 Seychelles Desktop 3D Printing Market Revenues & Volume Share, By Application, 2022 & 2032F |
3.9 Seychelles Desktop 3D Printing Market Revenues & Volume Share, By Vertical, 2022 & 2032F |
3.10 Seychelles Desktop 3D Printing Market Revenues & Volume Share, By Material, 2022 & 2032F |
4 Seychelles Desktop 3D Printing Market Dynamics |
4.1 Impact Analysis |
4.2 Market Drivers |
4.2.1 Increasing adoption of 3D printing technology in various industries |
4.2.2 Growing demand for customized and personalized products |
4.2.3 Advancements in desktop 3D printing technology leading to improved affordability and accessibility |
4.3 Market Restraints |
4.3.1 Limited awareness and understanding of desktop 3D printing technology |
4.3.2 High initial setup costs and ongoing maintenance expenses |
4.3.3 Lack of skilled professionals proficient in desktop 3D printing |
5 Seychelles Desktop 3D Printing Market Trends |
6 Seychelles Desktop 3D Printing Market, By Types |
6.1 Seychelles Desktop 3D Printing Market, By Component |
6.1.1 Overview and Analysis |
6.1.2 Seychelles Desktop 3D Printing Market Revenues & Volume, By Component, 2022 - 2032F |
6.1.3 Seychelles Desktop 3D Printing Market Revenues & Volume, By Hardware, 2022 - 2032F |
6.1.4 Seychelles Desktop 3D Printing Market Revenues & Volume, By Software, 2022 - 2032F |
6.1.5 Seychelles Desktop 3D Printing Market Revenues & Volume, By Services, 2022 - 2032F |
6.2 Seychelles Desktop 3D Printing Market, By Technology |
6.2.1 Overview and Analysis |
6.2.2 Seychelles Desktop 3D Printing Market Revenues & Volume, By Stereolithography, 2022 - 2032F |
6.2.3 Seychelles Desktop 3D Printing Market Revenues & Volume, By Fuse Deposition Modeling, 2022 - 2032F |
6.2.4 Seychelles Desktop 3D Printing Market Revenues & Volume, By Selective Laser Sintering, 2022 - 2032F |
6.2.5 Seychelles Desktop 3D Printing Market Revenues & Volume, By Digital Light Processing, 2022 - 2032F |
6.2.6 Seychelles Desktop 3D Printing Market Revenues & Volume, By Laminated Object Manufacturing, 2022 - 2032F |
6.2.7 Seychelles Desktop 3D Printing Market Revenues & Volume, By Others, 2022 - 2032F |
6.3 Seychelles Desktop 3D Printing Market, By Software |
6.3.1 Overview and Analysis |
6.3.2 Seychelles Desktop 3D Printing Market Revenues & Volume, By Design Software, 2022 - 2032F |
6.3.3 Seychelles Desktop 3D Printing Market Revenues & Volume, By Inspection Software, 2022 - 2032F |
6.3.4 Seychelles Desktop 3D Printing Market Revenues & Volume, By Printer Software, 2022 - 2032F |
6.3.5 Seychelles Desktop 3D Printing Market Revenues & Volume, By Scanning Software, 2022 - 2032F |
6.4 Seychelles Desktop 3D Printing Market, By Application |
6.4.1 Overview and Analysis |
6.4.2 Seychelles Desktop 3D Printing Market Revenues & Volume, By Prototyping, 2022 - 2032F |
6.4.3 Seychelles Desktop 3D Printing Market Revenues & Volume, By Tooling, 2022 - 2032F |
6.4.4 Seychelles Desktop 3D Printing Market Revenues & Volume, By Functional Parts, 2022 - 2032F |
6.5 Seychelles Desktop 3D Printing Market, By Vertical |
6.5.1 Overview and Analysis |
6.5.2 Seychelles Desktop 3D Printing Market Revenues & Volume, By Educational Purpose, 2022 - 2032F |
6.5.3 Seychelles Desktop 3D Printing Market Revenues & Volume, By Fashion & Jewelry, 2022 - 2032F |
6.5.4 Seychelles Desktop 3D Printing Market Revenues & Volume, By Objects, 2022 - 2032F |
6.5.5 Seychelles Desktop 3D Printing Market Revenues & Volume, By Dental/Healthcare, 2022 - 2032F |
6.5.6 Seychelles Desktop 3D Printing Market Revenues & Volume, By Food, 2022 - 2032F |
6.5.7 Seychelles Desktop 3D Printing Market Revenues & Volume, By Others, 2022 - 2032F |
6.6 Seychelles Desktop 3D Printing Market, By Material |
6.6.1 Overview and Analysis |
6.6.2 Seychelles Desktop 3D Printing Market Revenues & Volume, By Plastic, 2022 - 2032F |
6.6.3 Seychelles Desktop 3D Printing Market Revenues & Volume, By Metal, 2022 - 2032F |
6.6.4 Seychelles Desktop 3D Printing Market Revenues & Volume, By Ceramic, 2022 - 2032F |
7 Seychelles Desktop 3D Printing Market Import-Export Trade Statistics |
7.1 Seychelles Desktop 3D Printing Market Export to Major Countries |
7.2 Seychelles Desktop 3D Printing Market Imports from Major Countries |
8 Seychelles Desktop 3D Printing Market Key Performance Indicators |
8.1 Percentage increase in the number of desktop 3D printers sold in Seychelles |
8.2 Growth in the number of local businesses utilizing desktop 3D printing technology |
8.3 Expansion of desktop 3D printing service providers in Seychelles |
8.4 Number of educational institutions incorporating desktop 3D printing in their curriculum |
8.5 Increase in the number of desktop 3D printing workshops and training programs conducted in Seychelles |
9 Seychelles Desktop 3D Printing Market - Opportunity Assessment |
9.1 Seychelles Desktop 3D Printing Market Opportunity Assessment, By Component, 2022 & 2032F |
9.2 Seychelles Desktop 3D Printing Market Opportunity Assessment, By Technology, 2022 & 2032F |
9.3 Seychelles Desktop 3D Printing Market Opportunity Assessment, By Software, 2022 & 2032F |
9.4 Seychelles Desktop 3D Printing Market Opportunity Assessment, By Application, 2022 & 2032F |
9.5 Seychelles Desktop 3D Printing Market Opportunity Assessment, By Vertical, 2022 & 2032F |
9.6 Seychelles Desktop 3D Printing Market Opportunity Assessment, By Material, 2022 & 2032F |
10 Seychelles Desktop 3D Printing Market - Competitive Landscape |
10.1 Seychelles Desktop 3D Printing Market Revenue Share, By Companies, 2025 |
10.2 Seychelles Desktop 3D Printing Market Competitive Benchmarking, By Operating and Technical Parameters |
11 Company Profiles |
12 Recommendations |
13 Disclaimer |
Global Go To Market Strategy - 2030
Export potential enables firms to identify high-growth global markets with greater confidence by combining advanced trade intelligence with a structured quantitative methodology. The framework analyzes emerging demand trends and country-level import patterns while integrating macroeconomic and trade datasets such as GDP and population forecasts, bilateral import–export flows, tariff structures, elasticity differentials between developed and developing economies, geographic distance, and import demand projections. Using weighted trade values from 2020–2024 as the base period to project country-to-country export potential for 2030, these inputs are operationalized through calculated drivers such as gravity model parameters, tariff impact factors, and projected GDP per-capita growth. Through an analysis of hidden potentials, demand hotspots, and market conditions that are most favorable to success, this method enables firms to focus on target countries, maximize returns, and global expansion with data, backed by accuracy.
By factoring in the projected importer demand gap that is currently unmet and could be potential opportunity, it identifies the potential for the Exporter (Country) among 190 countries, against the general trade analysis, which identifies the biggest importer or exporter.
To discover high-growth global markets and optimize your business strategy:
Click Here
Pricing
- Single User License$ 1,995
- Department License$ 2,400
- Site License$ 3,120
- Global License$ 3,795

Leadership Perspectives from Industry Events
Search
Thought Leadership and Analyst Meet


Our Clients
6WResearch In News
- India Air Conditioner Market Set for Strong Rebound in 2026 After Weather-Led Correction and GST-Driven Recovery: 6Wresearch
- ADAS in India: How Automatic Emergency Braking, Blind Spot Detection & Driver Monitoring are Transforming Road Safety
- Doha a strategic location for EV manufacturing hub: IPA Qatar
- Demand for luxury TVs surging in the GCC, says Samsung
- Empowering Growth: The Thriving Journey of Bangladesh’s Cable Industry
- Demand for luxury TVs surging in the GCC, says Samsung
Latest Reports
- Poland Fire Protection Systems Market (2026-2032)
- Cape Verde Portable Hand-Thrown Extinguisher Market (2026-2032)
- Canada Portable Hand-Thrown Extinguisher Market (2026-2032)
- Cameroon Portable Hand-Thrown Extinguisher Market (2026-2032)
- Burundi Portable Hand-Thrown Extinguisher Market (2026-2032)
- Burkina Faso Portable Hand-Thrown Extinguisher Market (2026-2032)
- Bulgaria Portable Hand-Thrown Extinguisher Market (2026-2032)
- Brunei Portable Hand-Thrown Extinguisher Market (2026-2032)
- Botswana Portable Hand-Thrown Extinguisher Market (2026-2032)
- Bosnia and Herzegovina Portable Hand-Thrown Extinguisher Market (2026-2032)
Industry Events and Analyst Meet

HIMTEX 2026

India Refining Summit 2026

India EV Show 2026

EV tech India Expo 2026

Auto Tech Asia 2026
Whitepaper
- Middle East & Africa Commercial Security Market Click here to view more.
- Middle East & Africa Fire Safety Systems & Equipment Market Click here to view more.
- GCC Drone Market Click here to view more.
- Middle East Lighting Fixture Market Click here to view more.
- GCC Physical & Perimeter Security Market Click here to view more.