Singapore Computer Power Cable Assemblies Market (2026-2032) | Size, Forecast, Share, Industry, Analysis, Outlook, Revenue, Trends, Companies, Value & Growth
Market Forecast By Types (4-Pin Molex, 20-Pin ATX, 26-Pin MDR, 26-Pin SDR), By Applications (PC, Laptop, Super Computer, Others) And Competitive Landscape
| Product Code: ETC032447 | Publication Date: Jul 2023 | Updated Date: Jun 2026 | Product Type: Report | |
| Publisher: 6Wresearch | Author: Ravi Bhandari | No. of Pages: 70 | No. of Figures: 35 | No. of Tables: 5 |
Singapore Computer Power Cable Assemblies Market Summary
The singapore computer power cable assemblies market was estimated at USD 227 Million in 2025 and is projected to reach USD 304 Million by 2032, growing at a CAGR of 5.1% from 2026 to 2032.
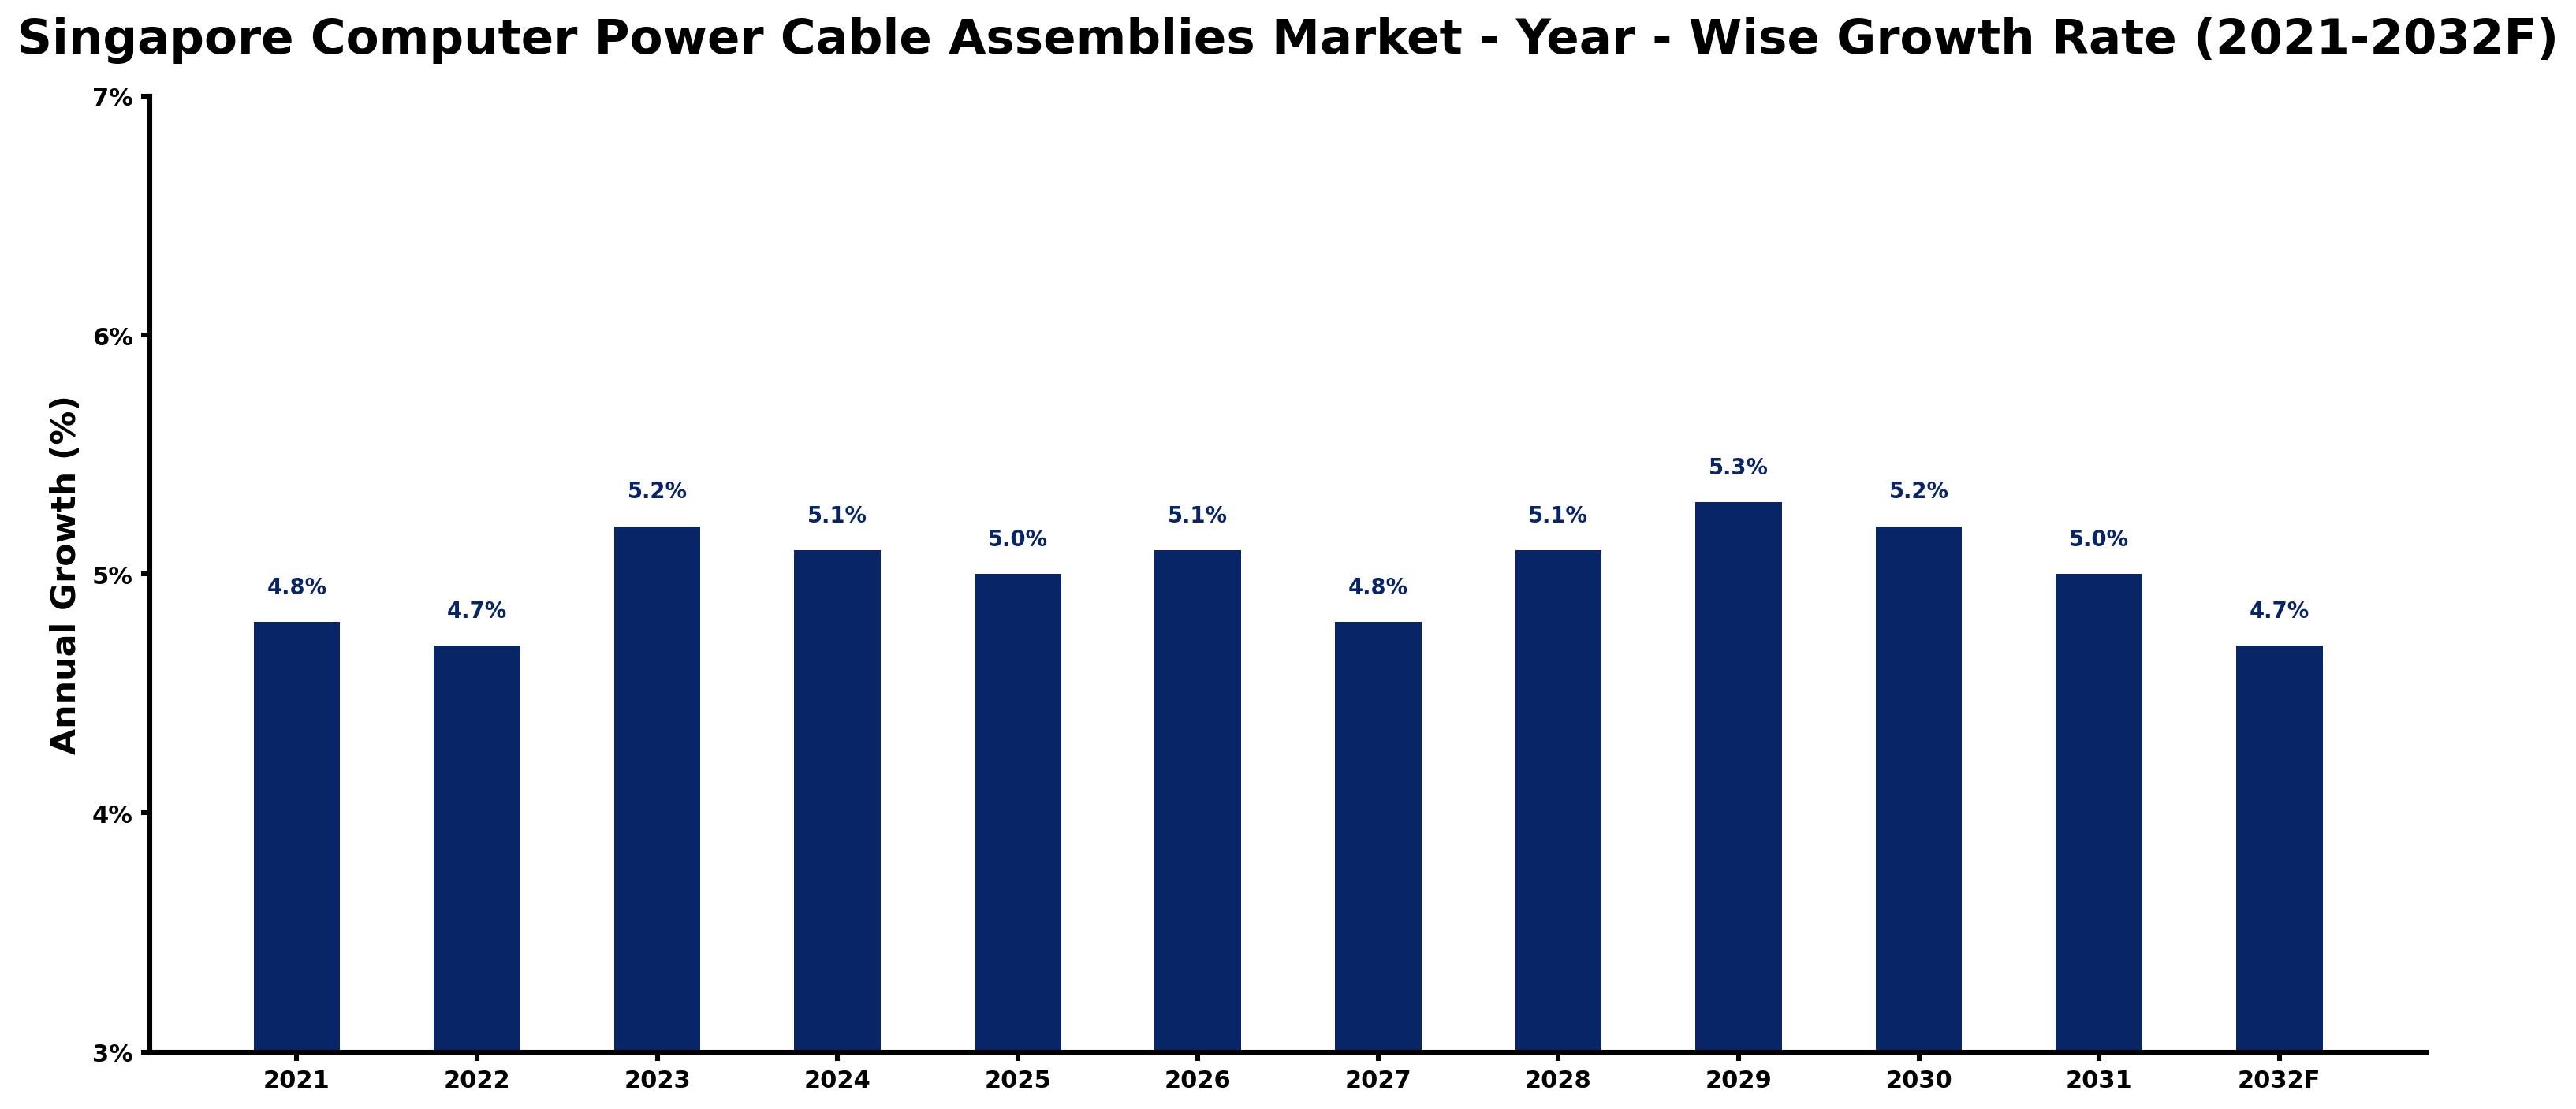
Singapore Computer Power Cable Assemblies Market Growth Rate Analysis (2021-2032)
The Singapore Computer Power Cable Assemblies market has exhibited steady growth, with rates of 4.8% in 2021 and 4.7% in 2022. Notably, the market saw an uptick to 5.2% in 2023, driven by increasing investments in digital infrastructure, as well as a rising consumer demand for advanced computing solutions. Growth is expected to stabilize at around 5% through 2025, reflecting ongoing governmental support for technology initiatives and energy-efficient solutions. Minor fluctuations like the drop to 4.7% in 2032 can be attributed to market saturation and global supply chain challenges. However, trends towards energy transition and robust technological advancements are anticipated to sustain forward momentum in the foreseeable future.
Singapore Computer Power Cable Assemblies Market Year-wise Growth Rate and Key Drivers
This graph highlights how the Singapore Computer Power Cable Assemblies Market has steadily grown over the past five years, supported by major growth factors.
The table below presents the year wise growth rates along with the key drivers influencing the market
| Year | Growth Rate | Major Drivers |
| 2021 | 4.8% | Post-lockdown retail projects stimulated demand for reliable cable assembly solutions. |
| 2022 | 4.7% | Legacy copper grid failures highlighted the need for advanced power transmission systems. |
| 2023 | 5.2% | Corporate investments in data centers increased the necessity for high-quality cable assemblies. |
| 2024 | 5.1% | Smart city developments in Singapore encouraged innovative electrical infrastructure upgrades. |
| 2025 | 5.0% | Emerging technologies like IoT required specialized cabling for enhanced connectivity. |
| 2026 | 5.1% | Increased focus on sustainability drove interest toward eco-friendly cable assembly materials. |
| 2027 | 4.8% | Regional manufacturing hubs sought local suppliers for reduced logistics and costs. |
| 2028 | 5.1% | The shift to renewable energy sources necessitated robust power distribution solutions. |
| 2029 | 5.3% | Enterprise budgets prioritizing digital transformation further boosted cable assembly requirements. |
| 2030 | 5.2% | Urbanization trends showcased the need for improved electrical grid capabilities. |
| 2031 | 5.0% | Technological upgrades in manufacturing demanded precision-engineered cable assemblies. |
| 2032 | 4.7% | Collaboration between tech firms and infrastructure projects aimed at optimizing energy efficiency. |
Note - Market size estimations and growth projections presented in this report are based on 6Wresearch's advanced forecasting approach, validated with industry datasets as of June 2026.
Singapore Computer Power Cable Assemblies Market Synopsis
The Singapore Computer Power Cable Assemblies Market is projected to reach 5.1% and witness significant growth during the forecast period (2026-2032). Driven by a surge in demand for efficient and reliable power supply solutions for various computing devices, this market is poised to benefit from advancements in technology and an evolving landscape of consumer electronics. The increasing reliance on computers across diverse sectors, including IT and telecom, automotive, consumer electronics, and healthcare, is further bolstering this growth trajectory.
Singapore Computer Power Cable Assemblies Market Growth Drivers
The steady rise in the Singapore Computer Power Cable Assemblies Market can be attributed to several critical growth drivers:
- Increased Adoption of Smart Devices: The growing popularity of smart devices has led to heightened demand for computer power cable assemblies. Their ability to optimize performance and reduce energy consumption aligns with consumer preferences for efficiency.
- Technological Advancements: Manufacturers are innovating by integrating advanced technologies that enhance data transmission efficiency, thereby minimizing losses. This continual evolution is attracting more users looking for high-performance solutions.
- Expansion of the Industrial Sector: Rapid industrialization in Singapore, supported by favorable business conditions and government incentives, has boosted demand for reliable power cable solutions. This growth creates a robust environment for investments in cable assembly technologies.
- Shifts towards Renewable Energy: Government initiatives promoting renewable energy sources have created a market for power cable assemblies that support these advancements, further enhancing market opportunities.
- Integration in Emerging Applications: As industries evolve with new applications, there's an enhanced requirement for specialized computer power cable assemblies that cater to diverse sectors, driving market growth.
Singapore Computer Power Cable Assemblies Market Challenges and Restraints
While the market shows promise, several challenges could impede its growth:
- Raw Material Limitations: The availability of key materials, especially copper, is limited, leading to increased production costs. This constraint can significantly affect pricing strategies and overall competitiveness in the market.
- High Initial Setup Costs: Establishing manufacturing facilities for computer power cables entails substantial investment. The associated financial burden may deter new entrants from participating actively in the market.
- Supply Chain Vulnerabilities: Disruptions in the global supply chain, particularly in the wake of the COVID-19 pandemic, have highlighted vulnerabilities that can impact the availability and delivery of essential components.
- Regulatory Compliance: Adhering to stringent regulatory requirements concerning quality and environmental standards can impose additional challenges for manufacturers, affecting market entry and operational costs.
- Competition from Alternative Solutions: The emergence of alternative technologies may challenge the traditional power cable assembly market, necessitating continuous innovation and adaptation among existing players.
Singapore Computer Power Cable Assemblies Market Government Investment and Initiatives
The Singapore government has recognized the importance of the computer power cable assemblies market as part of its broader strategy to promote technological innovation and sustainability. Various initiatives, such as grants and subsidies for research and development, aim to encourage investment in advanced manufacturing processes. Additionally, public spending on infrastructure development directly influences the demand for high-quality power cable assemblies, as sectors like IT, healthcare, and telecommunications expand. Incentives for renewable energy deployment are also paving the way for increased adoption of power cable assemblies designed to support eco-friendly technologies.
Singapore Computer Power Cable Assemblies Market Latest Developments (May 2025 - June 2026)
Recent developments within the Singapore Computer Power Cable Assemblies Market reflect a dynamic industry responding rapidly to changing technological demands. The period from May 2025 to June 2026 has seen advancements in manufacturing techniques aimed at enhancing the efficiency of power cable assemblies. Companies are increasingly focusing on sustainability, leading to the adoption of eco-friendly materials and processes. Furthermore, strategic partnerships have emerged as a prevalent trend, where manufacturers collaborate to develop innovative solutions tailored for specific applications in key sectors like telecommunications and healthcare.
Singapore Computer Power Cable Assemblies Market - Key Attractiveness of the Report
- 10 Years of Market Numbers
- Historical Data Starting from 2022 to 2025
- Base Year: 2025
- Forecast Data until 2032
- Key Performance Indicators Impacting the Market
- Major Upcoming Developments and Projects
Key Highlights of the Report:
- Singapore Computer Power Cable Assemblies Market Outlook
- Market Size of Singapore Computer Power Cable Assemblies Market, 2025
- Forecast of Singapore Computer Power Cable Assemblies Market, 2032F
- Historical Data and Forecast of Singapore Computer Power Cable Assemblies Revenues & Volume for the Period 2022-2032F
- Singapore Computer Power Cable Assemblies Market Trend Evolution
- Singapore Computer Power Cable Assemblies Market Drivers and Challenges
- Singapore Computer Power Cable Assemblies Price Trends
- Singapore Computer Power Cable Assemblies Porter's Five Forces
- Singapore Computer Power Cable Assemblies Industry Life Cycle
- Historical Data and Forecast of Singapore Computer Power Cable Assemblies Market Revenues & Volume By Types for the Period 2022-2032F
- Historical Data and Forecast of Singapore Computer Power Cable Assemblies Market Revenues & Volume By 4-Pin Molex for the Period 2022-2032F
- Historical Data and Forecast of Singapore Computer Power Cable Assemblies Market Revenues & Volume By 20-Pin ATX for the Period 2022-2032F
- Historical Data and Forecast of Singapore Computer Power Cable Assemblies Market Revenues & Volume By 26-Pin MDR for the Period 2022-2032F
- Historical Data and Forecast of Singapore Computer Power Cable Assemblies Market Revenues & Volume By 26-Pin SDR for the Period 2022-2032F
- Historical Data and Forecast of Singapore Computer Power Cable Assemblies Market Revenues & Volume By Applications for the Period 2022-2032F
- Historical Data and Forecast of Singapore Computer Power Cable Assemblies Market Revenues & Volume By PC for the Period 2022-2032F
- Historical Data and Forecast of Singapore Computer Power Cable Assemblies Market Revenues & Volume By Laptop for the Period 2022-2032F
- Historical Data and Forecast of Singapore Computer Power Cable Assemblies Market Revenues & Volume By Super Computer for the Period 2022-2032F
- Historical Data and Forecast of Singapore Computer Power Cable Assemblies Market Revenues & Volume By Others for the Period 2022-2032F
- Singapore Computer Power Cable Assemblies Import Export Trade Statistics
- Market Opportunity Assessment By Types
- Market Opportunity Assessment By Applications
- Singapore Computer Power Cable Assemblies Top Companies Market Share
- Singapore Computer Power Cable Assemblies Competitive Benchmarking By Technical and Operational Parameters
- Singapore Computer Power Cable Assemblies Company Profiles
- Singapore Computer Power Cable Assemblies Key Strategic Recommendations
Frequently Asked Questions About the Market Study (FAQs):
The growth is primarily fueled by increased adoption of smart devices, technological advancements in cable assembly manufacturing, and the expansion of various industrial sectors.
The government supports the market through grants and subsidies for research, public infrastructure spending, and initiatives aimed at promoting renewable energy solutions.
Challenges include limited raw material availability, high production costs, and the need for regulatory compliance, which can impact competitiveness.
Emerging trends include a focus on sustainability, the adoption of eco-friendly materials, and increasing collaboration among manufacturers to innovate products for specific applications.
6Wresearch actively monitors the Singapore Computer Power Cable Assemblies Market and publishes its comprehensive annual report, highlighting emerging trends, growth drivers, revenue analysis, and forecast outlook. Our insights help businesses to make data-backed strategic decisions with ongoing market dynamics. Our analysts track relevent industries related to the Singapore Computer Power Cable Assemblies Market, allowing our clients with actionable intelligence and reliable forecasts tailored to emerging regional needs.
Yes, we provide customisation as per your requirements. To learn more, feel free to contact us on sales@6wresearch.com
1 Executive Summary |
2 Introduction |
2.1 Key Highlights of the Report |
2.2 Report Description |
2.3 Market Scope & Segmentation |
2.4 Research Methodology |
2.5 Assumptions |
3 Singapore Computer Power Cable Assemblies Market Overview |
3.1 Singapore Country Macro Economic Indicators |
3.2 Singapore Computer Power Cable Assemblies Market Revenues & Volume, 2022 & 2032F |
3.3 Singapore Computer Power Cable Assemblies Market - Industry Life Cycle |
3.4 Singapore Computer Power Cable Assemblies Market - Porter's Five Forces |
3.5 Singapore Computer Power Cable Assemblies Market Revenues & Volume Share, By Types, 2022 & 2032F |
3.6 Singapore Computer Power Cable Assemblies Market Revenues & Volume Share, By Applications, 2022 & 2032F |
4 Singapore Computer Power Cable Assemblies Market Dynamics |
4.1 Impact Analysis |
4.2 Market Drivers |
4.3 Market Restraints |
5 Singapore Computer Power Cable Assemblies Market Trends |
6 Singapore Computer Power Cable Assemblies Market, By Types |
6.1 Singapore Computer Power Cable Assemblies Market, By Types |
6.1.1 Overview and Analysis |
6.1.2 Singapore Computer Power Cable Assemblies Market Revenues & Volume, By Types, 2022-2032F |
6.1.3 Singapore Computer Power Cable Assemblies Market Revenues & Volume, By 4-Pin Molex, 2022-2032F |
6.1.4 Singapore Computer Power Cable Assemblies Market Revenues & Volume, By 20-Pin ATX, 2022-2032F |
6.1.5 Singapore Computer Power Cable Assemblies Market Revenues & Volume, By 26-Pin MDR, 2022-2032F |
6.1.6 Singapore Computer Power Cable Assemblies Market Revenues & Volume, By 26-Pin SDR, 2022-2032F |
6.2 Singapore Computer Power Cable Assemblies Market, By Applications |
6.2.1 Overview and Analysis |
6.2.2 Singapore Computer Power Cable Assemblies Market Revenues & Volume, By PC, 2022-2032F |
6.2.3 Singapore Computer Power Cable Assemblies Market Revenues & Volume, By Laptop, 2022-2032F |
6.2.4 Singapore Computer Power Cable Assemblies Market Revenues & Volume, By Super Computer, 2022-2032F |
6.2.5 Singapore Computer Power Cable Assemblies Market Revenues & Volume, By Others, 2022-2032F |
7 Singapore Computer Power Cable Assemblies Market Import-Export Trade Statistics |
7.1 Singapore Computer Power Cable Assemblies Market Export to Major Countries |
7.2 Singapore Computer Power Cable Assemblies Market Imports from Major Countries |
8 Singapore Computer Power Cable Assemblies Market Key Performance Indicators |
9 Singapore Computer Power Cable Assemblies Market - Opportunity Assessment |
9.1 Singapore Computer Power Cable Assemblies Market Opportunity Assessment, By Types, 2022 & 2032F |
9.2 Singapore Computer Power Cable Assemblies Market Opportunity Assessment, By Applications, 2022 & 2032F |
10 Singapore Computer Power Cable Assemblies Market - Competitive Landscape |
10.1 Singapore Computer Power Cable Assemblies Market Revenue Share, By Companies, 2025 |
10.2 Singapore Computer Power Cable Assemblies Market Competitive Benchmarking, By Operating and Technical Parameters |
11 Company Profiles |
12 Recommendations |
13 Disclaimer |
Global Go To Market Strategy - 2030
Export potential enables firms to identify high-growth global markets with greater confidence by combining advanced trade intelligence with a structured quantitative methodology. The framework analyzes emerging demand trends and country-level import patterns while integrating macroeconomic and trade datasets such as GDP and population forecasts, bilateral import–export flows, tariff structures, elasticity differentials between developed and developing economies, geographic distance, and import demand projections. Using weighted trade values from 2020–2024 as the base period to project country-to-country export potential for 2030, these inputs are operationalized through calculated drivers such as gravity model parameters, tariff impact factors, and projected GDP per-capita growth. Through an analysis of hidden potentials, demand hotspots, and market conditions that are most favorable to success, this method enables firms to focus on target countries, maximize returns, and global expansion with data, backed by accuracy.
By factoring in the projected importer demand gap that is currently unmet and could be potential opportunity, it identifies the potential for the Exporter (Country) among 190 countries, against the general trade analysis, which identifies the biggest importer or exporter.
To discover high-growth global markets and optimize your business strategy:
Click Here
Pricing
- Single User License$ 1,995
- Department License$ 2,400
- Site License$ 3,120
- Global License$ 3,795

Leadership Perspectives from Industry Events
Search
Thought Leadership and Analyst Meet


Our Clients
6WResearch In News
- India Air Conditioner Market Set for Strong Rebound in 2026 After Weather-Led Correction and GST-Driven Recovery: 6Wresearch
- ADAS in India: How Automatic Emergency Braking, Blind Spot Detection & Driver Monitoring are Transforming Road Safety
- Doha a strategic location for EV manufacturing hub: IPA Qatar
- Demand for luxury TVs surging in the GCC, says Samsung
- Empowering Growth: The Thriving Journey of Bangladesh’s Cable Industry
- Demand for luxury TVs surging in the GCC, says Samsung
Latest Reports
- Poland Fire Protection Systems Market (2026-2032)
- Cape Verde Portable Hand-Thrown Extinguisher Market (2026-2032)
- Canada Portable Hand-Thrown Extinguisher Market (2026-2032)
- Cameroon Portable Hand-Thrown Extinguisher Market (2026-2032)
- Burundi Portable Hand-Thrown Extinguisher Market (2026-2032)
- Burkina Faso Portable Hand-Thrown Extinguisher Market (2026-2032)
- Bulgaria Portable Hand-Thrown Extinguisher Market (2026-2032)
- Brunei Portable Hand-Thrown Extinguisher Market (2026-2032)
- Botswana Portable Hand-Thrown Extinguisher Market (2026-2032)
- Bosnia and Herzegovina Portable Hand-Thrown Extinguisher Market (2026-2032)
Industry Events and Analyst Meet

HIMTEX 2026

India Refining Summit 2026

India EV Show 2026

EV tech India Expo 2026

Auto Tech Asia 2026
Whitepaper
- Middle East & Africa Commercial Security Market Click here to view more.
- Middle East & Africa Fire Safety Systems & Equipment Market Click here to view more.
- GCC Drone Market Click here to view more.
- Middle East Lighting Fixture Market Click here to view more.
- GCC Physical & Perimeter Security Market Click here to view more.