Slovakia Glassy Carbon Electrode Market (2026-2032) Outlook | Analysis, Forecast, Revenue, Value, Size, Growth, Share, Industry, Trends & Companies
Market Forecast By Size (Below 3mm, Above 3mm), By Application (Chemically Modified Electrode, Anodic Solution, Working Electrode, Others) And Competitive Landscape
| Product Code: ETC264140 | Publication Date: Aug 2022 | Updated Date: Apr 2026 | Product Type: Market Research Report | |
| Publisher: 6Wresearch | Author: Ravi Bhandari | No. of Pages: 75 | No. of Figures: 35 | No. of Tables: 20 |
Slovakia Glassy Carbon Electrode Market Size (2020-2030)
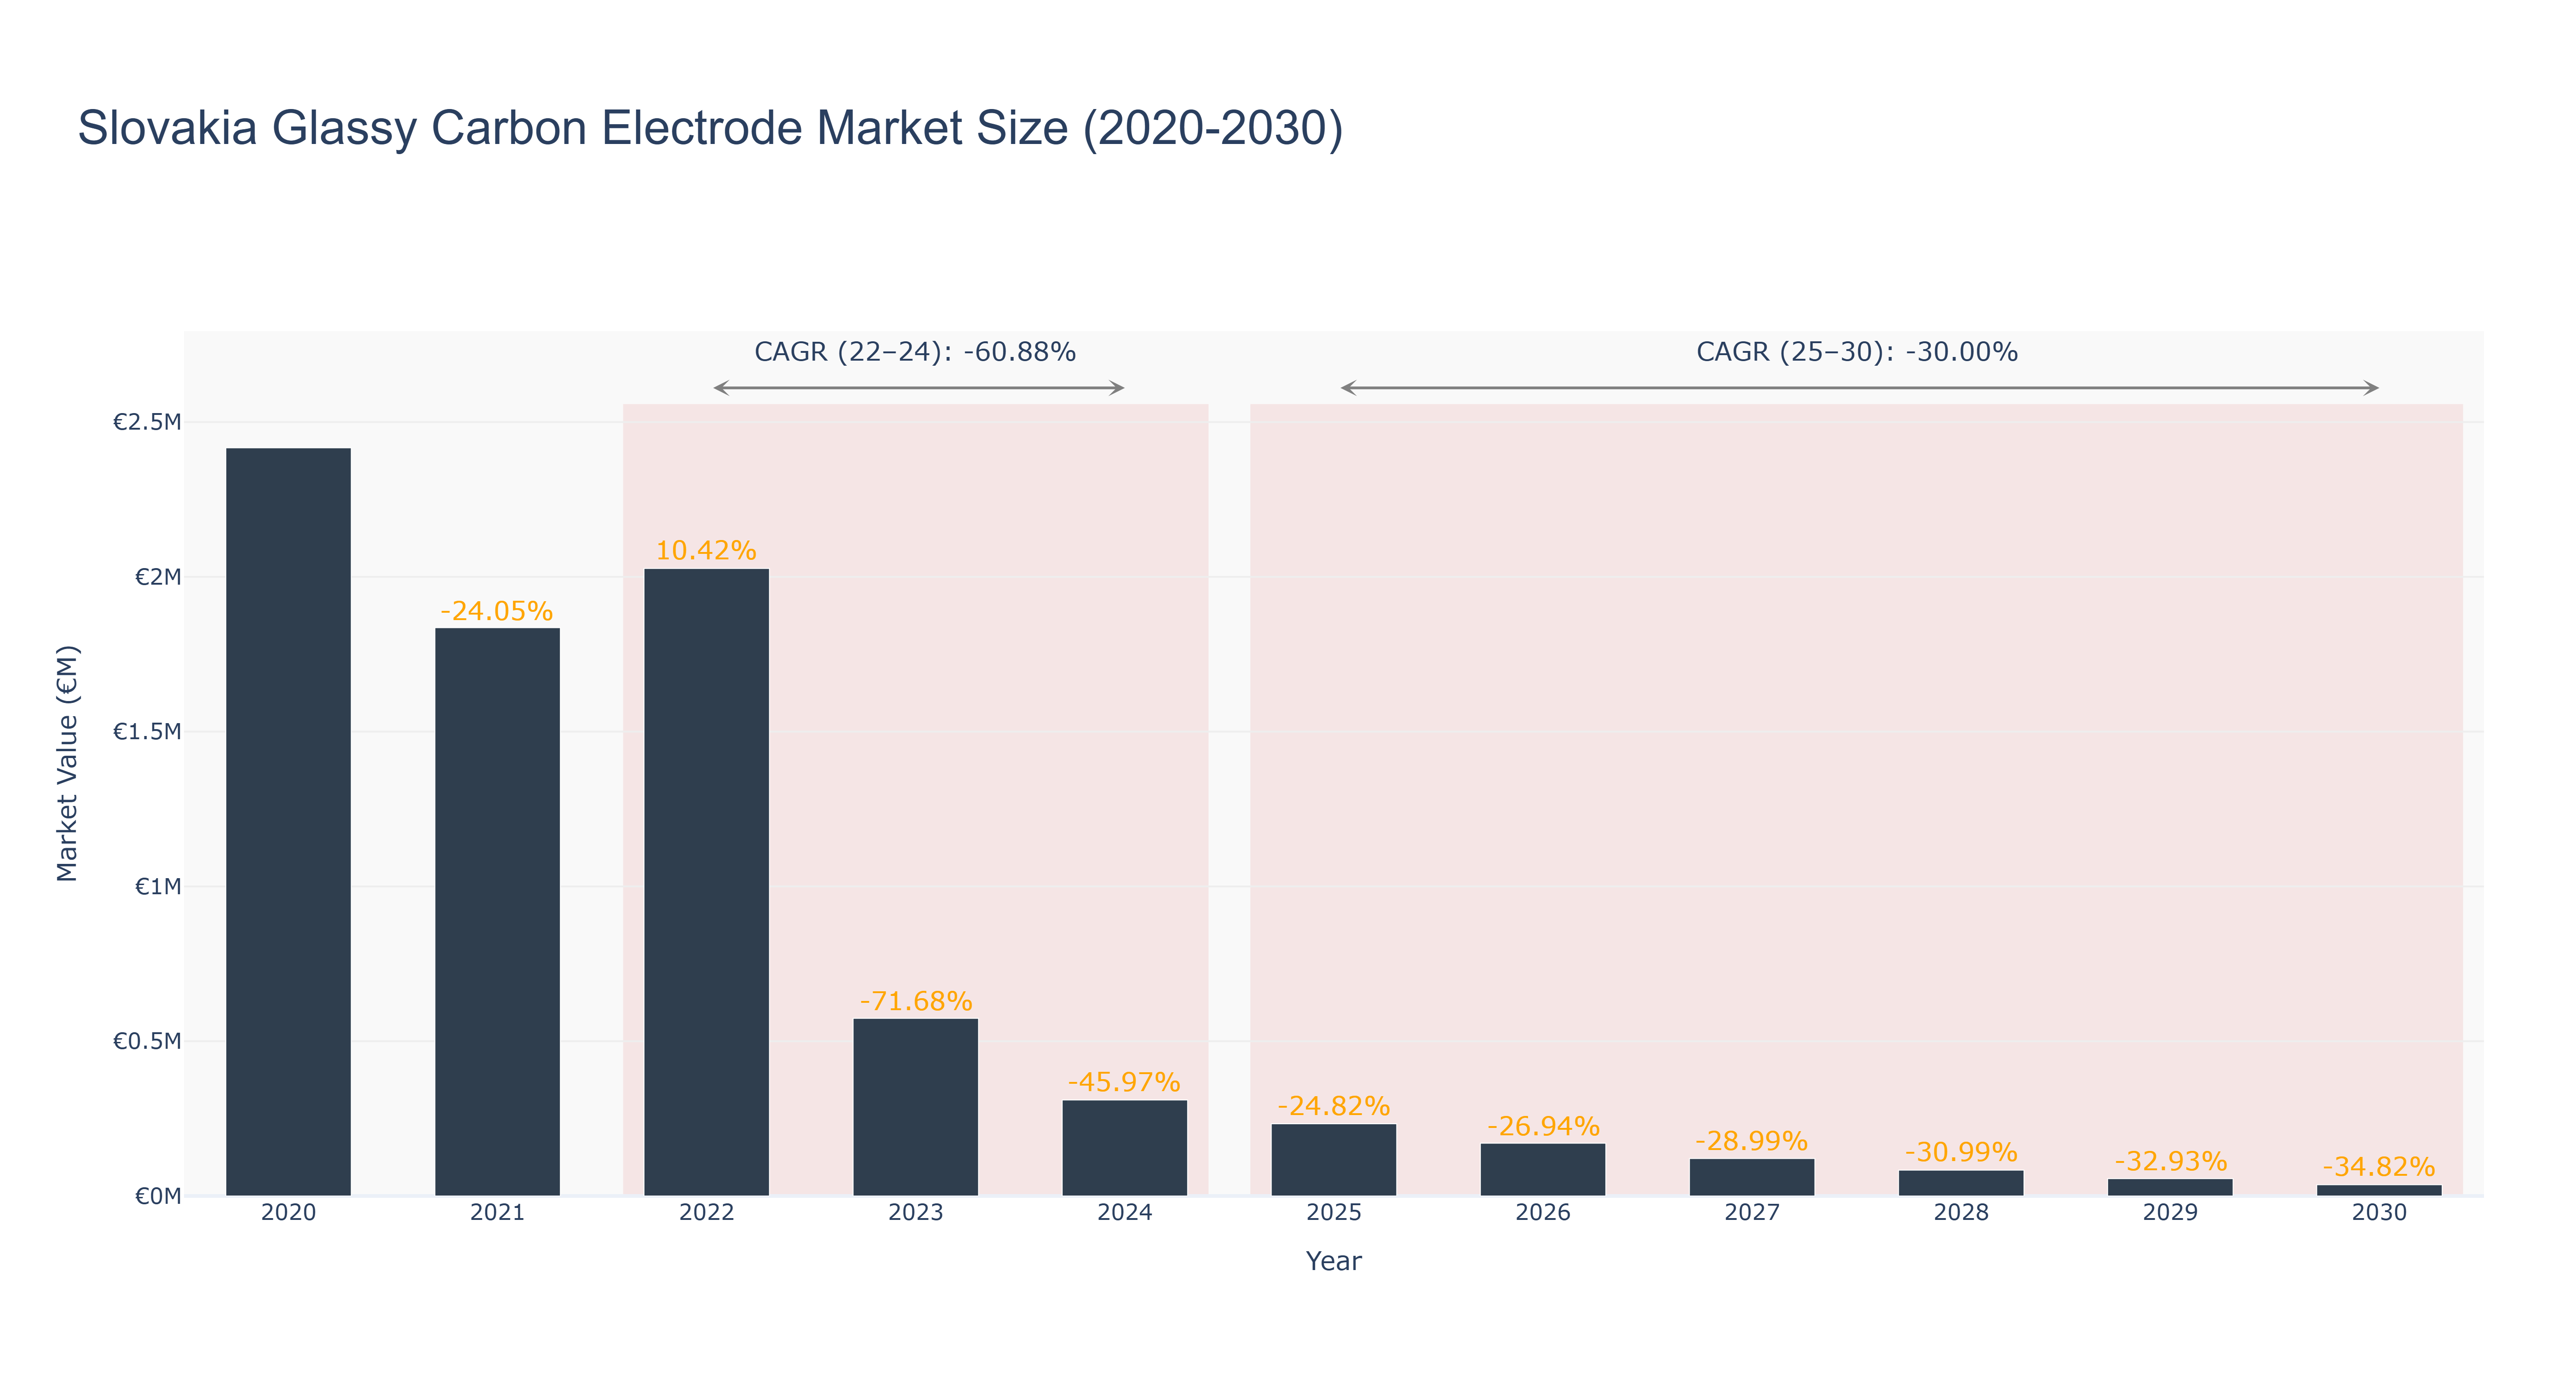
Slovakia Glassy Carbon Electrode Market has experienced a significant decline in market size over the past decade. The peak market size of €2.42 million was recorded in 2020, followed by a sharp decrease to €0.04 million in 2030. The actual market size saw a continuous downward trend from 2020 to 2030, with negative growth rates each year. The CAGR for the period 2022-2024 was -60.88%, reflecting the substantial contraction during those years. The forecasted CAGR for 2025-2030 stands at -30.0%. The decline in market size can be attributed to factors such as technological advancements leading to reduced demand for glassy carbon electrodes and shifting consumer preferences towards alternative materials. Looking ahead, Slovakia is set to invest in sustainable energy projects to boost the market for carbon electrodes, aligning with the country's green energy initiatives.
Slovakia Glassy Carbon Electrode Market: Production & Trade Performance (2019-2025)
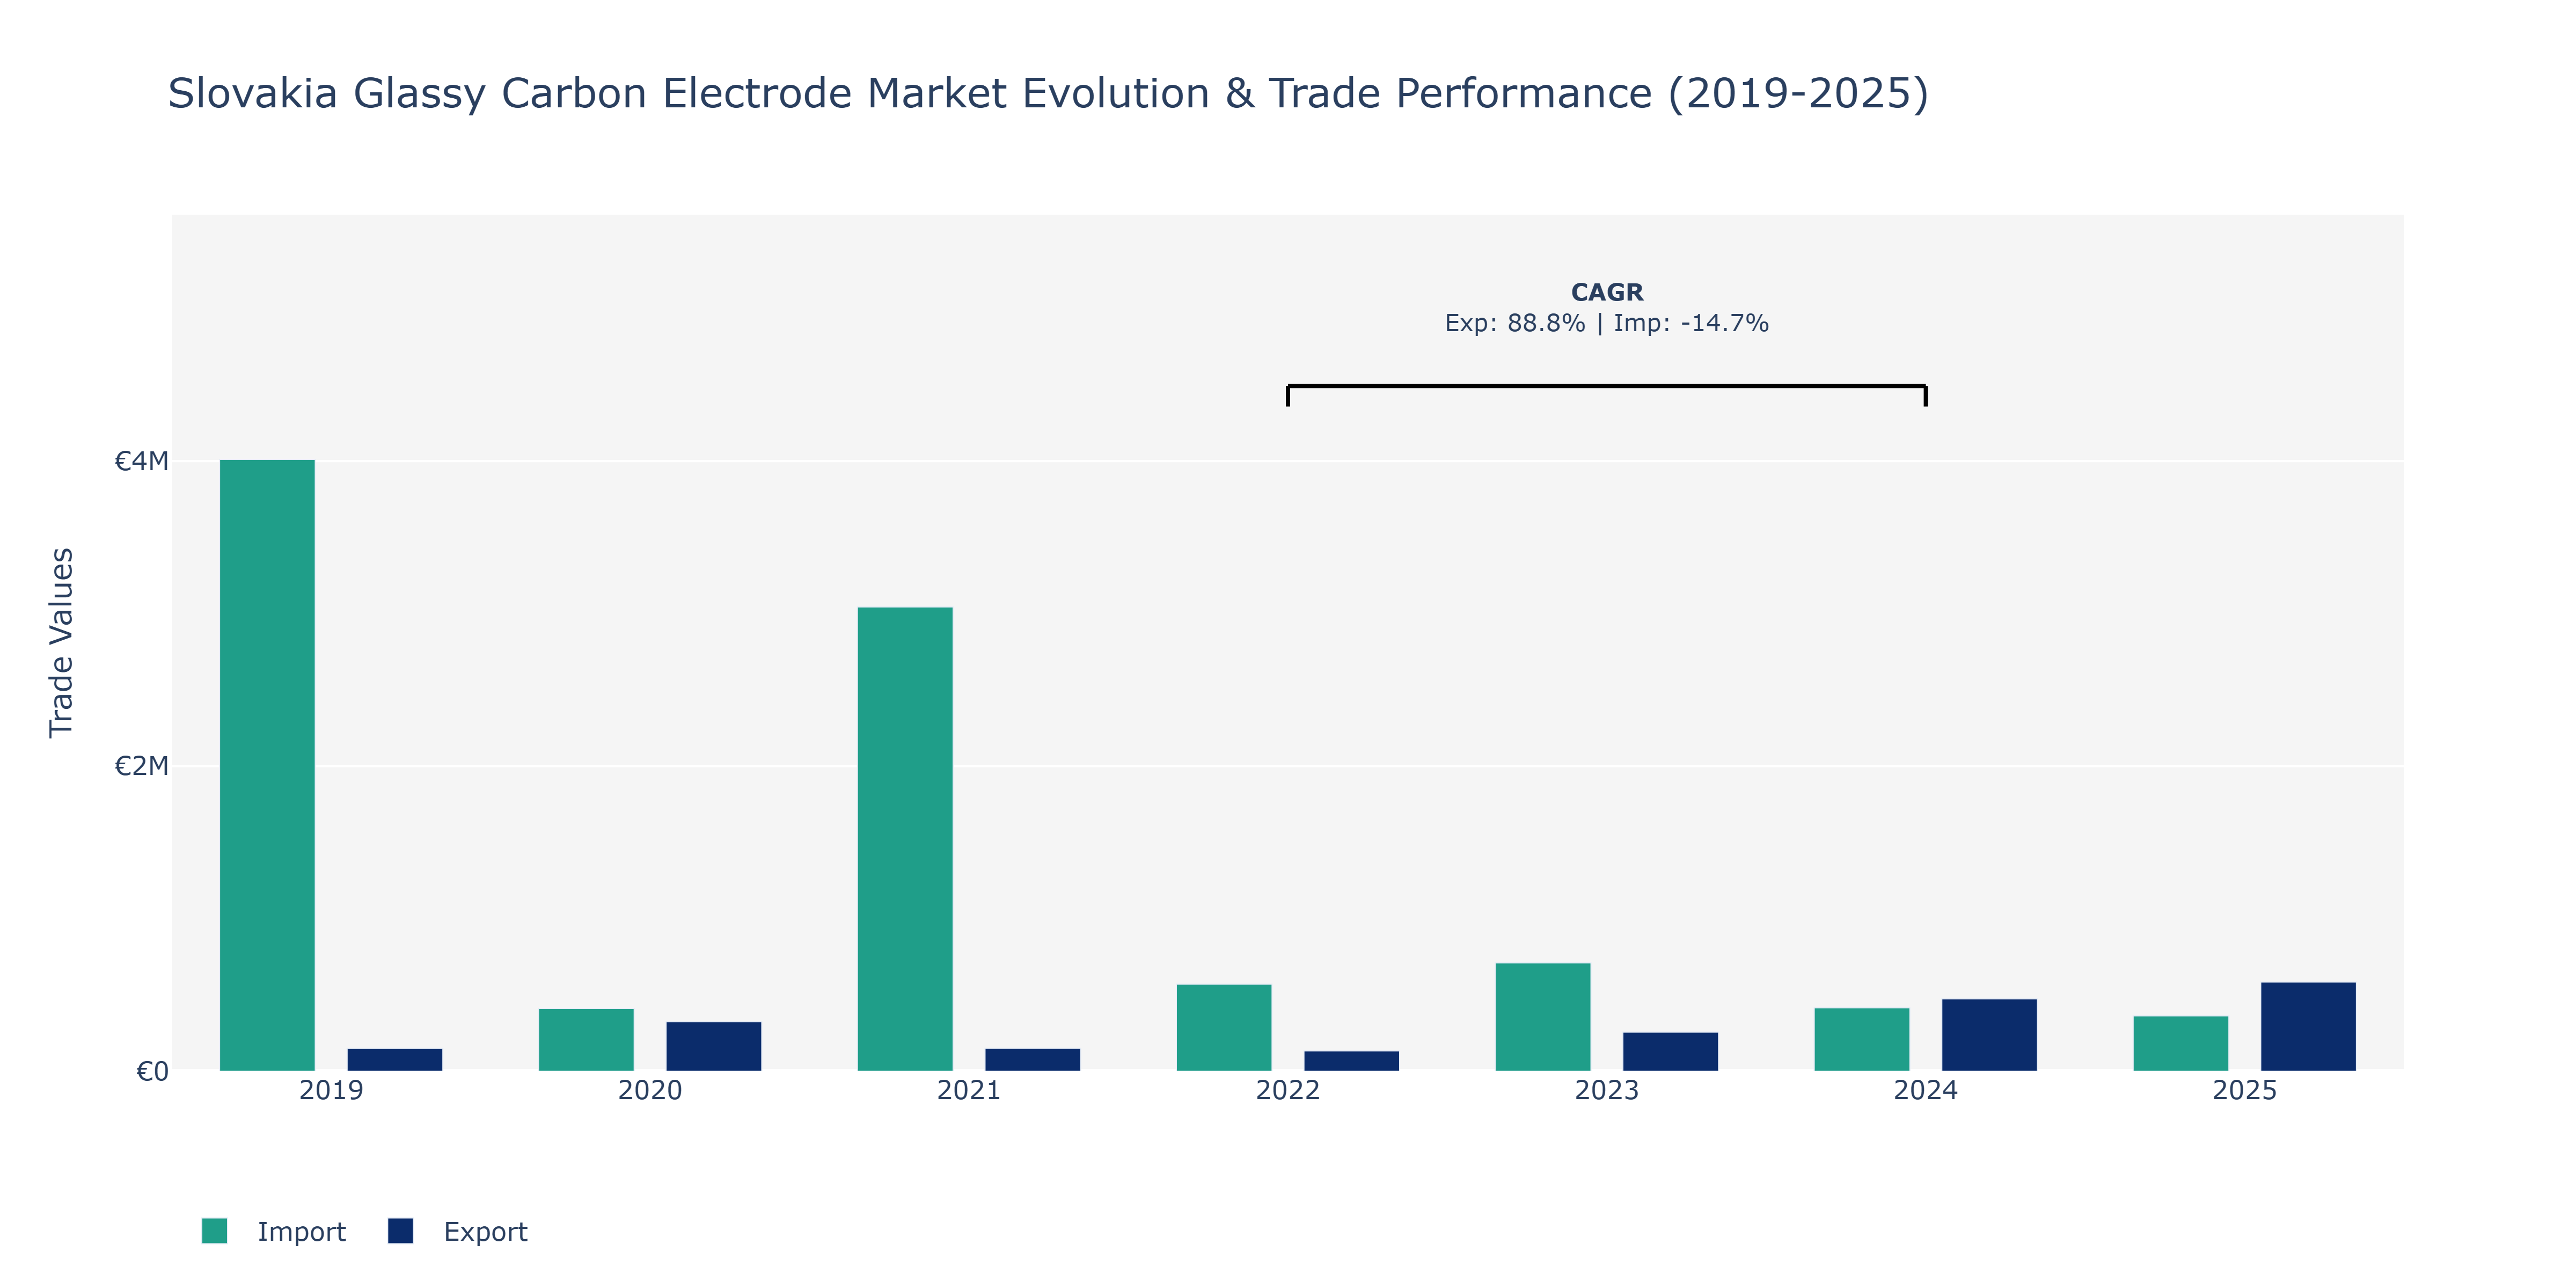
Between 2019 and 2025, the Slovakia Glassy Carbon Electrode Market witnessed fluctuating trends in Exports and Imports. In 2019, Imports dominated at €4.01 million, significantly surpassing Exports at €148.9 thousand. However, in 2020, Exports surged to €324.59 thousand, narrowing the gap with Imports at €411.5 thousand. This reversal continued in 2021, with Exports at €149.72 thousand and Imports at €3.04 million. Notably, 2024 marked a peak for Exports at €474.38 thousand while Imports declined to €415.34 thousand. The year 2025 saw a further increase in Exports to €585.17 thousand, while Imports decreased to €362.33 thousand. These fluctuations could be attributed to various factors, including changes in demand, global economic conditions, and market competitiveness. The rise in Exports could be driven by technological advancements and increased adoption of glassy carbon electrodes in industries like aerospace and electronics, contributing to Slovakia's growing competitiveness in the international market.
Key Highlights of the Report:
- Slovakia Glassy Carbon Electrode Market Outlook
- Market Size of Slovakia Glassy Carbon Electrode Market, 2025
- Forecast of Slovakia Glassy Carbon Electrode Market, 2032
- Historical Data and Forecast of Slovakia Glassy Carbon Electrode Revenues & Volume for the Period 2022 - 2032F
- Slovakia Glassy Carbon Electrode Market Trend Evolution
- Slovakia Glassy Carbon Electrode Market Drivers and Challenges
- Slovakia Glassy Carbon Electrode Price Trends
- Slovakia Glassy Carbon Electrode Porter's Five Forces
- Slovakia Glassy Carbon Electrode Industry Life Cycle
- Historical Data and Forecast of Slovakia Glassy Carbon Electrode Market Revenues & Volume By Size for the Period 2022 - 2032F
- Historical Data and Forecast of Slovakia Glassy Carbon Electrode Market Revenues & Volume By Below 3mm for the Period 2022 - 2032F
- Historical Data and Forecast of Slovakia Glassy Carbon Electrode Market Revenues & Volume By Above 3mm for the Period 2022 - 2032F
- Historical Data and Forecast of Slovakia Glassy Carbon Electrode Market Revenues & Volume By Application for the Period 2022 - 2032F
- Historical Data and Forecast of Slovakia Glassy Carbon Electrode Market Revenues & Volume By Chemically Modified Electrode for the Period 2022 - 2032F
- Historical Data and Forecast of Slovakia Glassy Carbon Electrode Market Revenues & Volume By Anodic Solution for the Period 2022 - 2032F
- Historical Data and Forecast of Slovakia Glassy Carbon Electrode Market Revenues & Volume By Working Electrode for the Period 2022 - 2032F
- Historical Data and Forecast of Slovakia Glassy Carbon Electrode Market Revenues & Volume By Others for the Period 2022 - 2032F
- Slovakia Glassy Carbon Electrode Import Export Trade Statistics
- Market Opportunity Assessment By Size
- Market Opportunity Assessment By Application
- Slovakia Glassy Carbon Electrode Top Companies Market Share
- Slovakia Glassy Carbon Electrode Competitive Benchmarking By Technical and Operational Parameters
- Slovakia Glassy Carbon Electrode Company Profiles
- Slovakia Glassy Carbon Electrode Key Strategic Recommendations
Frequently Asked Questions About the Market Study (FAQs):
6Wresearch actively monitors the Slovakia Glassy Carbon Electrode Market and publishes its comprehensive annual report, highlighting emerging trends, growth drivers, revenue analysis, and forecast outlook. Our insights help businesses to make data-backed strategic decisions with ongoing market dynamics. Our analysts track relevent industries related to the Slovakia Glassy Carbon Electrode Market, allowing our clients with actionable intelligence and reliable forecasts tailored to emerging regional needs.
Yes, we provide customisation as per your requirements. To learn more, feel free to contact us on sales@6wresearch.com
1 Executive Summary |
2 Introduction |
2.1 Key Highlights of the Report |
2.2 Report Description |
2.3 Market Scope & Segmentation |
2.4 Research Methodology |
2.5 Assumptions |
3 Slovakia Glassy Carbon Electrode Market Overview |
3.1 Slovakia Country Macro Economic Indicators |
3.2 Slovakia Glassy Carbon Electrode Market Revenues & Volume, 2022 & 2032F |
3.3 Slovakia Glassy Carbon Electrode Market - Industry Life Cycle |
3.4 Slovakia Glassy Carbon Electrode Market - Porter's Five Forces |
3.5 Slovakia Glassy Carbon Electrode Market Revenues & Volume Share, By Size, 2022 & 2032F |
3.6 Slovakia Glassy Carbon Electrode Market Revenues & Volume Share, By Application, 2022 & 2032F |
4 Slovakia Glassy Carbon Electrode Market Dynamics |
4.1 Impact Analysis |
4.2 Market Drivers |
4.2.1 Increasing demand for glassy carbon electrodes in the electronics industry due to their superior properties such as high thermal stability and chemical resistance |
4.2.2 Growing adoption of glassy carbon electrodes in the healthcare sector for applications like electrochemical sensing and testing |
4.2.3 Technological advancements leading to the development of innovative glassy carbon electrode products |
4.3 Market Restraints |
4.3.1 High initial setup costs associated with manufacturing glassy carbon electrodes may hinder market growth |
4.3.2 Fluctuating prices of raw materials used in glassy carbon electrode production can impact profit margins |
4.3.3 Regulatory challenges and compliance requirements in the manufacturing and usage of glassy carbon electrodes may restrict market expansion |
5 Slovakia Glassy Carbon Electrode Market Trends |
6 Slovakia Glassy Carbon Electrode Market, By Types |
6.1 Slovakia Glassy Carbon Electrode Market, By Size |
6.1.1 Overview and Analysis |
6.1.2 Slovakia Glassy Carbon Electrode Market Revenues & Volume, By Size, 2022 - 2032F |
6.1.3 Slovakia Glassy Carbon Electrode Market Revenues & Volume, By Below 3mm, 2022 - 2032F |
6.1.4 Slovakia Glassy Carbon Electrode Market Revenues & Volume, By Above 3mm, 2022 - 2032F |
6.2 Slovakia Glassy Carbon Electrode Market, By Application |
6.2.1 Overview and Analysis |
6.2.2 Slovakia Glassy Carbon Electrode Market Revenues & Volume, By Chemically Modified Electrode, 2022 - 2032F |
6.2.3 Slovakia Glassy Carbon Electrode Market Revenues & Volume, By Anodic Solution, 2022 - 2032F |
6.2.4 Slovakia Glassy Carbon Electrode Market Revenues & Volume, By Working Electrode, 2022 - 2032F |
6.2.5 Slovakia Glassy Carbon Electrode Market Revenues & Volume, By Others, 2022 - 2032F |
7 Slovakia Glassy Carbon Electrode Market Import-Export Trade Statistics |
7.1 Slovakia Glassy Carbon Electrode Market Export to Major Countries |
7.2 Slovakia Glassy Carbon Electrode Market Imports from Major Countries |
8 Slovakia Glassy Carbon Electrode Market Key Performance Indicators |
8.1 Research and development investment in new glassy carbon electrode technologies |
8.2 Number of patents filed for glassy carbon electrode innovations |
8.3 Adoption rate of glassy carbon electrodes in emerging industries such as renewable energy and biotechnology |
9 Slovakia Glassy Carbon Electrode Market - Opportunity Assessment |
9.1 Slovakia Glassy Carbon Electrode Market Opportunity Assessment, By Size, 2022 & 2032F |
9.2 Slovakia Glassy Carbon Electrode Market Opportunity Assessment, By Application, 2022 & 2032F |
10 Slovakia Glassy Carbon Electrode Market - Competitive Landscape |
10.1 Slovakia Glassy Carbon Electrode Market Revenue Share, By Companies, 2025 |
10.2 Slovakia Glassy Carbon Electrode Market Competitive Benchmarking, By Operating and Technical Parameters |
11 Company Profiles |
12 Recommendations |
13 Disclaimer |
Global Go To Market Strategy - 2030
Export potential enables firms to identify high-growth global markets with greater confidence by combining advanced trade intelligence with a structured quantitative methodology. The framework analyzes emerging demand trends and country-level import patterns while integrating macroeconomic and trade datasets such as GDP and population forecasts, bilateral import–export flows, tariff structures, elasticity differentials between developed and developing economies, geographic distance, and import demand projections. Using weighted trade values from 2020–2024 as the base period to project country-to-country export potential for 2030, these inputs are operationalized through calculated drivers such as gravity model parameters, tariff impact factors, and projected GDP per-capita growth. Through an analysis of hidden potentials, demand hotspots, and market conditions that are most favorable to success, this method enables firms to focus on target countries, maximize returns, and global expansion with data, backed by accuracy.
By factoring in the projected importer demand gap that is currently unmet and could be potential opportunity, it identifies the potential for the Exporter (Country) among 190 countries, against the general trade analysis, which identifies the biggest importer or exporter.
To discover high-growth global markets and optimize your business strategy:
Click Here
Pricing
- Single User License$ 1,995
- Department License$ 2,400
- Site License$ 3,120
- Global License$ 3,795

Leadership Perspectives from Industry Events
Search
Thought Leadership and Analyst Meet


Our Clients
6WResearch In News
- India Air Conditioner Market Set for Strong Rebound in 2026 After Weather-Led Correction and GST-Driven Recovery: 6Wresearch
- ADAS in India: How Automatic Emergency Braking, Blind Spot Detection & Driver Monitoring are Transforming Road Safety
- Doha a strategic location for EV manufacturing hub: IPA Qatar
- Demand for luxury TVs surging in the GCC, says Samsung
- Empowering Growth: The Thriving Journey of Bangladesh’s Cable Industry
- Demand for luxury TVs surging in the GCC, says Samsung
Latest Reports
- Poland Fire Protection Systems Market (2026-2032)
- Cape Verde Portable Hand-Thrown Extinguisher Market (2026-2032)
- Canada Portable Hand-Thrown Extinguisher Market (2026-2032)
- Cameroon Portable Hand-Thrown Extinguisher Market (2026-2032)
- Burundi Portable Hand-Thrown Extinguisher Market (2026-2032)
- Burkina Faso Portable Hand-Thrown Extinguisher Market (2026-2032)
- Bulgaria Portable Hand-Thrown Extinguisher Market (2026-2032)
- Brunei Portable Hand-Thrown Extinguisher Market (2026-2032)
- Botswana Portable Hand-Thrown Extinguisher Market (2026-2032)
- Bosnia and Herzegovina Portable Hand-Thrown Extinguisher Market (2026-2032)
Industry Events and Analyst Meet

HIMTEX 2026

India Refining Summit 2026

India EV Show 2026

EV tech India Expo 2026

Auto Tech Asia 2026
Whitepaper
- Middle East & Africa Commercial Security Market Click here to view more.
- Middle East & Africa Fire Safety Systems & Equipment Market Click here to view more.
- GCC Drone Market Click here to view more.
- Middle East Lighting Fixture Market Click here to view more.
- GCC Physical & Perimeter Security Market Click here to view more.