Slovakia Hypophosphorous Acid Market (2026-2032) | Demand, Strategy, Value, Competitive, Strategic Insights, Industry, Supply, Growth, Share, Analysis, Forecast, Segmentation, Opportunities, Outlook, Consumer Insights, Competition, Segments, Trends, Size, Drivers, Restraints, Pricing Analysis, Investment Trends, Revenue, Companies, Challenges
Market Forecast By Product Type (Industrial Grade, Electronic Grade, Food Grade, Pharmaceutical Grade, Laboratory Grade), By Technology Type (Chemical Reduction, Wet Etching Process, Food Preservative Methods, Purification Techniques, Catalysis Technology), By End User (Chemical Manufacturers, Electronics Industry, Food Industry, Healthcare Sector, Research Institutions), By Application (Pharmaceuticals, Printed Circuit Boards, Antioxidants, Drug Formulation, Analytical Chemistry) And Competitive Landscape
| Product Code: ETC12519464 | Publication Date: Apr 2025 | Updated Date: Apr 2026 | Product Type: Market Research Report | |
| Publisher: 6Wresearch | Author: Sachin Kumar Rai | No. of Pages: 65 | No. of Figures: 34 | No. of Tables: 19 |
Slovakia Hypophosphorous Acid Market Size (2020-2030)
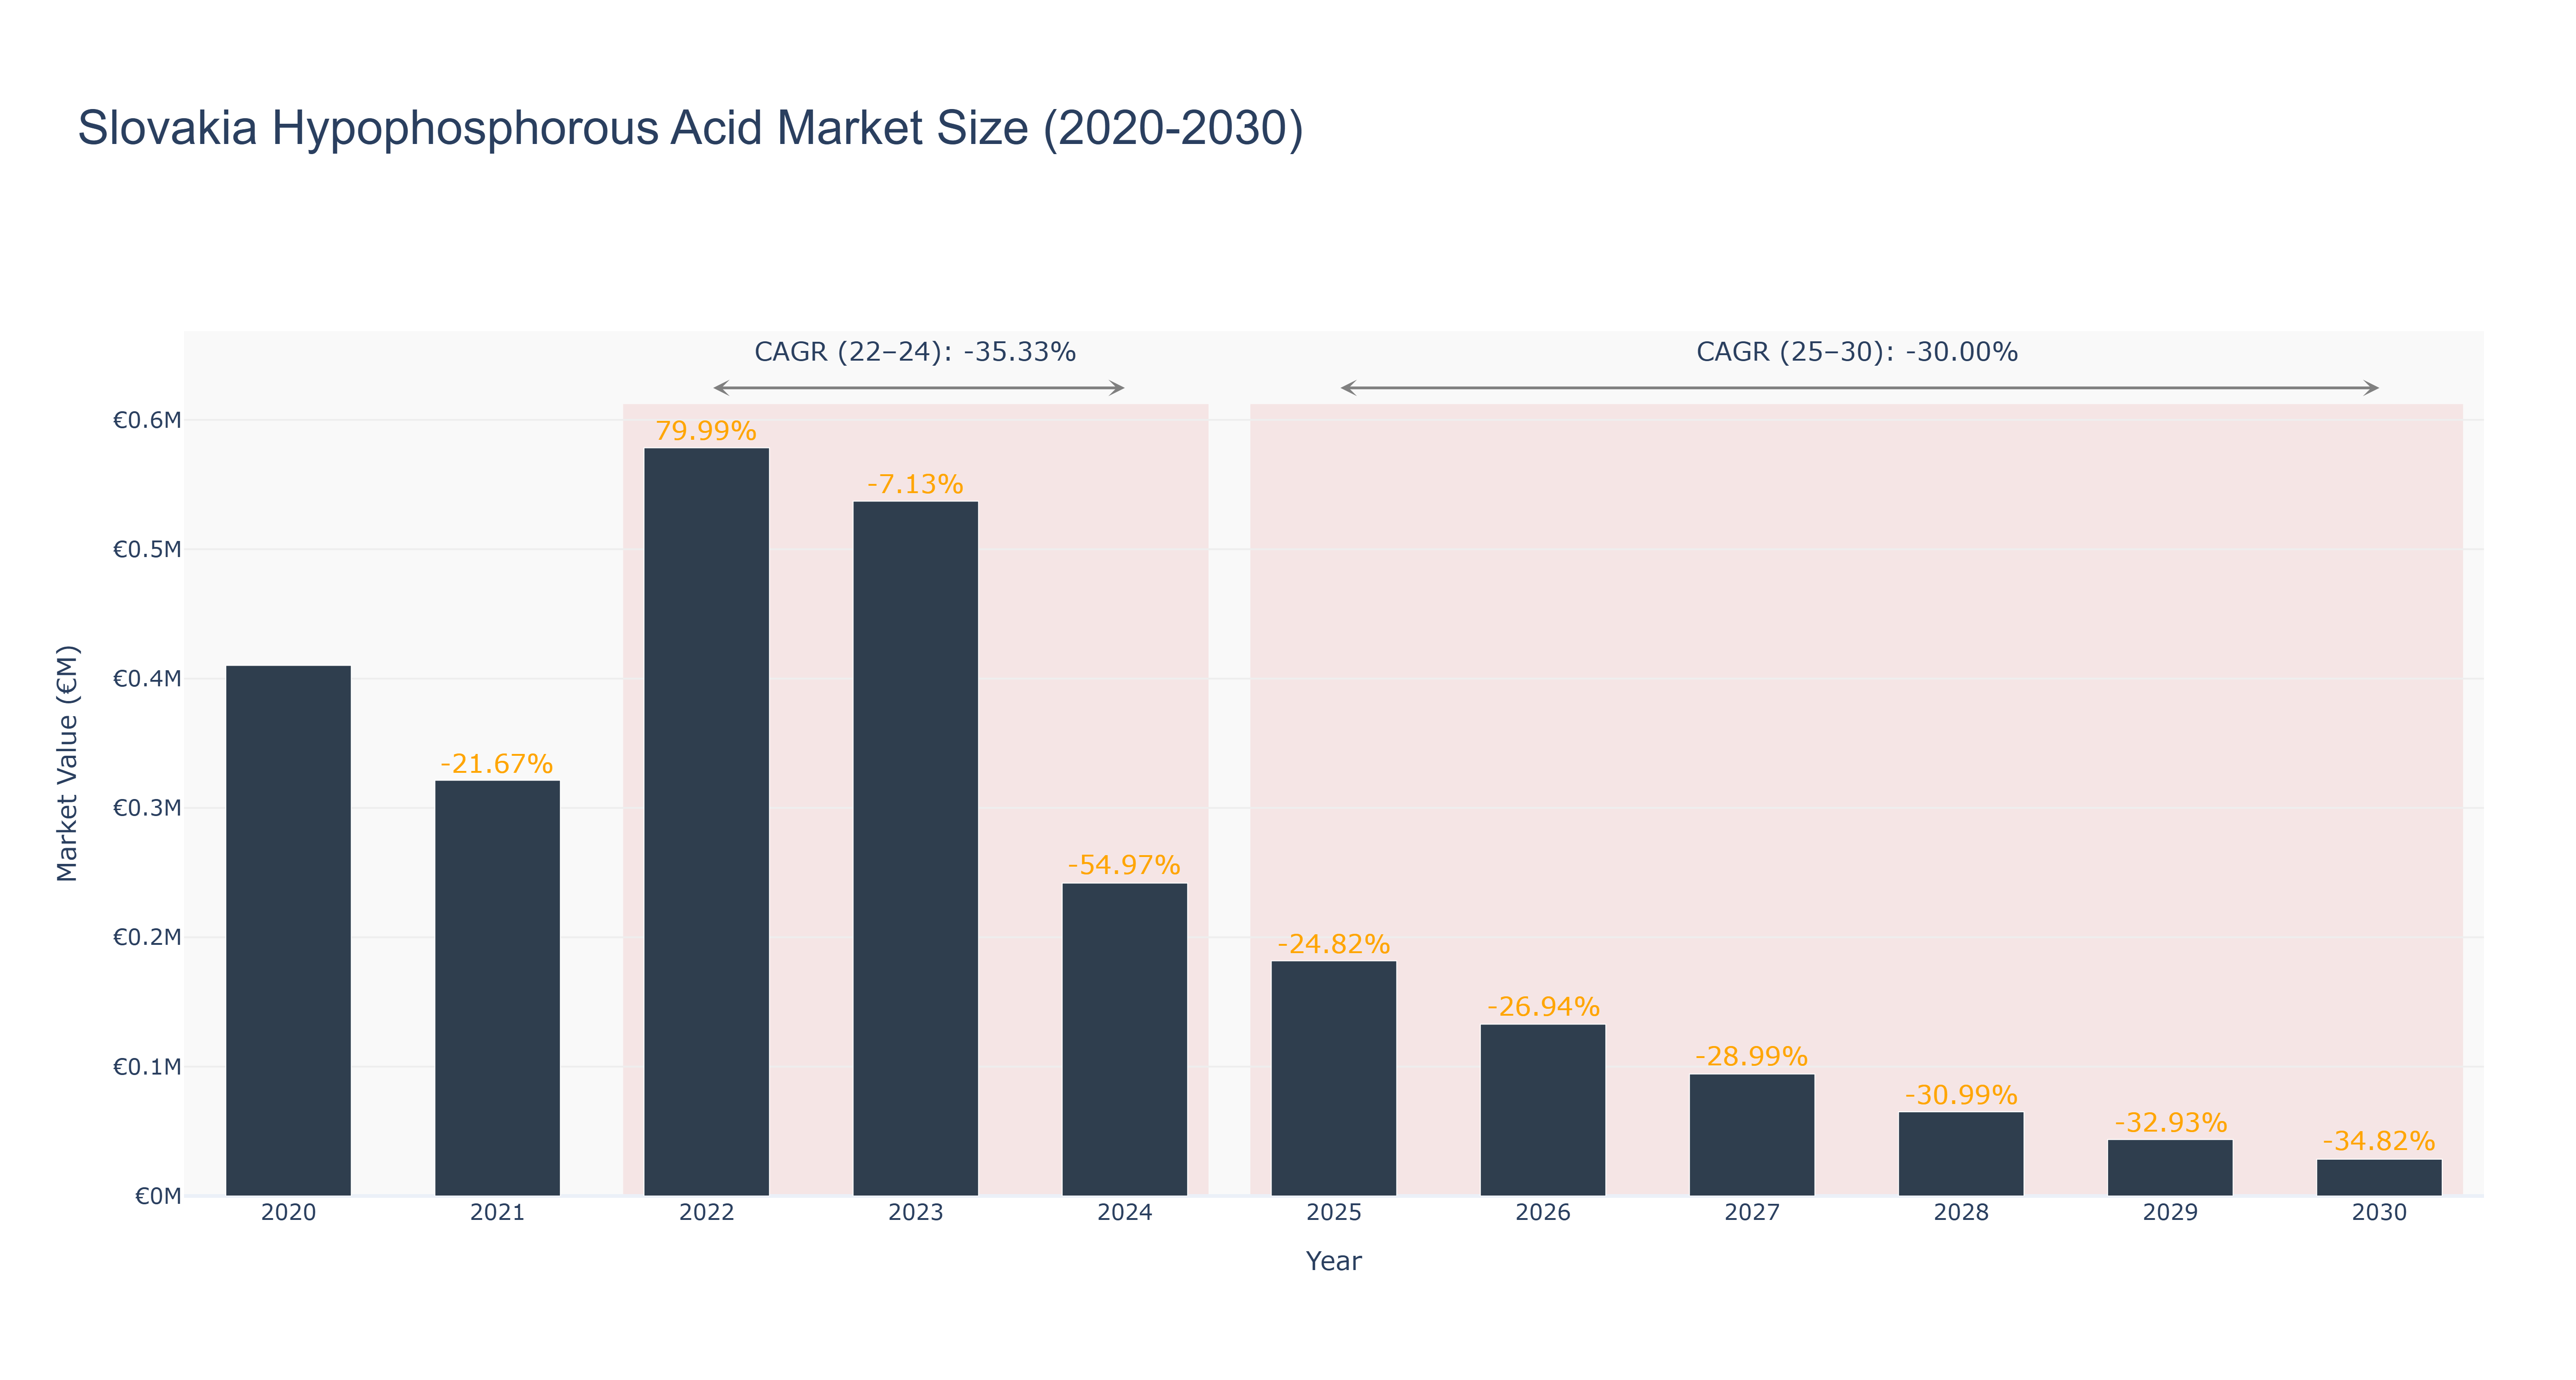
Slovakia's Hypophosphorous Acid Market witnessed a peak market size of €0.58 million in 2022, followed by a sharp decline to €0.24 million in 2024. The market is forecasted to further decrease to €0.03 million by 2030, with a CAGR of -30.0% from 2025 to 2030. The significant downfall in market size post-2022 can be attributed to various factors such as changing consumer preferences, economic downturns, and increased competition. However, recent industry drivers like technological advancements and sustainability initiatives are expected to drive growth in the coming years. Looking ahead, upcoming projects in Slovakia's chemical industry, focusing on innovation and environmental sustainability, are set to positively impact the Hypophosphorous Acid Market, indicating potential opportunities for market recovery and expansion.
Slovakia Hypophosphorous Acid Market: Production & Trade Performance (2019-2025)
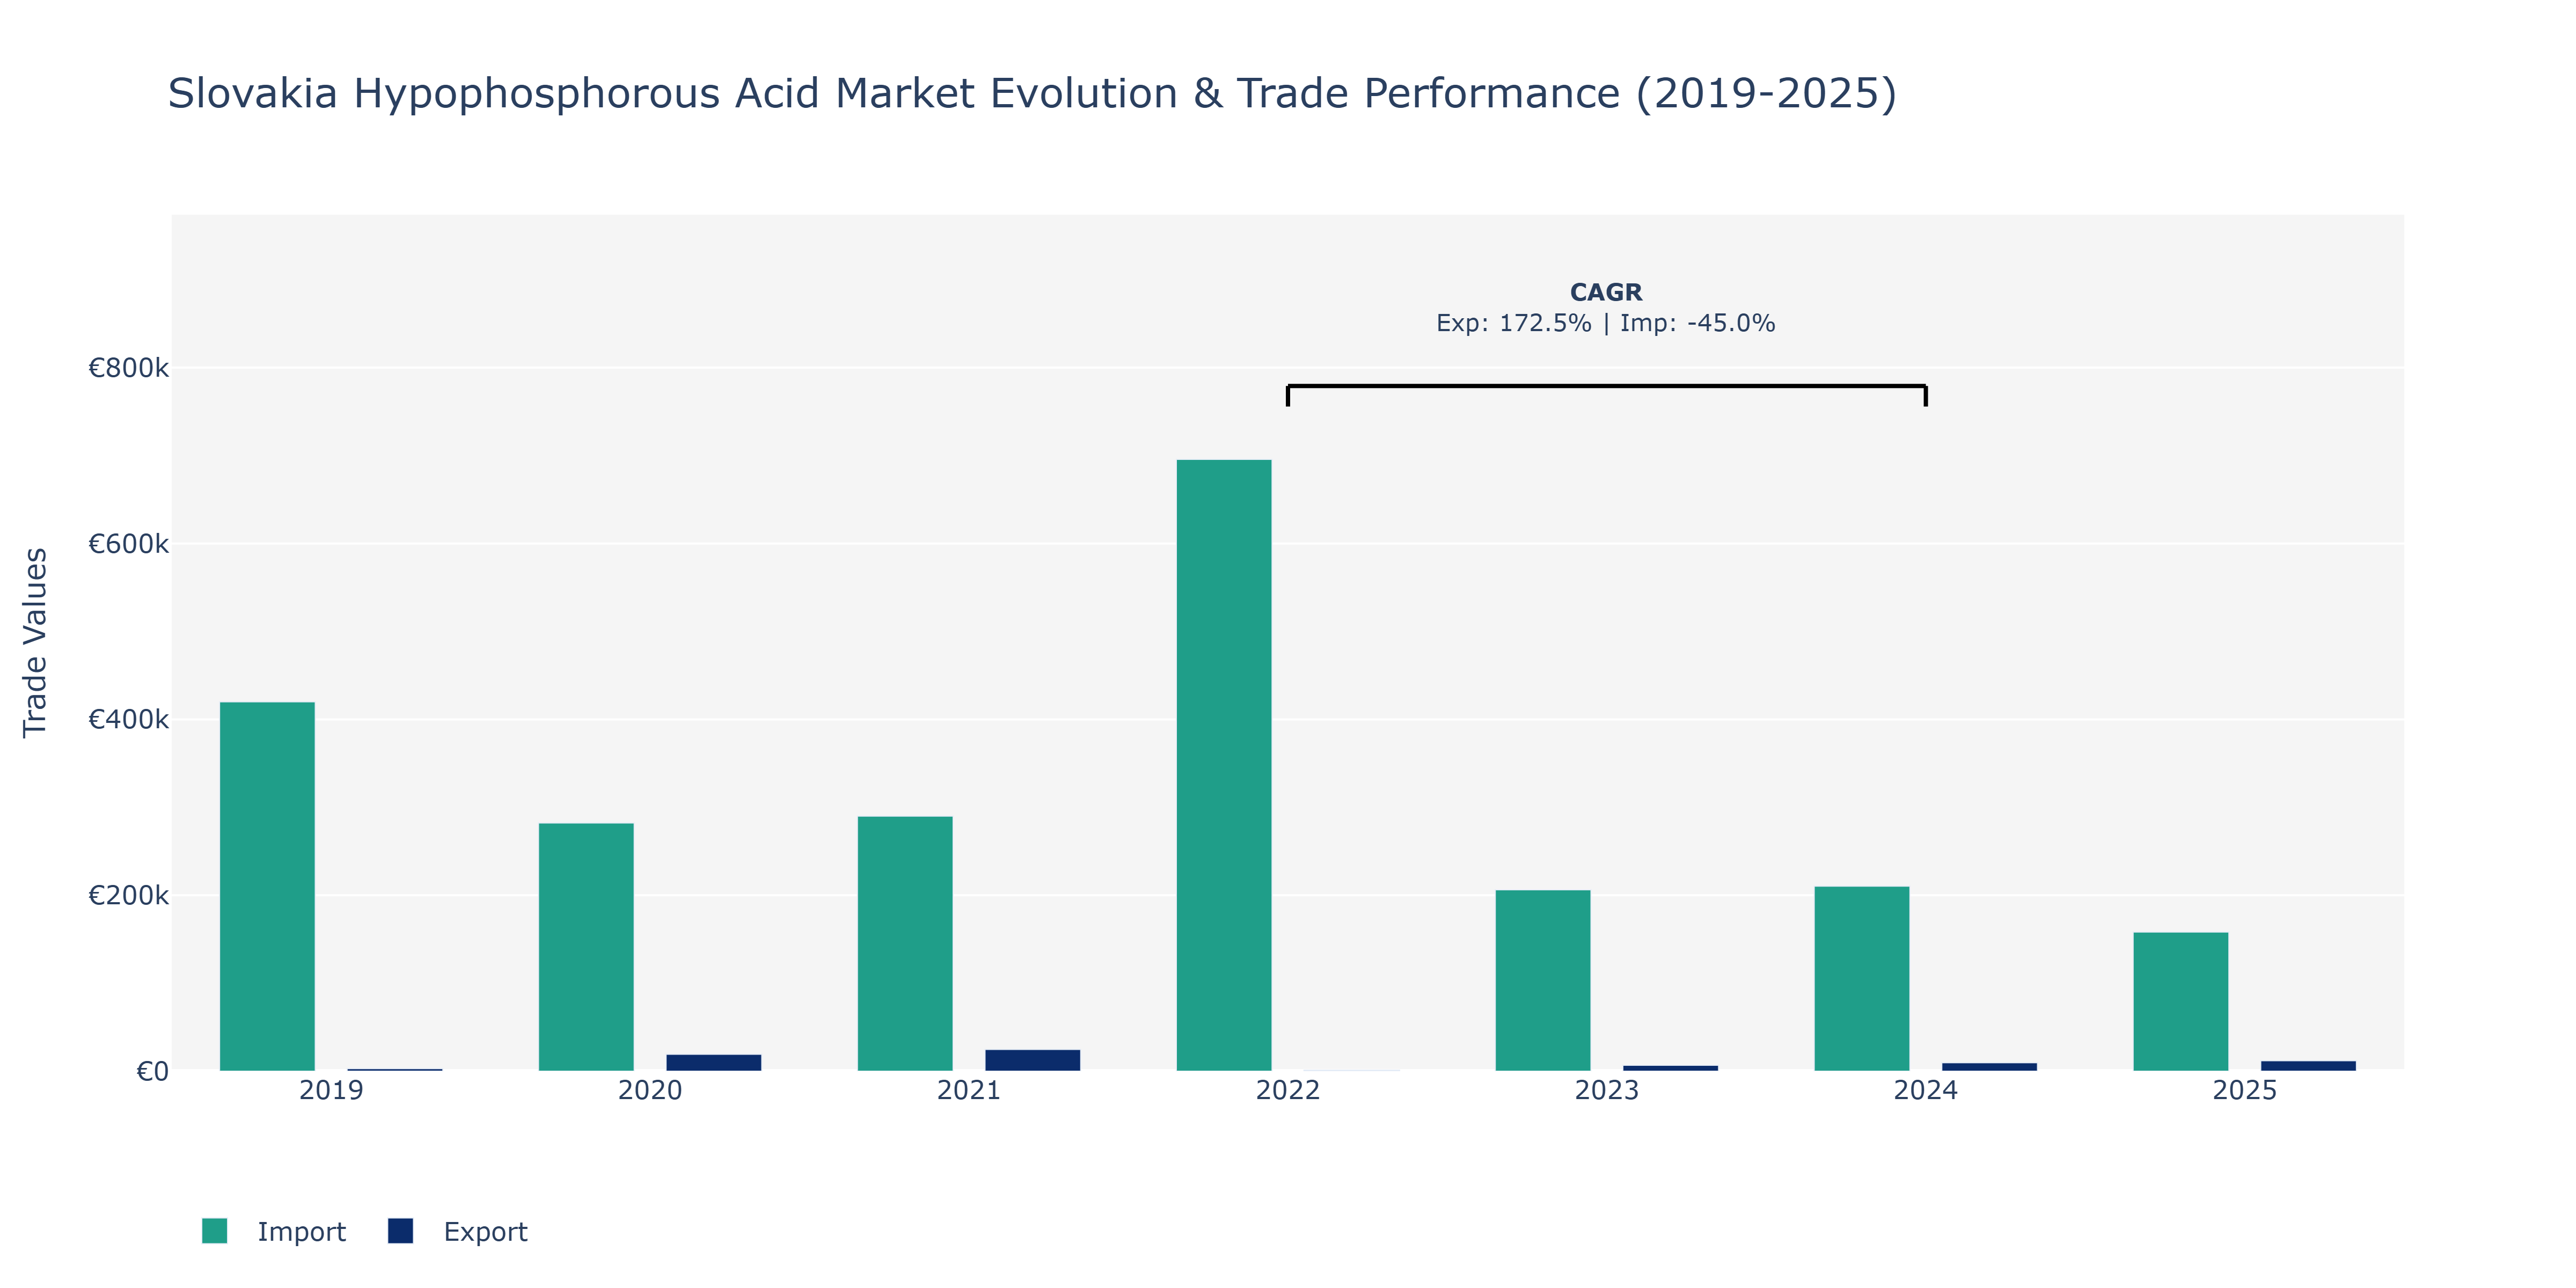
In the Slovakia Hypophosphorous Acid Market, exports experienced notable fluctuations over the years. Beginning at €2.91 thousand in 2019, exports surged to €19.29 thousand in 2020, marking a substantial increase driven by potentially increased demand or production capacity. However, by 2022, exports sharply declined to €1.29 thousand, showcasing a significant contraction that might be attributed to various factors like changes in market dynamics or regulatory impacts. This downward trend reversed in the following years, with exports rebounding to €9.60 thousand in 2024 and further increasing to €11.84 thousand in 2025, indicating a recovery and potential growth trajectory for the market. On the other hand, imports followed a different pattern, reaching €420.02 thousand in 2019, decreasing to €282.2 thousand in 2020, and then slightly rising to €290.06 thousand in 2021. However, imports saw a substantial spike to €695.64 thousand in 2022, followed by a decline to €210.38 thousand in 2024 and a further decrease to €158.16 thousand in 2025. These fluctuations in imports could be due to changes in sourcing strategies, global market conditions, or shifts in domestic demand. The contrasting movements in exports and imports highlight the market's sensitivity to various external factors, necessitating strategic planning and market monitoring to capitalize on emerging opportunities and mitigate risks effectively.
Key Highlights of the Report:
- Slovakia Hypophosphorous Acid Market Outlook
- Market Size of Slovakia Hypophosphorous Acid Market, 2025
- Forecast of Slovakia Hypophosphorous Acid Market, 2032
- Historical Data and Forecast of Slovakia Hypophosphorous Acid Revenues & Volume for the Period 2022 - 2032F
- Slovakia Hypophosphorous Acid Market Trend Evolution
- Slovakia Hypophosphorous Acid Market Drivers and Challenges
- Slovakia Hypophosphorous Acid Price Trends
- Slovakia Hypophosphorous Acid Porter's Five Forces
- Slovakia Hypophosphorous Acid Industry Life Cycle
- Historical Data and Forecast of Slovakia Hypophosphorous Acid Market Revenues & Volume By Product Type for the Period 2022 - 2032F
- Historical Data and Forecast of Slovakia Hypophosphorous Acid Market Revenues & Volume By Industrial Grade for the Period 2022 - 2032F
- Historical Data and Forecast of Slovakia Hypophosphorous Acid Market Revenues & Volume By Electronic Grade for the Period 2022 - 2032F
- Historical Data and Forecast of Slovakia Hypophosphorous Acid Market Revenues & Volume By Food Grade for the Period 2022 - 2032F
- Historical Data and Forecast of Slovakia Hypophosphorous Acid Market Revenues & Volume By Pharmaceutical Grade for the Period 2022 - 2032F
- Historical Data and Forecast of Slovakia Hypophosphorous Acid Market Revenues & Volume By Laboratory Grade for the Period 2022 - 2032F
- Historical Data and Forecast of Slovakia Hypophosphorous Acid Market Revenues & Volume By Technology Type for the Period 2022 - 2032F
- Historical Data and Forecast of Slovakia Hypophosphorous Acid Market Revenues & Volume By Chemical Reduction for the Period 2022 - 2032F
- Historical Data and Forecast of Slovakia Hypophosphorous Acid Market Revenues & Volume By Wet Etching Process for the Period 2022 - 2032F
- Historical Data and Forecast of Slovakia Hypophosphorous Acid Market Revenues & Volume By Food Preservative Methods for the Period 2022 - 2032F
- Historical Data and Forecast of Slovakia Hypophosphorous Acid Market Revenues & Volume By Purification Techniques for the Period 2022 - 2032F
- Historical Data and Forecast of Slovakia Hypophosphorous Acid Market Revenues & Volume By Catalysis Technology for the Period 2022 - 2032F
- Historical Data and Forecast of Slovakia Hypophosphorous Acid Market Revenues & Volume By End User for the Period 2022 - 2032F
- Historical Data and Forecast of Slovakia Hypophosphorous Acid Market Revenues & Volume By Chemical Manufacturers for the Period 2022 - 2032F
- Historical Data and Forecast of Slovakia Hypophosphorous Acid Market Revenues & Volume By Electronics Industry for the Period 2022 - 2032F
- Historical Data and Forecast of Slovakia Hypophosphorous Acid Market Revenues & Volume By Food Industry for the Period 2022 - 2032F
- Historical Data and Forecast of Slovakia Hypophosphorous Acid Market Revenues & Volume By Healthcare Sector for the Period 2022 - 2032F
- Historical Data and Forecast of Slovakia Hypophosphorous Acid Market Revenues & Volume By Research Institutions for the Period 2022 - 2032F
- Historical Data and Forecast of Slovakia Hypophosphorous Acid Market Revenues & Volume By Application for the Period 2022 - 2032F
- Historical Data and Forecast of Slovakia Hypophosphorous Acid Market Revenues & Volume By Pharmaceuticals for the Period 2022 - 2032F
- Historical Data and Forecast of Slovakia Hypophosphorous Acid Market Revenues & Volume By Printed Circuit Boards for the Period 2022 - 2032F
- Historical Data and Forecast of Slovakia Hypophosphorous Acid Market Revenues & Volume By Antioxidants for the Period 2022 - 2032F
- Historical Data and Forecast of Slovakia Hypophosphorous Acid Market Revenues & Volume By Drug Formulation for the Period 2022 - 2032F
- Historical Data and Forecast of Slovakia Hypophosphorous Acid Market Revenues & Volume By Analytical Chemistry for the Period 2022 - 2032F
- Slovakia Hypophosphorous Acid Import Export Trade Statistics
- Market Opportunity Assessment By Product Type
- Market Opportunity Assessment By Technology Type
- Market Opportunity Assessment By End User
- Market Opportunity Assessment By Application
- Slovakia Hypophosphorous Acid Top Companies Market Share
- Slovakia Hypophosphorous Acid Competitive Benchmarking By Technical and Operational Parameters
- Slovakia Hypophosphorous Acid Company Profiles
- Slovakia Hypophosphorous Acid Key Strategic Recommendations
Frequently Asked Questions About the Market Study (FAQs):
6Wresearch actively monitors the Slovakia Hypophosphorous Acid Market and publishes its comprehensive annual report, highlighting emerging trends, growth drivers, revenue analysis, and forecast outlook. Our insights help businesses to make data-backed strategic decisions with ongoing market dynamics. Our analysts track relevent industries related to the Slovakia Hypophosphorous Acid Market, allowing our clients with actionable intelligence and reliable forecasts tailored to emerging regional needs.
Yes, we provide customisation as per your requirements. To learn more, feel free to contact us on sales@6wresearch.com
1 Executive Summary |
2 Introduction |
2.1 Key Highlights of the Report |
2.2 Report Description |
2.3 Market Scope & Segmentation |
2.4 Research Methodology |
2.5 Assumptions |
3 Slovakia Hypophosphorous Acid Market Overview |
3.1 Slovakia Country Macro Economic Indicators |
3.2 Slovakia Hypophosphorous Acid Market Revenues & Volume, 2022 & 2032F |
3.3 Slovakia Hypophosphorous Acid Market - Industry Life Cycle |
3.4 Slovakia Hypophosphorous Acid Market - Porter's Five Forces |
3.5 Slovakia Hypophosphorous Acid Market Revenues & Volume Share, By Product Type, 2022 & 2032F |
3.6 Slovakia Hypophosphorous Acid Market Revenues & Volume Share, By Technology Type, 2022 & 2032F |
3.7 Slovakia Hypophosphorous Acid Market Revenues & Volume Share, By End User, 2022 & 2032F |
3.8 Slovakia Hypophosphorous Acid Market Revenues & Volume Share, By Application, 2022 & 2032F |
4 Slovakia Hypophosphorous Acid Market Dynamics |
4.1 Impact Analysis |
4.2 Market Drivers |
4.3 Market Restraints |
5 Slovakia Hypophosphorous Acid Market Trends |
6 Slovakia Hypophosphorous Acid Market, By Types |
6.1 Slovakia Hypophosphorous Acid Market, By Product Type |
6.1.1 Overview and Analysis |
6.1.2 Slovakia Hypophosphorous Acid Market Revenues & Volume, By Product Type, 2022 - 2032F |
6.1.3 Slovakia Hypophosphorous Acid Market Revenues & Volume, By Industrial Grade, 2022 - 2032F |
6.1.4 Slovakia Hypophosphorous Acid Market Revenues & Volume, By Electronic Grade, 2022 - 2032F |
6.1.5 Slovakia Hypophosphorous Acid Market Revenues & Volume, By Food Grade, 2022 - 2032F |
6.1.6 Slovakia Hypophosphorous Acid Market Revenues & Volume, By Pharmaceutical Grade, 2022 - 2032F |
6.1.7 Slovakia Hypophosphorous Acid Market Revenues & Volume, By Laboratory Grade, 2022 - 2032F |
6.2 Slovakia Hypophosphorous Acid Market, By Technology Type |
6.2.1 Overview and Analysis |
6.2.2 Slovakia Hypophosphorous Acid Market Revenues & Volume, By Chemical Reduction, 2022 - 2032F |
6.2.3 Slovakia Hypophosphorous Acid Market Revenues & Volume, By Wet Etching Process, 2022 - 2032F |
6.2.4 Slovakia Hypophosphorous Acid Market Revenues & Volume, By Food Preservative Methods, 2022 - 2032F |
6.2.5 Slovakia Hypophosphorous Acid Market Revenues & Volume, By Purification Techniques, 2022 - 2032F |
6.2.6 Slovakia Hypophosphorous Acid Market Revenues & Volume, By Catalysis Technology, 2022 - 2032F |
6.3 Slovakia Hypophosphorous Acid Market, By End User |
6.3.1 Overview and Analysis |
6.3.2 Slovakia Hypophosphorous Acid Market Revenues & Volume, By Chemical Manufacturers, 2022 - 2032F |
6.3.3 Slovakia Hypophosphorous Acid Market Revenues & Volume, By Electronics Industry, 2022 - 2032F |
6.3.4 Slovakia Hypophosphorous Acid Market Revenues & Volume, By Food Industry, 2022 - 2032F |
6.3.5 Slovakia Hypophosphorous Acid Market Revenues & Volume, By Healthcare Sector, 2022 - 2032F |
6.3.6 Slovakia Hypophosphorous Acid Market Revenues & Volume, By Research Institutions, 2022 - 2032F |
6.4 Slovakia Hypophosphorous Acid Market, By Application |
6.4.1 Overview and Analysis |
6.4.2 Slovakia Hypophosphorous Acid Market Revenues & Volume, By Pharmaceuticals, 2022 - 2032F |
6.4.3 Slovakia Hypophosphorous Acid Market Revenues & Volume, By Printed Circuit Boards, 2022 - 2032F |
6.4.4 Slovakia Hypophosphorous Acid Market Revenues & Volume, By Antioxidants, 2022 - 2032F |
6.4.5 Slovakia Hypophosphorous Acid Market Revenues & Volume, By Drug Formulation, 2022 - 2032F |
6.4.6 Slovakia Hypophosphorous Acid Market Revenues & Volume, By Analytical Chemistry, 2022 - 2032F |
7 Slovakia Hypophosphorous Acid Market Import-Export Trade Statistics |
7.1 Slovakia Hypophosphorous Acid Market Export to Major Countries |
7.2 Slovakia Hypophosphorous Acid Market Imports from Major Countries |
8 Slovakia Hypophosphorous Acid Market Key Performance Indicators |
9 Slovakia Hypophosphorous Acid Market - Opportunity Assessment |
9.1 Slovakia Hypophosphorous Acid Market Opportunity Assessment, By Product Type, 2022 & 2032F |
9.2 Slovakia Hypophosphorous Acid Market Opportunity Assessment, By Technology Type, 2022 & 2032F |
9.3 Slovakia Hypophosphorous Acid Market Opportunity Assessment, By End User, 2022 & 2032F |
9.4 Slovakia Hypophosphorous Acid Market Opportunity Assessment, By Application, 2022 & 2032F |
10 Slovakia Hypophosphorous Acid Market - Competitive Landscape |
10.1 Slovakia Hypophosphorous Acid Market Revenue Share, By Companies, 2025 |
10.2 Slovakia Hypophosphorous Acid Market Competitive Benchmarking, By Operating and Technical Parameters |
11 Company Profiles |
12 Recommendations |
13 Disclaimer |
Global Go To Market Strategy - 2030
Export potential enables firms to identify high-growth global markets with greater confidence by combining advanced trade intelligence with a structured quantitative methodology. The framework analyzes emerging demand trends and country-level import patterns while integrating macroeconomic and trade datasets such as GDP and population forecasts, bilateral import–export flows, tariff structures, elasticity differentials between developed and developing economies, geographic distance, and import demand projections. Using weighted trade values from 2020–2024 as the base period to project country-to-country export potential for 2030, these inputs are operationalized through calculated drivers such as gravity model parameters, tariff impact factors, and projected GDP per-capita growth. Through an analysis of hidden potentials, demand hotspots, and market conditions that are most favorable to success, this method enables firms to focus on target countries, maximize returns, and global expansion with data, backed by accuracy.
By factoring in the projected importer demand gap that is currently unmet and could be potential opportunity, it identifies the potential for the Exporter (Country) among 190 countries, against the general trade analysis, which identifies the biggest importer or exporter.
To discover high-growth global markets and optimize your business strategy:
Click Here
Pricing
- Single User License$ 1,995
- Department License$ 2,400
- Site License$ 3,120
- Global License$ 3,795

Leadership Perspectives from Industry Events
Search
Thought Leadership and Analyst Meet


Our Clients
6WResearch In News
- ADAS in India: How Automatic Emergency Braking, Blind Spot Detection & Driver Monitoring are Transforming Road Safety
- Doha a strategic location for EV manufacturing hub: IPA Qatar
- Demand for luxury TVs surging in the GCC, says Samsung
- Empowering Growth: The Thriving Journey of Bangladesh’s Cable Industry
- Demand for luxury TVs surging in the GCC, says Samsung
- Video call with a traditional healer? Once unthinkable, it’s now common in South Africa
Latest Reports
- Poland Fire Protection Systems Market (2026-2032)
- Cape Verde Portable Hand-Thrown Extinguisher Market (2026-2032)
- Canada Portable Hand-Thrown Extinguisher Market (2026-2032)
- Cameroon Portable Hand-Thrown Extinguisher Market (2026-2032)
- Burundi Portable Hand-Thrown Extinguisher Market (2026-2032)
- Burkina Faso Portable Hand-Thrown Extinguisher Market (2026-2032)
- Bulgaria Portable Hand-Thrown Extinguisher Market (2026-2032)
- Brunei Portable Hand-Thrown Extinguisher Market (2026-2032)
- Botswana Portable Hand-Thrown Extinguisher Market (2026-2032)
- Bosnia and Herzegovina Portable Hand-Thrown Extinguisher Market (2026-2032)
Industry Events and Analyst Meet

HIMTEX 2026

India Refining Summit 2026

India EV Show 2026

EV tech India Expo 2026

Auto Tech Asia 2026
Whitepaper
- Middle East & Africa Commercial Security Market Click here to view more.
- Middle East & Africa Fire Safety Systems & Equipment Market Click here to view more.
- GCC Drone Market Click here to view more.
- Middle East Lighting Fixture Market Click here to view more.
- GCC Physical & Perimeter Security Market Click here to view more.