Slovakia Power Cable Market Outlook | COVID-19 IMPACT, Size, Analysis, Share, Forecast, Companies, Growth, Revenue, Value, Industry & Trends
Market Forecast By Installation Type (Overhead, Underground, Submarine), By Voltage (Low, Medium, High), By End Use (Residential, Commercial, Industrial, Utilities) And Competitive Landscape
| Product Code: ETC239360 | Publication Date: Aug 2022 | Updated Date: Nov 2025 | Product Type: Market Research Report | |
| Publisher: 6Wresearch | Author: Ravi Bhandari | No. of Pages: 75 | No. of Figures: 35 | No. of Tables: 20 |
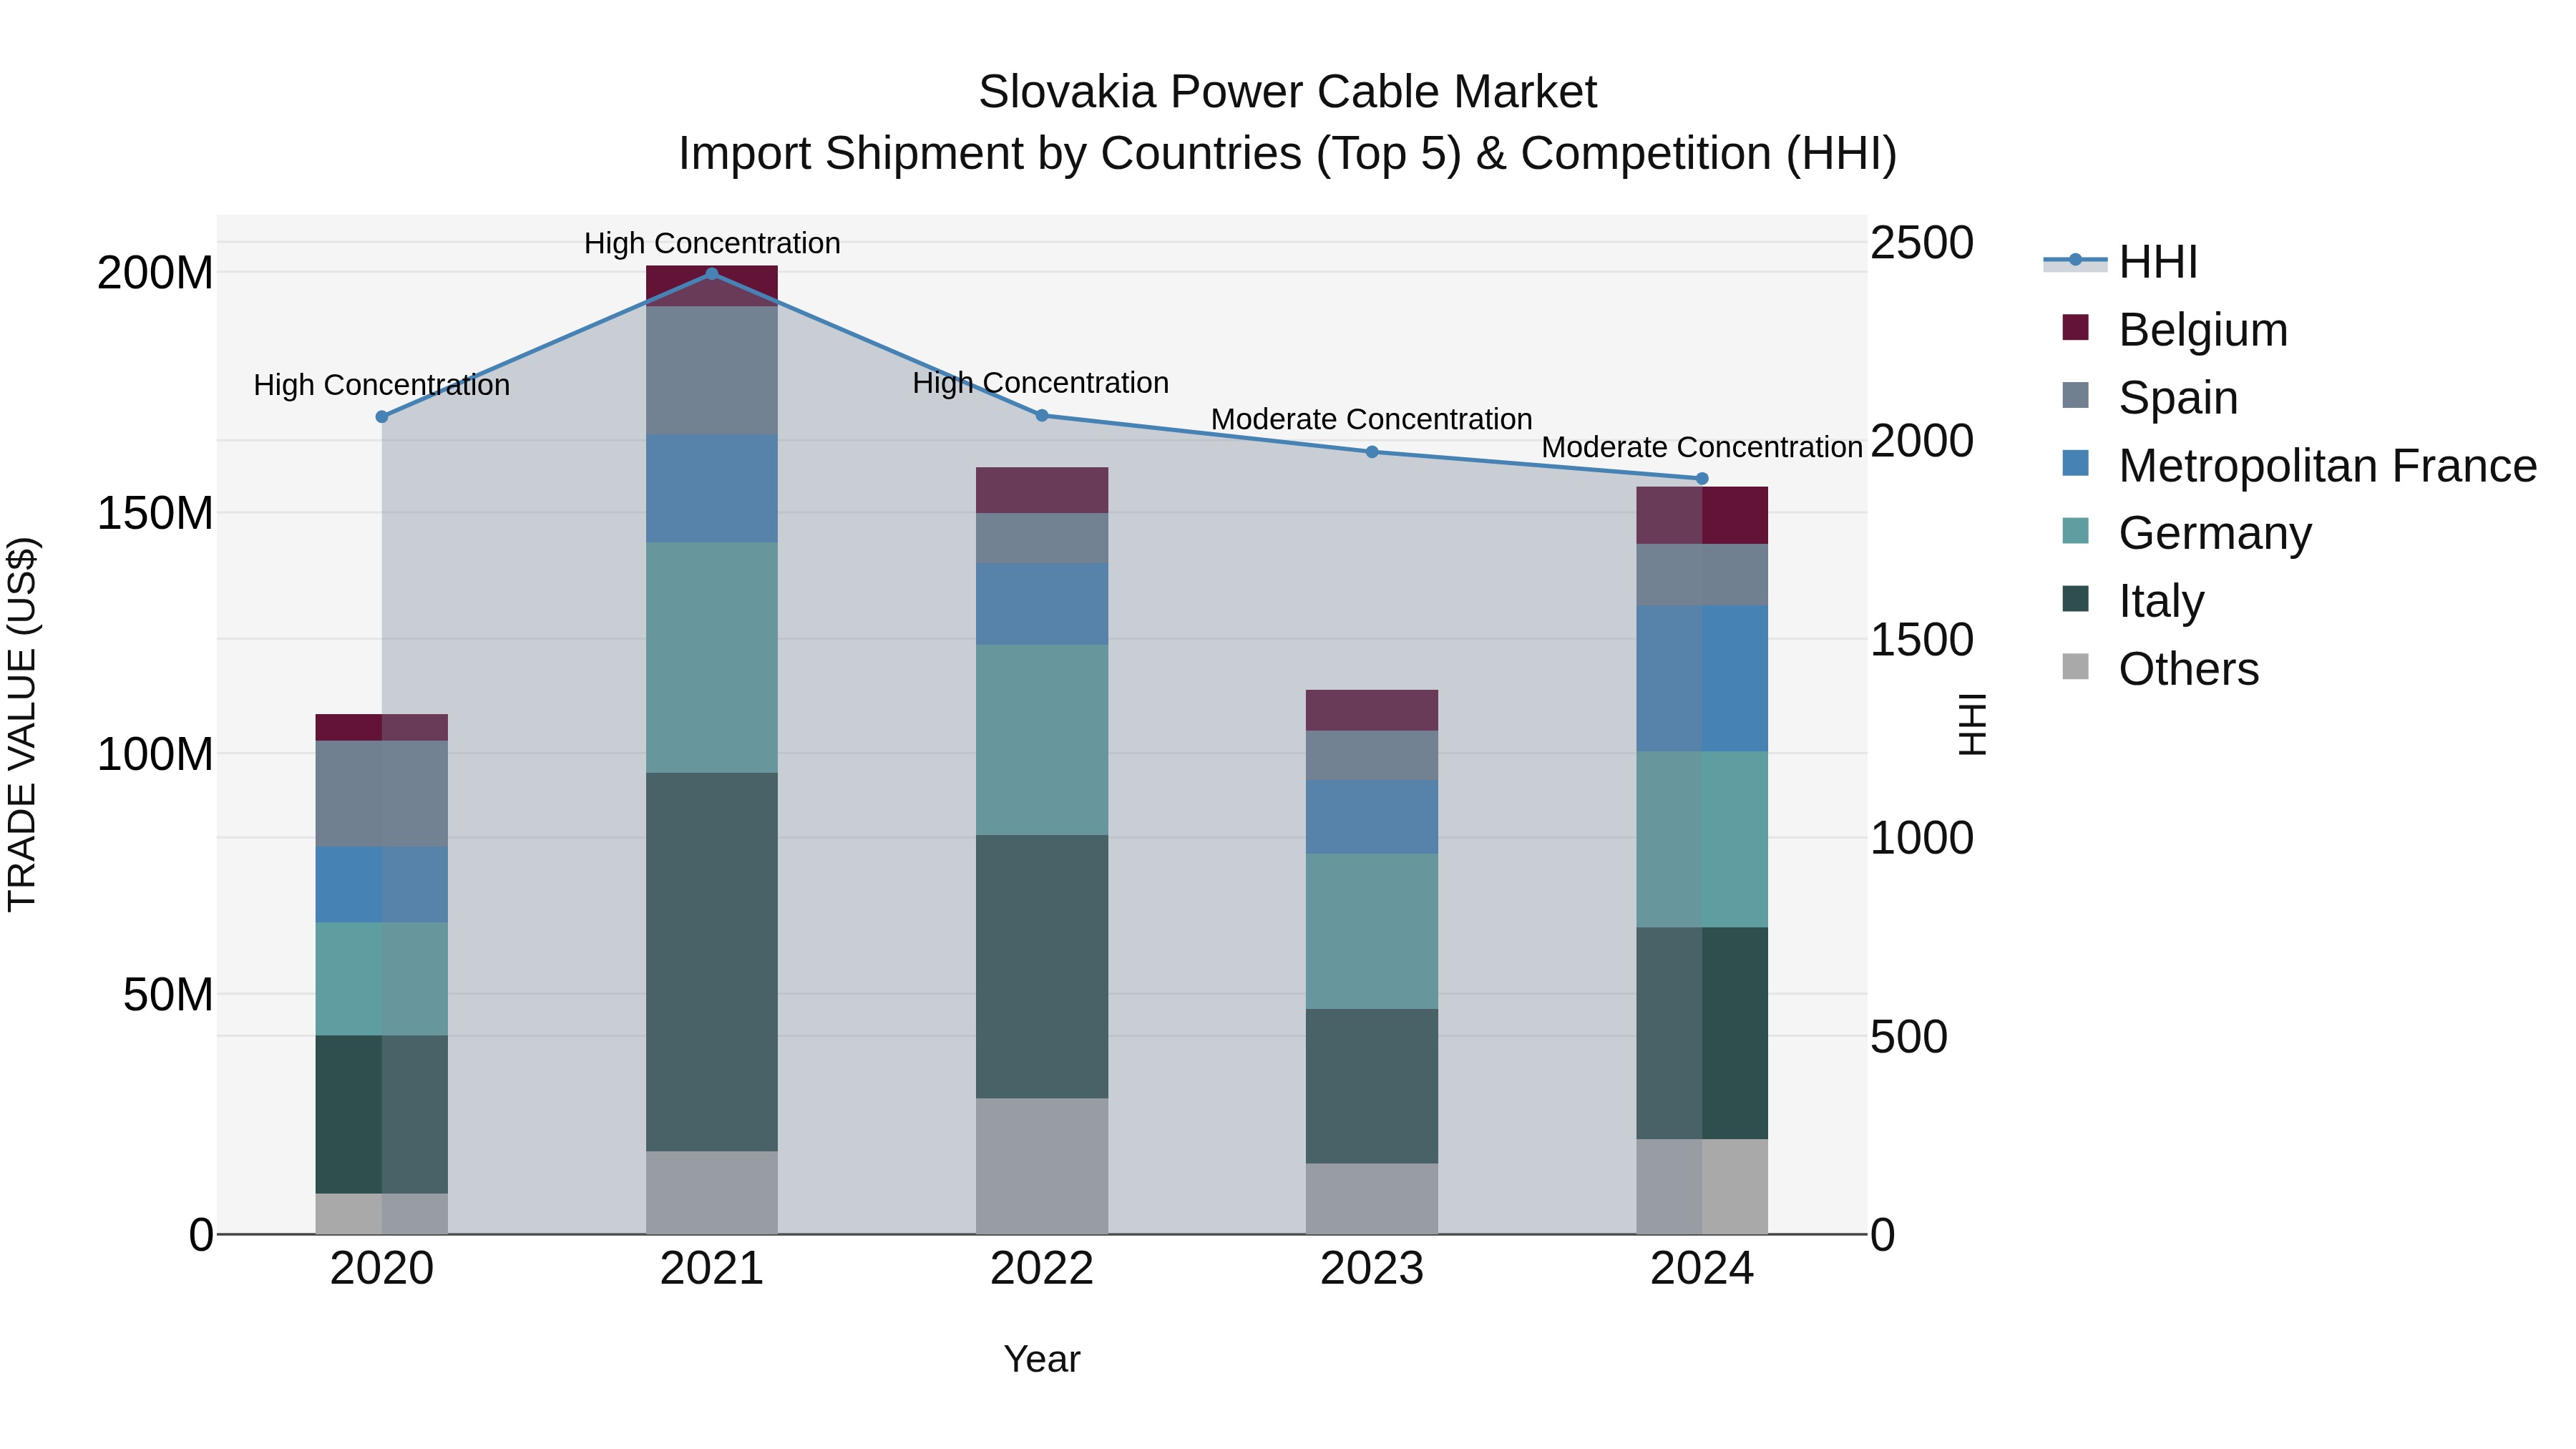
Slovakia Power Cable Market Top 5 Importing Countries and Market Competition (HHI) Analysis
Slovakia`s power cable import Market Top 5 Importing Countries and Market Competition (HHI) Analysis saw significant growth in 2024, with top exporting countries such as Italy, Germany, and France playing key roles. The Market Top 5 Importing Countries and Market Competition (HHI) Analysis remained moderately concentrated, indicating healthy competition among suppliers. The impressive CAGR of 9.48% from 2020 to 2024 reflects a growing demand for power cables in Slovakia. The impressive growth rate of 37.34% from 2023 to 2024 suggests a surge in import shipments, indicating a positive outlook for the Market Top 5 Importing Countries and Market Competition (HHI) Analysis in the near future.
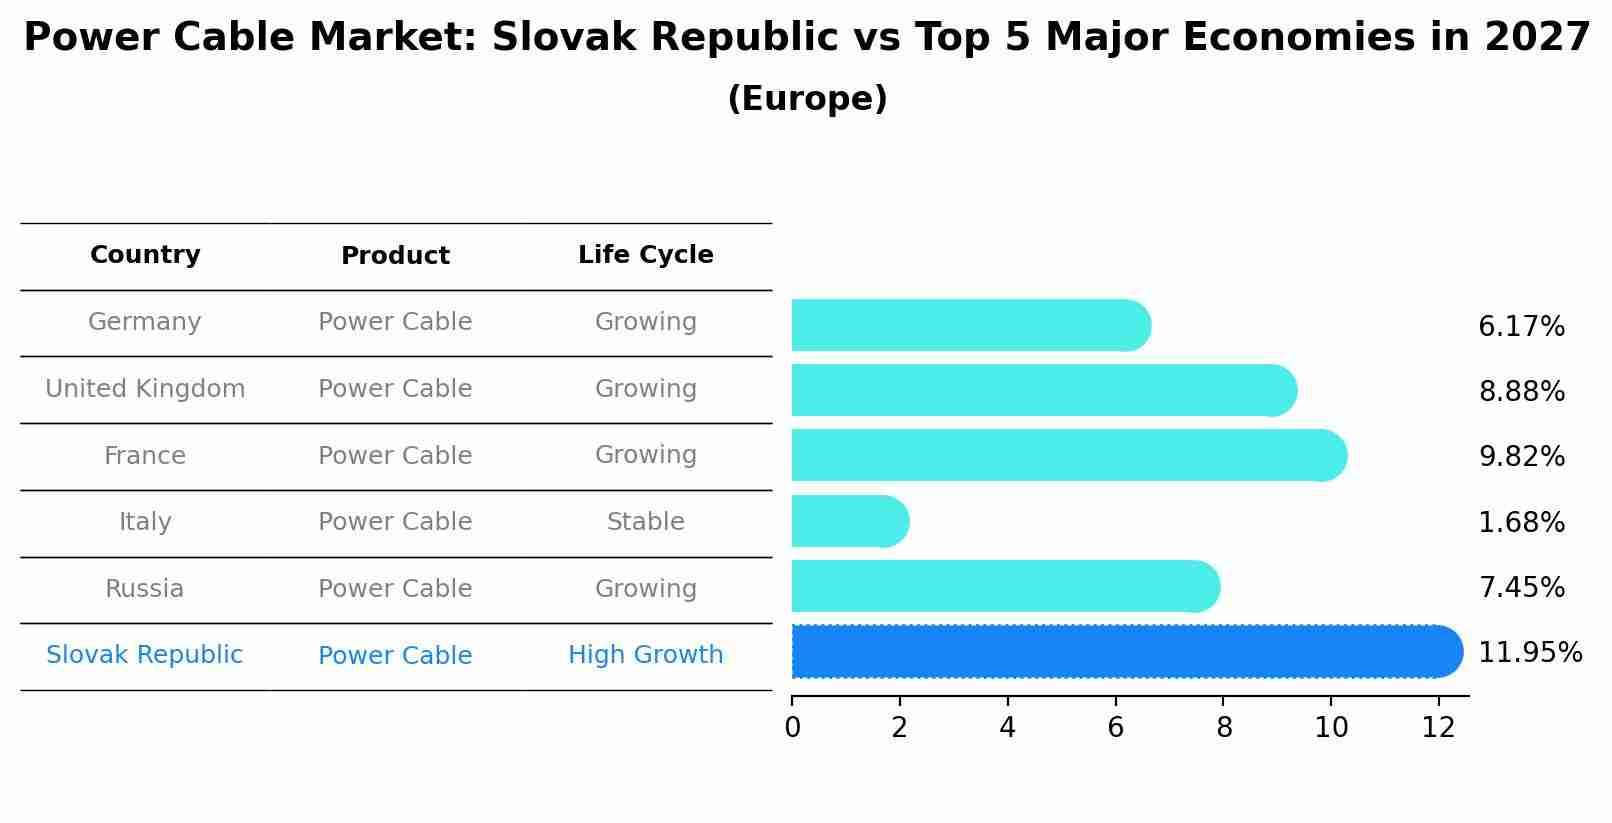
Power Cable Market: Slovak Republic vs Top 5 Major Economies in 2027 (Europe)
In the Europe region, the Power Cable market in Slovak Republic is projected to expand at a high growth rate of 11.95% by 2027. The largest economy is Germany, followed by United Kingdom, France, Italy and Russia.
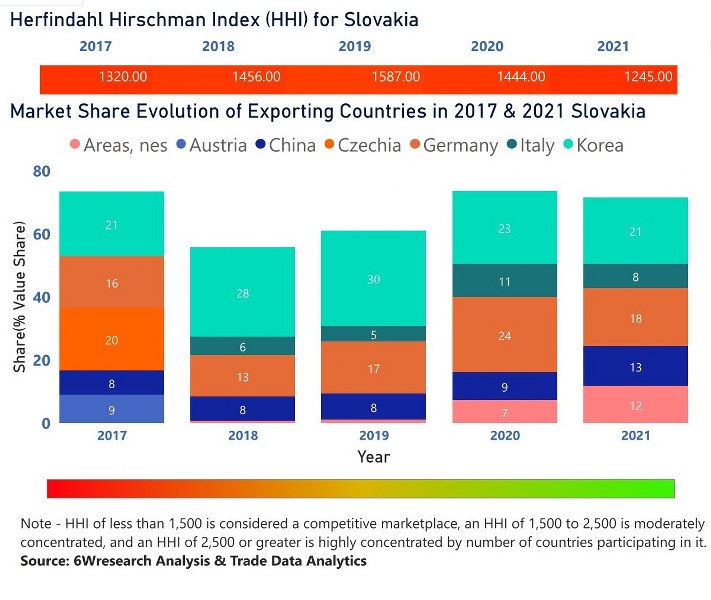
Slovakia Power Cable Market | Country-Wise Share and Competition Analysis
In the year 2021, Korea was the largest exporter in terms of value, followed by Germany. It has registered a growth of 8.97% over the previous year. While Germany registered a decline of -6.33% as compare to the previous year. In the year 2017 Korea was the largest exporter followed by Czechia. In term of Herfindahl Index, which measures the competitiveness of countries exporting, Slovakia has the Herfindahl index of 1320 in 2017 which signifies high competitiveness also in 2021 it registered a Herfindahl index of 1245 which signifies high competitiveness in the market.
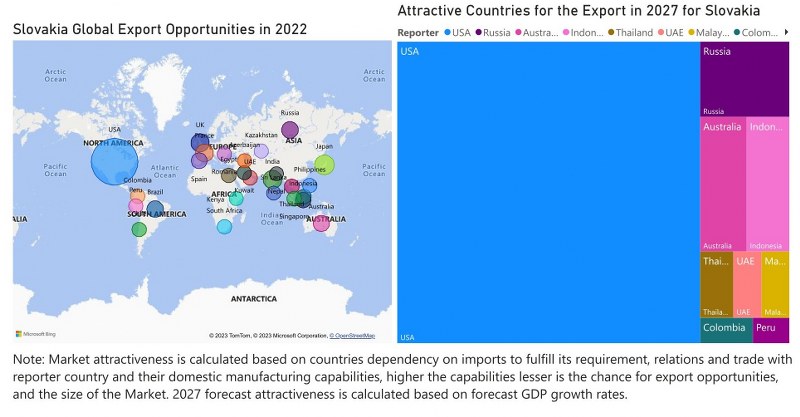
Slovakia Power Cable Market - Export Market Opportunities
Key Highlights of the Report:
- Slovakia Power Cable Market Outlook
- Market Size of Slovakia Power Cable Market, 2021
- Forecast of Slovakia Power Cable Market, 2028
- Historical Data and Forecast of Slovakia Power Cable Revenues & Volume for the Period 2018 - 2028
- Slovakia Power Cable Market Trend Evolution
- Slovakia Power Cable Market Drivers and Challenges
- Slovakia Power Cable Price Trends
- Slovakia Power Cable Porter's Five Forces
- Slovakia Power Cable Industry Life Cycle
- Historical Data and Forecast of Slovakia Power Cable Market Revenues & Volume By Installation Type for the Period 2018 - 2028
- Historical Data and Forecast of Slovakia Power Cable Market Revenues & Volume By Overhead for the Period 2018 - 2028
- Historical Data and Forecast of Slovakia Power Cable Market Revenues & Volume By Underground for the Period 2018 - 2028
- Historical Data and Forecast of Slovakia Power Cable Market Revenues & Volume By Submarine for the Period 2018 - 2028
- Historical Data and Forecast of Slovakia Power Cable Market Revenues & Volume By Voltage for the Period 2018 - 2028
- Historical Data and Forecast of Slovakia Power Cable Market Revenues & Volume By Low for the Period 2018 - 2028
- Historical Data and Forecast of Slovakia Power Cable Market Revenues & Volume By Medium for the Period 2018 - 2028
- Historical Data and Forecast of Slovakia Power Cable Market Revenues & Volume By High for the Period 2018 - 2028
- Historical Data and Forecast of Slovakia Power Cable Market Revenues & Volume By End Use for the Period 2018 - 2028
- Historical Data and Forecast of Slovakia Power Cable Market Revenues & Volume By Residential for the Period 2018 - 2028
- Historical Data and Forecast of Slovakia Power Cable Market Revenues & Volume By Commercial for the Period 2018 - 2028
- Historical Data and Forecast of Slovakia Power Cable Market Revenues & Volume By Industrial for the Period 2018 - 2028
- Historical Data and Forecast of Slovakia Power Cable Market Revenues & Volume By Utilities for the Period 2018 - 2028
- Slovakia Power Cable Import Export Trade Statistics
- Market Opportunity Assessment By Installation Type
- Market Opportunity Assessment By Voltage
- Market Opportunity Assessment By End Use
- Slovakia Power Cable Top Companies Market Share
- Slovakia Power Cable Competitive Benchmarking By Technical and Operational Parameters
- Slovakia Power Cable Company Profiles
- Slovakia Power Cable Key Strategic Recommendations
Frequently Asked Questions About the Market Study (FAQs):
6Wresearch actively monitors the Slovakia Power Cable Market and publishes its comprehensive annual report, highlighting emerging trends, growth drivers, revenue analysis, and forecast outlook. Our insights help businesses to make data-backed strategic decisions with ongoing market dynamics. Our analysts track relevent industries related to the Slovakia Power Cable Market, allowing our clients with actionable intelligence and reliable forecasts tailored to emerging regional needs.
Yes, we provide customisation as per your requirements. To learn more, feel free to contact us on sales@6wresearch.com
| 1 Executive Summary |
| 2 Introduction |
| 2.1 Key Highlights of the Report |
| 2.2 Report Description |
| 2.3 Market Scope & Segmentation |
| 2.4 Research Methodology |
| 2.5 Assumptions |
| 3 Slovakia Power Cable Market Overview |
| 3.1 Slovakia Country Macro Economic Indicators |
| 3.2 Slovakia Power Cable Market Revenues & Volume, 2021 & 2028F |
| 3.3 Slovakia Power Cable Market - Industry Life Cycle |
| 3.4 Slovakia Power Cable Market - Porter's Five Forces |
| 3.5 Slovakia Power Cable Market Revenues & Volume Share, By Installation Type, 2021 & 2028F |
| 3.6 Slovakia Power Cable Market Revenues & Volume Share, By Voltage, 2021 & 2028F |
| 3.7 Slovakia Power Cable Market Revenues & Volume Share, By End Use, 2021 & 2028F |
| 4 Slovakia Power Cable Market Dynamics |
| 4.1 Impact Analysis |
| 4.2 Market Drivers |
| 4.2.1 Increasing investment in infrastructure development projects in Slovakia |
| 4.2.2 Growing demand for renewable energy sources necessitating the expansion of power cable networks |
| 4.2.3 Favorable government regulations and initiatives to boost the power sector |
| 4.3 Market Restraints |
| 4.3.1 Volatility in raw material prices impacting the cost of manufacturing power cables |
| 4.3.2 Competition from alternative energy transmission technologies |
| 4.3.3 Economic uncertainties affecting investment decisions in the power sector |
| 5 Slovakia Power Cable Market Trends |
| 6 Slovakia Power Cable Market, By Types |
| 6.1 Slovakia Power Cable Market, By Installation Type |
| 6.1.1 Overview and Analysis |
| 6.1.2 Slovakia Power Cable Market Revenues & Volume, By Installation Type, 2018 - 2028F |
| 6.1.3 Slovakia Power Cable Market Revenues & Volume, By Overhead, 2018 - 2028F |
| 6.1.4 Slovakia Power Cable Market Revenues & Volume, By Underground, 2018 - 2028F |
| 6.1.5 Slovakia Power Cable Market Revenues & Volume, By Submarine, 2018 - 2028F |
| 6.2 Slovakia Power Cable Market, By Voltage |
| 6.2.1 Overview and Analysis |
| 6.2.2 Slovakia Power Cable Market Revenues & Volume, By Low, 2018 - 2028F |
| 6.2.3 Slovakia Power Cable Market Revenues & Volume, By Medium, 2018 - 2028F |
| 6.2.4 Slovakia Power Cable Market Revenues & Volume, By High, 2018 - 2028F |
| 6.3 Slovakia Power Cable Market, By End Use |
| 6.3.1 Overview and Analysis |
| 6.3.2 Slovakia Power Cable Market Revenues & Volume, By Residential, 2018 - 2028F |
| 6.3.3 Slovakia Power Cable Market Revenues & Volume, By Commercial, 2018 - 2028F |
| 6.3.4 Slovakia Power Cable Market Revenues & Volume, By Industrial, 2018 - 2028F |
| 6.3.5 Slovakia Power Cable Market Revenues & Volume, By Utilities, 2018 - 2028F |
| 7 Slovakia Power Cable Market Import-Export Trade Statistics |
| 7.1 Slovakia Power Cable Market Export to Major Countries |
| 7.2 Slovakia Power Cable Market Imports from Major Countries |
| 8 Slovakia Power Cable Market Key Performance Indicators |
8.1 Average length of power cable installations per project |
8.2 Percentage of power cable projects completed on schedule |
8.3 Adoption rate of new and advanced power cable technologies |
| 9 Slovakia Power Cable Market - Opportunity Assessment |
| 9.1 Slovakia Power Cable Market Opportunity Assessment, By Installation Type, 2021 & 2028F |
| 9.2 Slovakia Power Cable Market Opportunity Assessment, By Voltage, 2021 & 2028F |
| 9.3 Slovakia Power Cable Market Opportunity Assessment, By End Use, 2021 & 2028F |
| 10 Slovakia Power Cable Market - Competitive Landscape |
| 10.1 Slovakia Power Cable Market Revenue Share, By Companies, 2021 |
| 10.2 Slovakia Power Cable Market Competitive Benchmarking, By Operating and Technical Parameters |
| 11 Company Profiles |
| 12 Recommendations |
| 13 Disclaimer |
Global Go To Market Strategy - 2030
Export potential enables firms to identify high-growth global markets with greater confidence by combining advanced trade intelligence with a structured quantitative methodology. The framework analyzes emerging demand trends and country-level import patterns while integrating macroeconomic and trade datasets such as GDP and population forecasts, bilateral import–export flows, tariff structures, elasticity differentials between developed and developing economies, geographic distance, and import demand projections. Using weighted trade values from 2020–2024 as the base period to project country-to-country export potential for 2030, these inputs are operationalized through calculated drivers such as gravity model parameters, tariff impact factors, and projected GDP per-capita growth. Through an analysis of hidden potentials, demand hotspots, and market conditions that are most favorable to success, this method enables firms to focus on target countries, maximize returns, and global expansion with data, backed by accuracy.
By factoring in the projected importer demand gap that is currently unmet and could be potential opportunity, it identifies the potential for the Exporter (Country) among 190 countries, against the general trade analysis, which identifies the biggest importer or exporter.
To discover high-growth global markets and optimize your business strategy:
Click Here
Pricing
- Single User License$ 1,995
- Department License$ 2,400
- Site License$ 3,120
- Global License$ 3,795

Leadership Perspectives from Industry Events
Search
Thought Leadership and Analyst Meet


Our Clients
6WResearch In News
- India Air Conditioner Market Set for Strong Rebound in 2026 After Weather-Led Correction and GST-Driven Recovery: 6Wresearch
- ADAS in India: How Automatic Emergency Braking, Blind Spot Detection & Driver Monitoring are Transforming Road Safety
- Doha a strategic location for EV manufacturing hub: IPA Qatar
- Demand for luxury TVs surging in the GCC, says Samsung
- Empowering Growth: The Thriving Journey of Bangladesh’s Cable Industry
- Demand for luxury TVs surging in the GCC, says Samsung
Latest Reports
- Poland Fire Protection Systems Market (2026-2032)
- Cape Verde Portable Hand-Thrown Extinguisher Market (2026-2032)
- Canada Portable Hand-Thrown Extinguisher Market (2026-2032)
- Cameroon Portable Hand-Thrown Extinguisher Market (2026-2032)
- Burundi Portable Hand-Thrown Extinguisher Market (2026-2032)
- Burkina Faso Portable Hand-Thrown Extinguisher Market (2026-2032)
- Bulgaria Portable Hand-Thrown Extinguisher Market (2026-2032)
- Brunei Portable Hand-Thrown Extinguisher Market (2026-2032)
- Botswana Portable Hand-Thrown Extinguisher Market (2026-2032)
- Bosnia and Herzegovina Portable Hand-Thrown Extinguisher Market (2026-2032)
Industry Events and Analyst Meet

HIMTEX 2026

India Refining Summit 2026

India EV Show 2026

EV tech India Expo 2026

Auto Tech Asia 2026
Whitepaper
- Middle East & Africa Commercial Security Market Click here to view more.
- Middle East & Africa Fire Safety Systems & Equipment Market Click here to view more.
- GCC Drone Market Click here to view more.
- Middle East Lighting Fixture Market Click here to view more.
- GCC Physical & Perimeter Security Market Click here to view more.