Slovenia Smart Toilet Market (2026-2032) | Industry, Segmentation, Companies, Share, Size, Value, Revenue, Analysis, Growth, Forecast, Outlook & Trends
Market Forecast By Technology (Mobile Application, Non-Mobile Application), By Type (Wall Hung Toilet, Close-Coupled, Single Floor Standing Toilet, One-Piece Toilet, Others), By Usage (Residential, Commercial), By Distribution Channel (Online Stores, Offline Stores) And Competitive Landscape
| Product Code: ETC4923096 | Publication Date: Nov 2023 | Updated Date: Apr 2026 | Product Type: Market Research Report | |
| Publisher: 6Wresearch | Author: Shubham Padhi | No. of Pages: 60 | No. of Figures: 30 | No. of Tables: 5 |
Slovenia Smart Toilet Market Size (2020-2030)
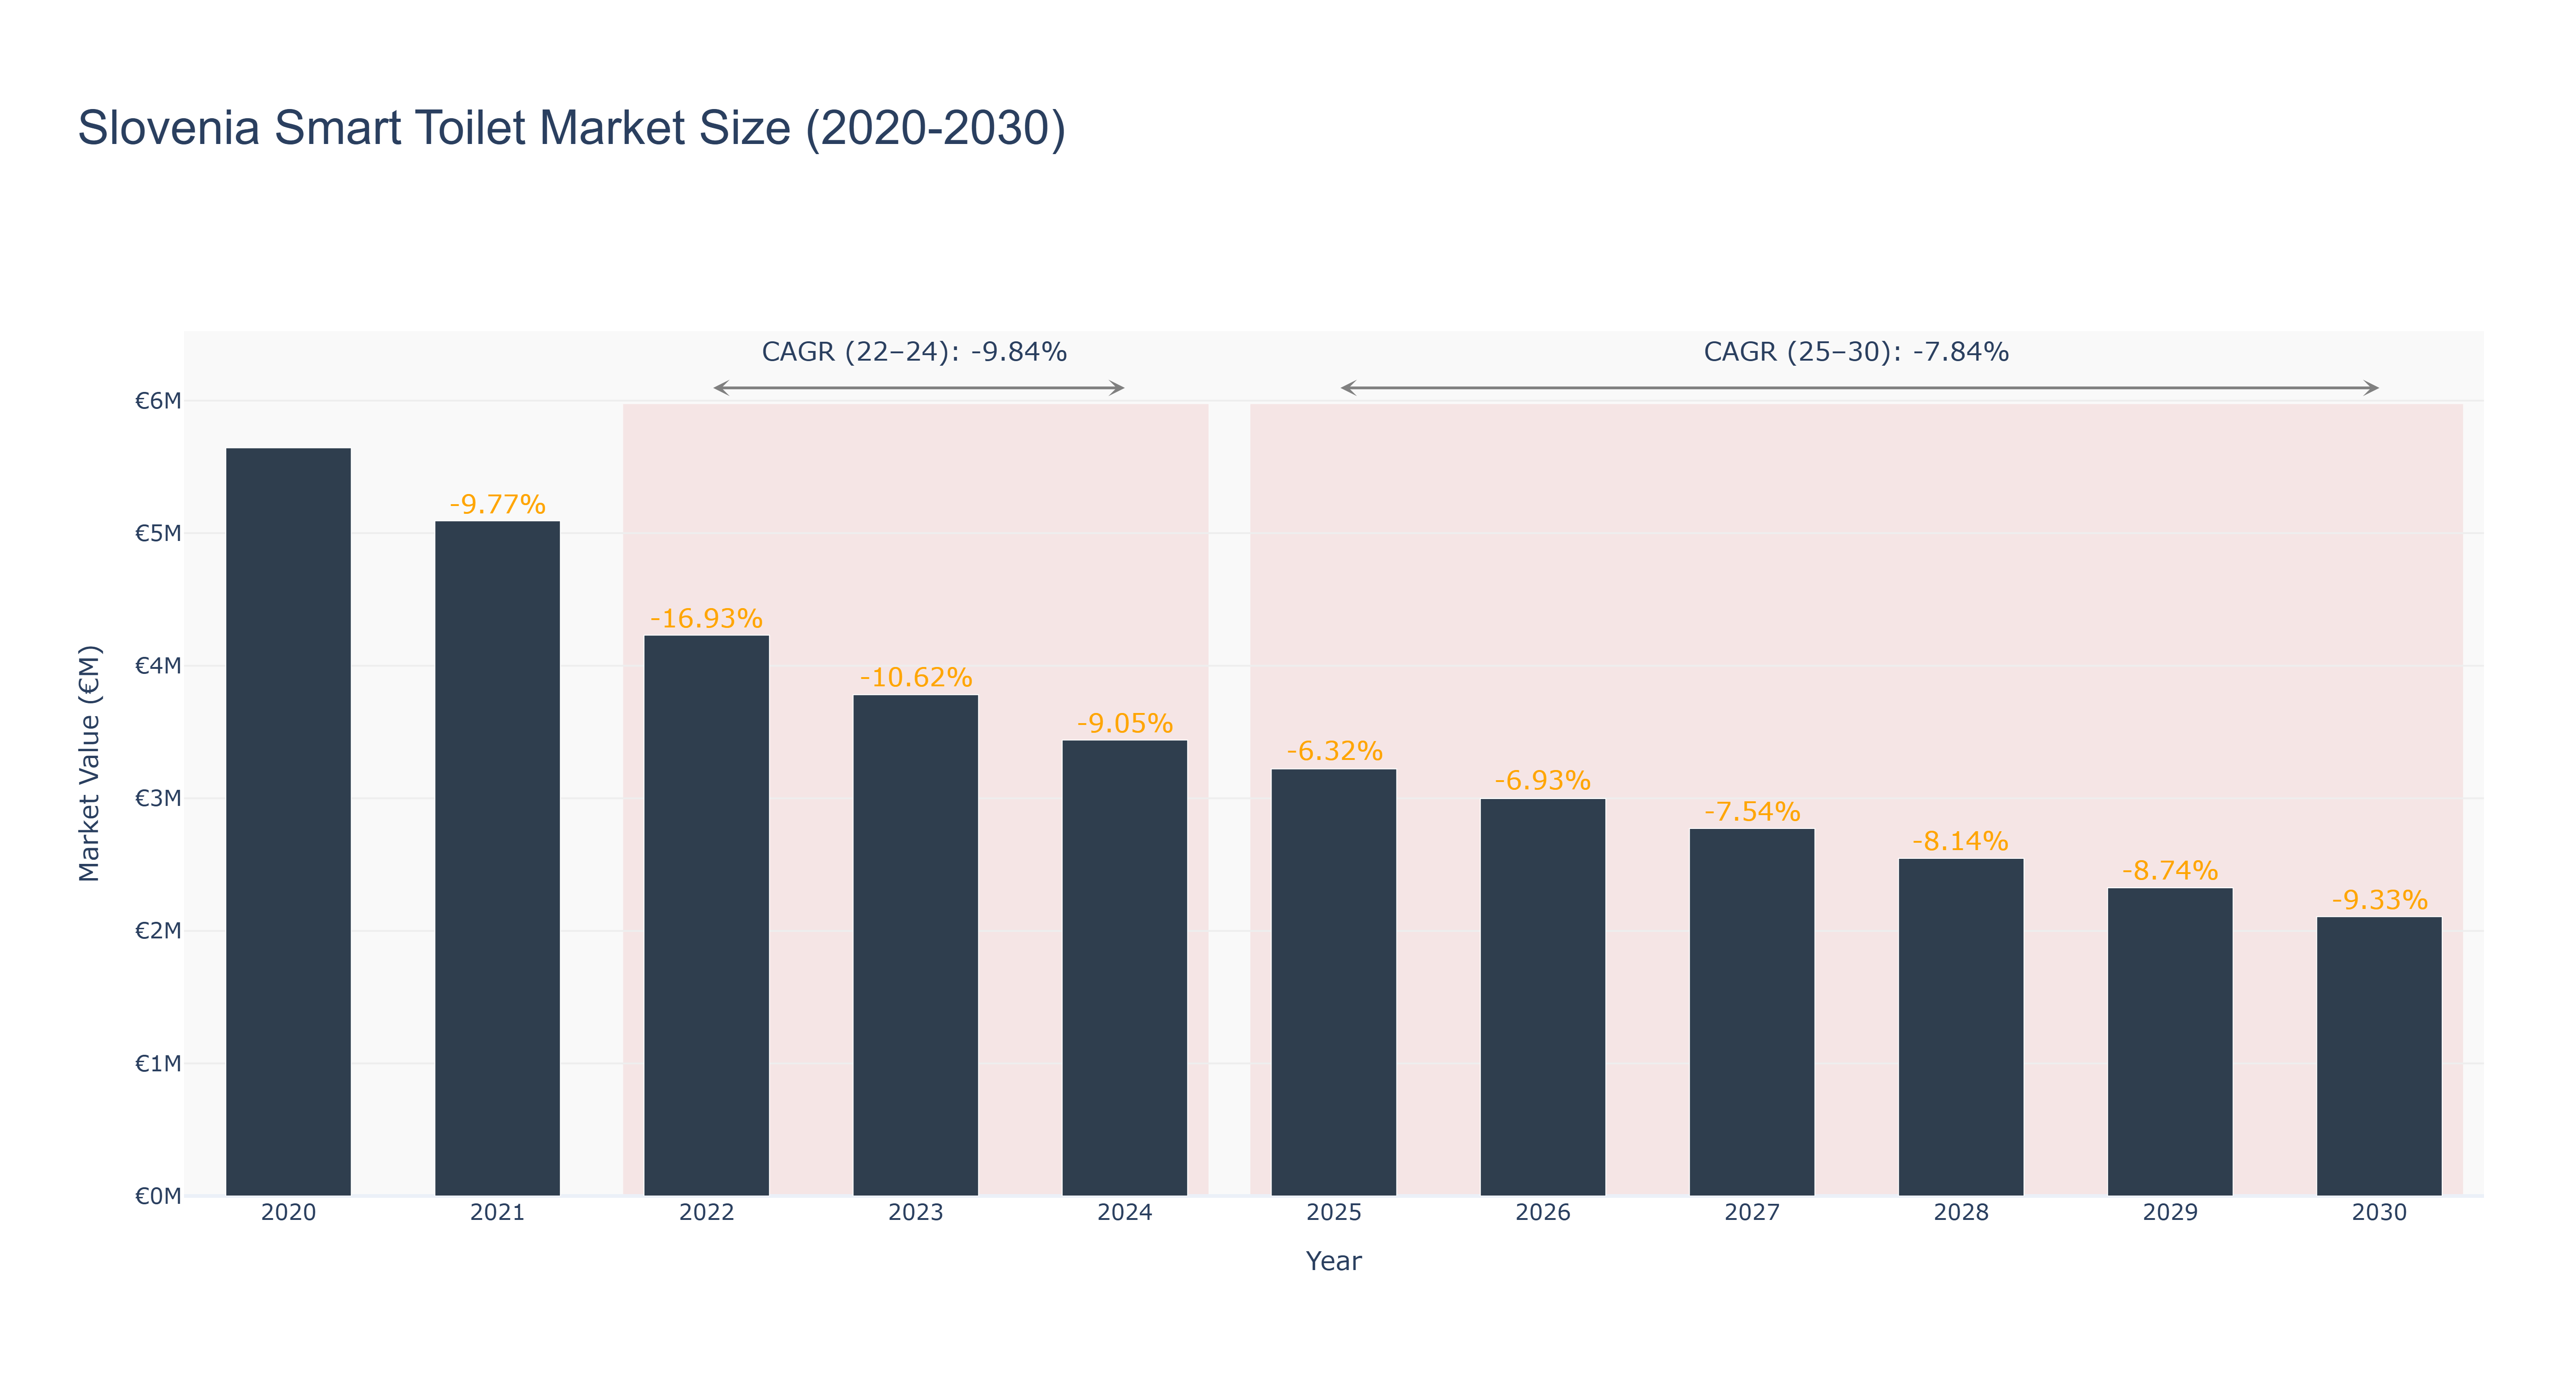
Slovenia Smart Toilet Market has experienced a declining trend in market size over the years. The peak market size of €5.64 million was observed in 2020, followed by a steady decrease to €2.11 million in 2030. The CAGR from 2022 to 2024 was -9.84%, while the forecasted CAGR from 2025 to 2030 is -7.84%. This downward trajectory can be attributed to factors such as market saturation, technological advancements leading to lower prices, and changing consumer preferences. To counter this trend, upcoming developments in the market include the integration of IoT technology for smart toilets, aiming to enhance user experience and sustainability. These innovations are expected to drive market growth and attract new consumers in the coming years.
Slovenia Smart Toilet Market: Production & Trade Performance (2019-2025)
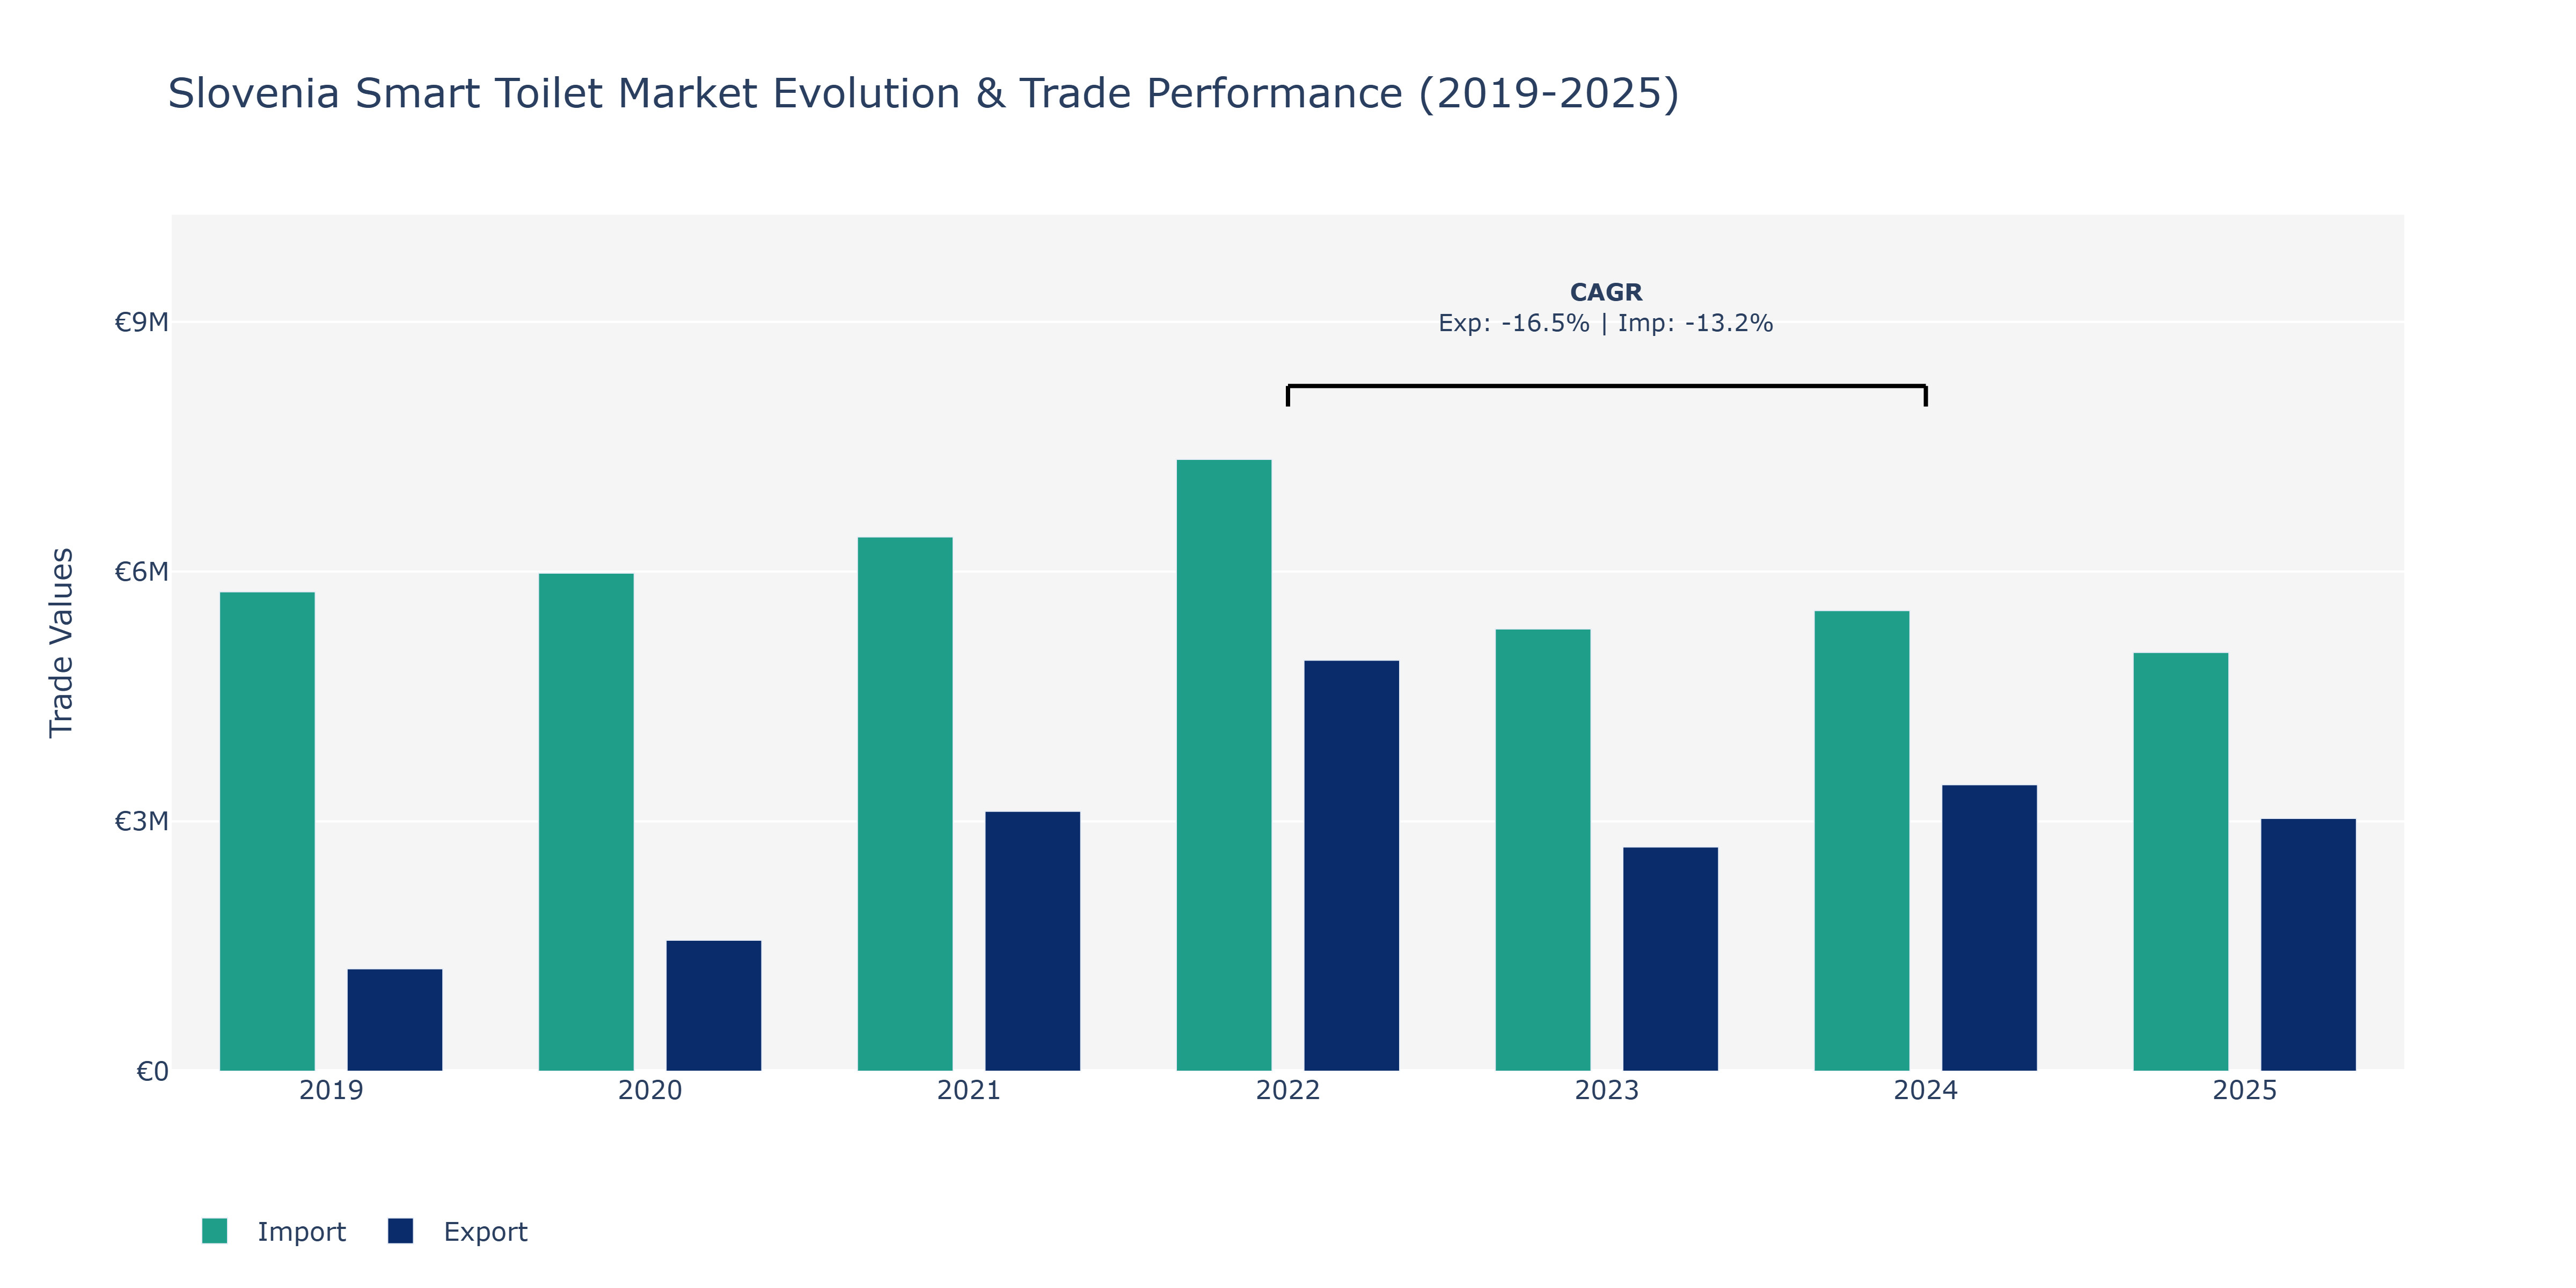
Slovenia's Smart Toilet Market saw notable fluctuations in Exports and Imports from 2019 to 2025. Exports started at €1.23 million in 2019, increased to €1.57 million in 2020, peaked at €4.94 million in 2022, and then declined to €3.44 million in 2024 before slightly dropping again to €3.04 million in 2025. On the other hand, Imports began at €5.76 million in 2019, rose steadily to €7.35 million in 2022, and then decreased to €5.53 million in 2024, with a slight further decline in 2025 to €5.03 million. The fluctuations in Exports and Imports can be attributed to factors such as changes in consumer demand for smart toilet products, global economic conditions affecting trade flows, and technological advancements impacting market competitiveness. The decreasing trend in both Exports and Imports from 2022 to 2024 aligns with the reported negative CAGRs during this period, reflecting possible market adjustments or external factors influencing the Smart Toilet industry in Slovenia.
Key Highlights of the Report:
- Slovenia Smart Toilet Market Outlook
- Market Size of Slovenia Smart Toilet Market, 2025
- Forecast of Slovenia Smart Toilet Market, 2032
- Historical Data and Forecast of Slovenia Smart Toilet Revenues & Volume for the Period 2022-2032F
- Slovenia Smart Toilet Market Trend Evolution
- Slovenia Smart Toilet Market Drivers and Challenges
- Slovenia Smart Toilet Price Trends
- Slovenia Smart Toilet Porter`s Five Forces
- Slovenia Smart Toilet Industry Life Cycle
- Historical Data and Forecast of Slovenia Smart Toilet Market Revenues & Volume By Technology for the Period 2022-2032F
- Historical Data and Forecast of Slovenia Smart Toilet Market Revenues & Volume By Mobile Application for the Period 2022-2032F
- Historical Data and Forecast of Slovenia Smart Toilet Market Revenues & Volume By Non-Mobile Application for the Period 2022-2032F
- Historical Data and Forecast of Slovenia Smart Toilet Market Revenues & Volume By Type for the Period 2022-2032F
- Historical Data and Forecast of Slovenia Smart Toilet Market Revenues & Volume By Wall Hung Toilet for the Period 2022-2032F
- Historical Data and Forecast of Slovenia Smart Toilet Market Revenues & Volume By Close-Coupled for the Period 2022-2032F
- Historical Data and Forecast of Slovenia Smart Toilet Market Revenues & Volume By Single Floor Standing Toilet for the Period 2022-2032F
- Historical Data and Forecast of Slovenia Smart Toilet Market Revenues & Volume By One-Piece Toilet for the Period 2022-2032F
- Historical Data and Forecast of Slovenia Smart Toilet Market Revenues & Volume By Others for the Period 2022-2032F
- Historical Data and Forecast of Slovenia Smart Toilet Market Revenues & Volume By Usage for the Period 2022-2032F
- Historical Data and Forecast of Slovenia Smart Toilet Market Revenues & Volume By Residential for the Period 2022-2032F
- Historical Data and Forecast of Slovenia Smart Toilet Market Revenues & Volume By Commercial for the Period 2022-2032F
- Historical Data and Forecast of Slovenia Smart Toilet Market Revenues & Volume By Distribution Channel for the Period 2022-2032F
- Historical Data and Forecast of Slovenia Smart Toilet Market Revenues & Volume By Online Stores for the Period 2022-2032F
- Historical Data and Forecast of Slovenia Smart Toilet Market Revenues & Volume By Offline Stores for the Period 2022-2032F
- Slovenia Smart Toilet Import Export Trade Statistics
- Market Opportunity Assessment By Technology
- Market Opportunity Assessment By Type
- Market Opportunity Assessment By Usage
- Market Opportunity Assessment By Distribution Channel
- Slovenia Smart Toilet Top Companies Market Share
- Slovenia Smart Toilet Competitive Benchmarking By Technical and Operational Parameters
- Slovenia Smart Toilet Company Profiles
- Slovenia Smart Toilet Key Strategic Recommendations
Frequently Asked Questions About the Market Study (FAQs):
6Wresearch actively monitors the Slovenia Smart Toilet Market and publishes its comprehensive annual report, highlighting emerging trends, growth drivers, revenue analysis, and forecast outlook. Our insights help businesses to make data-backed strategic decisions with ongoing market dynamics. Our analysts track relevent industries related to the Slovenia Smart Toilet Market, allowing our clients with actionable intelligence and reliable forecasts tailored to emerging regional needs.
Yes, we provide customisation as per your requirements. To learn more, feel free to contact us on sales@6wresearch.com
1 Executive Summary |
2 Introduction |
2.1 Key Highlights of the Report |
2.2 Report Description |
2.3 Market Scope & Segmentation |
2.4 Research Methodology |
2.5 Assumptions |
3 Slovenia Smart Toilet Market Overview |
3.1 Slovenia Country Macro Economic Indicators |
3.2 Slovenia Smart Toilet Market Revenues & Volume, 2022 & 2032F |
3.3 Slovenia Smart Toilet Market - Industry Life Cycle |
3.4 Slovenia Smart Toilet Market - Porter's Five Forces |
3.5 Slovenia Smart Toilet Market Revenues & Volume Share, By Technology, 2022 & 2032F |
3.6 Slovenia Smart Toilet Market Revenues & Volume Share, By Type, 2022 & 2032F |
3.7 Slovenia Smart Toilet Market Revenues & Volume Share, By Usage, 2022 & 2032F |
3.8 Slovenia Smart Toilet Market Revenues & Volume Share, By Distribution Channel, 2022 & 2032F |
4 Slovenia Smart Toilet Market Dynamics |
4.1 Impact Analysis |
4.2 Market Drivers |
4.2.1 Increasing awareness about hygiene and sanitation |
4.2.2 Growing demand for smart home devices and IoT technology |
4.2.3 Government initiatives promoting sustainable infrastructure development |
4.3 Market Restraints |
4.3.1 High initial cost of smart toilets |
4.3.2 Limited consumer awareness and education about smart toilet benefits |
4.3.3 Lack of skilled labor for installation and maintenance |
5 Slovenia Smart Toilet Market Trends |
6 Slovenia Smart Toilet Market Segmentations |
6.1 Slovenia Smart Toilet Market, By Technology |
6.1.1 Overview and Analysis |
6.1.2 Slovenia Smart Toilet Market Revenues & Volume, By Mobile Application, 2022-2032F |
6.1.3 Slovenia Smart Toilet Market Revenues & Volume, By Non-Mobile Application, 2022-2032F |
6.2 Slovenia Smart Toilet Market, By Type |
6.2.1 Overview and Analysis |
6.2.2 Slovenia Smart Toilet Market Revenues & Volume, By Wall Hung Toilet, 2022-2032F |
6.2.3 Slovenia Smart Toilet Market Revenues & Volume, By Close-Coupled, 2022-2032F |
6.2.4 Slovenia Smart Toilet Market Revenues & Volume, By Single Floor Standing Toilet, 2022-2032F |
6.2.5 Slovenia Smart Toilet Market Revenues & Volume, By One-Piece Toilet, 2022-2032F |
6.2.6 Slovenia Smart Toilet Market Revenues & Volume, By Others, 2022-2032F |
6.3 Slovenia Smart Toilet Market, By Usage |
6.3.1 Overview and Analysis |
6.3.2 Slovenia Smart Toilet Market Revenues & Volume, By Residential, 2022-2032F |
6.3.3 Slovenia Smart Toilet Market Revenues & Volume, By Commercial, 2022-2032F |
6.4 Slovenia Smart Toilet Market, By Distribution Channel |
6.4.1 Overview and Analysis |
6.4.2 Slovenia Smart Toilet Market Revenues & Volume, By Online Stores, 2022-2032F |
6.4.3 Slovenia Smart Toilet Market Revenues & Volume, By Offline Stores, 2022-2032F |
7 Slovenia Smart Toilet Market Import-Export Trade Statistics |
7.1 Slovenia Smart Toilet Market Export to Major Countries |
7.2 Slovenia Smart Toilet Market Imports from Major Countries |
8 Slovenia Smart Toilet Market Key Performance Indicators |
8.1 Average number of IoT devices per household |
8.2 Percentage of households with access to smart home technology |
8.3 Adoption rate of sustainable infrastructure solutions in residential buildings |
9 Slovenia Smart Toilet Market - Opportunity Assessment |
9.1 Slovenia Smart Toilet Market Opportunity Assessment, By Technology, 2022 & 2032F |
9.2 Slovenia Smart Toilet Market Opportunity Assessment, By Type, 2022 & 2032F |
9.3 Slovenia Smart Toilet Market Opportunity Assessment, By Usage, 2022 & 2032F |
9.4 Slovenia Smart Toilet Market Opportunity Assessment, By Distribution Channel, 2022 & 2032F |
10 Slovenia Smart Toilet Market - Competitive Landscape |
10.1 Slovenia Smart Toilet Market Revenue Share, By Companies, 2025 |
10.2 Slovenia Smart Toilet Market Competitive Benchmarking, By Operating and Technical Parameters |
11 Company Profiles |
12 Recommendations | 13 Disclaimer |
Global Go To Market Strategy - 2030
Export potential enables firms to identify high-growth global markets with greater confidence by combining advanced trade intelligence with a structured quantitative methodology. The framework analyzes emerging demand trends and country-level import patterns while integrating macroeconomic and trade datasets such as GDP and population forecasts, bilateral import–export flows, tariff structures, elasticity differentials between developed and developing economies, geographic distance, and import demand projections. Using weighted trade values from 2020–2024 as the base period to project country-to-country export potential for 2030, these inputs are operationalized through calculated drivers such as gravity model parameters, tariff impact factors, and projected GDP per-capita growth. Through an analysis of hidden potentials, demand hotspots, and market conditions that are most favorable to success, this method enables firms to focus on target countries, maximize returns, and global expansion with data, backed by accuracy.
By factoring in the projected importer demand gap that is currently unmet and could be potential opportunity, it identifies the potential for the Exporter (Country) among 190 countries, against the general trade analysis, which identifies the biggest importer or exporter.
To discover high-growth global markets and optimize your business strategy:
Click Here
Pricing
- Single User License$ 1,995
- Department License$ 2,400
- Site License$ 3,120
- Global License$ 3,795

Leadership Perspectives from Industry Events
Search
Thought Leadership and Analyst Meet


Our Clients
6WResearch In News
- India Export Attractiveness Tracker 2026
- India Air Conditioner Market Set for Strong Rebound in 2026 After Weather-Led Correction and GST-Driven Recovery: 6Wresearch
- ADAS in India: How Automatic Emergency Braking, Blind Spot Detection & Driver Monitoring are Transforming Road Safety
- Doha a strategic location for EV manufacturing hub: IPA Qatar
- Demand for luxury TVs surging in the GCC, says Samsung
- Empowering Growth: The Thriving Journey of Bangladesh’s Cable Industry
Latest Reports
- Nicaragua RPG Gaming Market (2026-2032)
- New Zealand RPG Gaming Market (2026-2032)
- Netherlands RPG Gaming Market (2026-2032)
- Nauru RPG Gaming Market (2026-2032)
- Namibia RPG Gaming Market (2026-2032)
- Mozambique RPG Gaming Market (2026-2032)
- Montenegro RPG Gaming Market (2026-2032)
- Mongolia RPG Gaming Market (2026-2032)
- Monaco RPG Gaming Market (2026-2032)
- Micronesia RPG Gaming Market (2026-2032)
Industry Events and Analyst Meet

EV India Expo 2026

HIMTEX 2026

India Refining Summit 2026

India EV Show 2026

EV tech India Expo 2026
Whitepaper
- Middle East & Africa Commercial Security Market Click here to view more.
- Middle East & Africa Fire Safety Systems & Equipment Market Click here to view more.
- GCC Drone Market Click here to view more.
- Middle East Lighting Fixture Market Click here to view more.
- GCC Physical & Perimeter Security Market Click here to view more.