South Korea 3D Reconstruction Solutions Market (2026-2032) | Investment Trends, Size, Restraints, Value, Strategic Insights, Analysis, Supply, Growth, Industry, Share, Pricing Analysis, Trends, Consumer Insights, Drivers, Strategy, Demand, Challenges, Segments, Competitive, Forecast, Outlook, Competition, Opportunities, Companies, Revenue, Segmentation
Market Forecast By Component (Software, Services), By Type (Active 3D Reconstruction, Passive 3D Reconstruction) And Competitive Landscape
| Product Code: ETC11593258 | Publication Date: Apr 2025 | Updated Date: Jun 2026 | Product Type: Market Research Report | |
| Publisher: 6Wresearch | Author: Bhawna Singh | No. of Pages: 70 | No. of Figures: 35 | No. of Tables: 5 |
South Korea 3D Reconstruction Solutions Market Growth Rate
According to 6Wresearch internal database and industry insights, the South Korea 3D Reconstruction Solutions Market is projected to grow at a compound annual growth rate (CAGR) of 1.6% during the forecast period (2026-2032).
South Korea 3D Eye Tracking Software Market Year-wise Growth Rate and Key Drivers
This graph illustrates the annual growth rates of the South Korea 3D Reconstruction Solutions Market from 2021 to 2032, highlighting a consistent upward trend and steady market expansion over the forecast period.
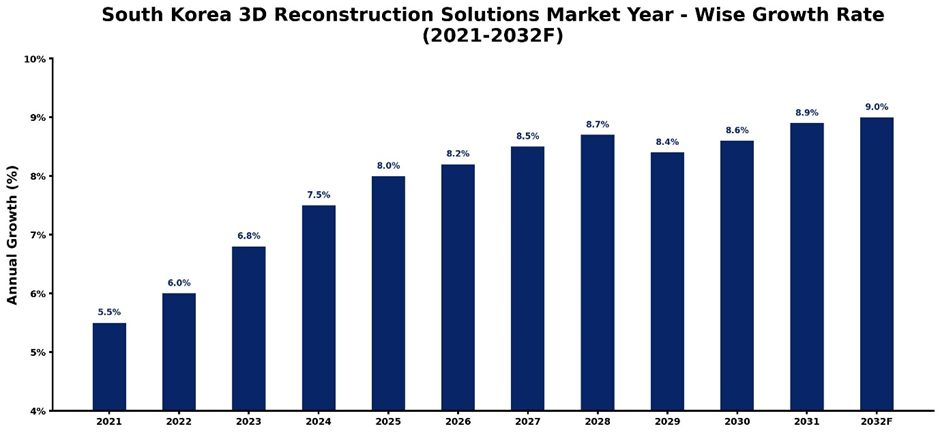
The following table summarizes the historical and forecasted growth rates of the South Korea 3D Reconstruction Solutions Market, along with the rationale behind each year’s performance.
| Year | Estimated Growth (%) | Market Rationale |
| 2021 | 5.5% | Initial adoption in industrial and medical sectors with pilot projects and early implementation. |
| 2022 | 6% | Government incentives for digital imaging and smart manufacturing start to influence adoption. |
| 2023 | 6.8% | Expansion in medical imaging applications and integration into automotive and engineering workflows. |
| 2024 | 7.5% | Increase in R&D investment for LiDAR and photogrammetry-based reconstruction solutions. |
| 2025 | 8% | Strong uptake in construction, architecture, and urban planning projects boosts demand. |
| 2026 | 8.2% | Rising demand for precision engineering and AR/VR applications drives solution deployment. |
| 2027 | 8.5% | Accelerated adoption in robotics and industrial automation; AI integration expands capabilities. |
| 2028 | 8.7% | Consolidation of 3D scanning and reconstruction workflows across multiple industry verticals. |
| 2029 | 8.4% | Slight moderation as early adopter segments reach saturation; continued growth in new applications. |
| 2030 | 8.6% | Launch of advanced real-time reconstruction software and cloud-based 3D processing solutions. |
| 2031 | 8.9% | Expansion in smart city, IoT-enabled projects, and cross-industry collaborations. |
| 2032 | 9% | Full-scale adoption across medical, industrial, and construction sectors reaches maturity. |
Topics Covered in the South Korea 3D Reconstruction Solutions Market Report
The South Korea 3D Reconstruction Solutions Market report thoroughly covers the market by type and Component. The market report provides an unbiased and detailed analysis of ongoing market trends, opportunities/high growth areas, and market drivers, which help stakeholders devise and align their market strategies according to the current and future market dynamics.
South Korea 3D Reconstruction Solutions MarketHighlights
| Report Name | South Korea 3D Reconstruction Solutions Market |
| Forecast period | 2026-2032 |
| CAGR | 1.6% |
| Growing Sector | Industrial & Medical Imaging Solutions |
South Korea 3D Reconstruction Solutions Market Synopsis
South Korea 3D Reconstruction Solutions Market is expected to experience impressive growth during the forecast period. This growth can be attributed to the increased use of imaging technology in the health, manufacturing, and urban planning sectors. With the help of imaging technology like photogrammetry for 3D modeling, there is a significant improvement in the process efficiency. Other factors driving market growth include government incentives, investments in research and development, as well as collaboration with start-ups specializing in imaging technology with artificial intelligence.
Evaluation of Growth Drivers in the South Korea 3D Reconstruction Solutions Market (2026-2032)
Below mentioned are some prominent drivers and their influence on the market dynamics:
| Drivers | Primary Segments Affected | Why it Matters (Evidence) |
| Increased Adoption in Healthcare | Software, Services | Hospitals and diagnostic centers are deploying 3D reconstruction to enhance imaging accuracy and surgical planning. |
| Integration with Industrial IoT | Software & Services | Smart factories and robotics benefit from 3D reconstruction for quality control and process optimization. |
| Rising Use in Construction & Architecture | Software, Services | Precision modeling in construction projects increases demand for high-resolution reconstruction solutions. |
| Advancements in AI & Machine Learning | Software | AI integration improves speed, accuracy, and automation in 3D reconstruction workflows. |
| Government Incentives for Digital Innovation | All Types, Industrial & Medical | South Korea’s support programs for Industry 4.0 adoption accelerate investment in advanced 3D solutions. |
South Korea 3D Reconstruction Solutions Market is expected to grow at the CAGR of 1.6% during the forecast period of 2026-2032. The expansion is primarily driven by increasing use of AI-powered reconstruction, government-led digital innovation initiatives, and the rising integration of 3D solutions in healthcare and industrial processes. Additionally, enhanced collaboration between domestic software developers and international imaging technology providers supports further growth in this market segment.
Evaluation of Restraints in the South Korea 3D Reconstruction Solutions Market
Below mentioned are some major restraints and their influence on the market dynamics:
| Restraints | Primary Segments Affected | What This Means (Evidence) |
| High Software Costs | Software, Services | Advanced 3D reconstruction solutions are expensive, limiting adoption by small enterprises. |
| Technical Skill Gaps | All Types | Shortage of trained operators slows effective implementation of reconstruction solutions. |
| Data Storage Challenges | Software, Services | Large datasets generated by 3D scanning require robust storage and cloud infrastructure. |
| Integration Complexity | Software, Services | Compatibility issues with legacy systems delay adoption in industrial settings. |
| Limited Awareness in SMEs | Software, Services | Smaller businesses are slower to implement advanced reconstruction technologies. |
South Korea 3D Reconstruction Solutions Market Challenges
Although the market demonstrates robust growth, it still struggles with certain problems including expensive software, lack of trained workforce, and system integration issues. Moreover, the requirement for a lot of computing power and adequate storage facilities is another challenge for implementation on a smaller scale. The need to tackle those problems is important for maintaining South Korea 3D Reconstruction Solutions Market Growth.
South Korea 3D Reconstruction Solutions Market Trends
Major trends shaping the South Korea 3D Reconstruction Solutions Market include:
- Cloud-Based 3D Processing – Increasing deployment of cloud platforms for reconstruction reduces local hardware dependency and improves collaboration.
- AR/VR Integration – The incorporation of augmented and virtual reality increases visualization for use in medicine and engineering design.
- AI-Based Reconstruction – Learning machines have contributed to faster and more accurate 3D output models.
- Mobility in 3D Scanners – Increased deployment of portable scanners makes reconstruction possible in situ for the construction industry and engineering inspections.
Investment Opportunities in the South Korea 3D Reconstruction Solutions Market
Some potential areas of interest for investment in the South Korea 3D Reconstruction Solutions Market include:
- Machine Learning-based Software Development – Investing in reconstruction software using artificial intelligence for healthcare and industrial sectors.
- Industrial 3D Services Expansion – Providing 3D reconstruction services on a turnkey basis to SMEs.
- Medical Imaging Applications – Incorporating special reconstruction technology for use in medical imaging.
- Integration with AR/VR-based Reconstruction Software – Creating technologies which involve 3D reconstruction in conjunction with augmented and virtual reality visualization.
Top 5 Leading Players in the South Korea 3D Reconstruction Solutions Market
Key participants driving growth in the South Korea 3D Reconstruction Solutions Market include:
1. Autodesk Inc.
| Company Name | Autodesk Inc. |
|---|---|
| Established Year | 1982 |
| Headquarters | San Rafael, USA |
| Official Website | Click Here |
Autodesk provides professional 3D reconstruction and modeling software widely used in industrial, architectural, and medical applications for precise visualization and planning.
2. Siemens AG
| Company Name | Siemens AG |
|---|---|
| Established Year | 1847 |
| Headquarters | Munich, Germany |
| Official Website | Click Here |
Siemens develops advanced 3D reconstruction solutions integrated with industrial automation and medical imaging platforms, supporting precision engineering projects.
3. Trimble Inc.
| Company Name | Trimble Inc. |
|---|---|
| Established Year | 1978 |
| Headquarters | Sunnyvale, USA |
| Official Website | Click Here |
Trimble offers 3D reconstruction software and hardware systems for surveying, construction, and urban planning applications, enabling high-accuracy digital models.
4. Dassault Systèmes
| Company Name | Dassault Systèmes |
|---|---|
| Established Year | 1981 |
| Headquarters | Vélizy-Villacoublay, France |
| Official Website | Click Here |
Dassault Systèmes provides 3D reconstruction solutions for healthcare and engineering, enhancing simulation, visualization, and workflow efficiency.
5. Materialise NV
| Company Name | Materialise NV |
|---|---|
| Established Year | 1990 |
| Headquarters | Leuven, Belgium |
| Official Website | Click Here |
Materialise delivers software solutions for 3D reconstruction, particularly for medical and industrial design, enabling accurate modeling and planning.
Government Initiatives Being Implemented in the South Korea 3D Reconstruction Solutions Market
According to South Korean Government Data, major initiatives are supporting the adoption of advanced 3D reconstruction technologies:
- Digital New Deal Program (2021) - Financial aid and tax breaks for implementing smart factories and technologies related to advanced medical imaging techniques.
- Smart Medical Imaging Initiative (2022) - Subsidies for hospitals that adopt technology related to 3D reconstructions of diagnostic medical imaging and surgeries.
- AI Innovation Program for Manufacturing and Urban Infrastructure Development (2023) - Financial aid and tax breaks for implementing advanced AI systems.
Future Insights of the South Korea 3D Reconstruction Solutions Market
The prospects of the South Korea 3D Reconstruction Solutions Industry are bright because rising digitization in industries, alongside artificial intelligence (AI), augmented reality (AR), virtual reality (VR), and other smart manufacturing initiatives, are contributing greatly to the adoption rates. Rising applications in medical imagery, construction, and manufacturing will further improve the adoption of software solutions in South Korea.
Market Segmentation Analysis
The report offers a comprehensive study of the subsequent market segments and their leading categories:
By Component
According to Tanya, Senior Research Analyst, 6Wresearch, Software holds the largest South Korea 3D reconstruction solutions market share due to widespread deployment in industrial design, healthcare imaging, and construction modeling, offering scalability, AI integration, and precise digital workflows. Software segment projected CAGR: 8.5% (2026–2032).
Note: Market size estimations and growth projections presented in this report are based on 6Wresearch’s advanced forecasting approach, validated with industry datasets as of June 2026.
Key Attractiveness of the Report
- 10 Years of Market Numbers.
- Historical Data Starting from 2022 to 2025.
- Base Year: 2025.
- Forecast Data until 2032.
- Key Performance Indicators Impacting the Market.
- Major Upcoming Developments and Projects.
Key Highlights of the Report:
- South Korea 3D Reconstruction Solutions Market Outlook
- Market Size of South Korea 3D Reconstruction Solutions Market, 2025
- Forecast of South Korea 3D Reconstruction Solutions Market, 2032
- Historical Data and Forecast of South Korea 3D Reconstruction Solutions Revenues & Volume for the Period 2022-2032
- South Korea 3D Reconstruction Solutions Market Trend Evolution
- South Korea 3D Reconstruction Solutions Market Drivers and Challenges
- South Korea 3D Reconstruction Solutions Price Trends
- South Korea 3D Reconstruction Solutions Porter's Five Forces
- South Korea 3D Reconstruction Solutions Industry Life Cycle
- Historical Data and Forecast of South Korea 3D Reconstruction Solutions Market Revenues & Volume By Component for the Period 2022-2032
- Historical Data and Forecast of South Korea 3D Reconstruction Solutions Market Revenues & Volume By Software for the Period 2022-2032
- Historical Data and Forecast of South Korea 3D Reconstruction Solutions Market Revenues & Volume By Services for the Period 2022-2032
- Historical Data and Forecast of South Korea 3D Reconstruction Solutions Market Revenues & Volume By Type for the Period 2022-2032
- Historical Data and Forecast of South Korea 3D Reconstruction Solutions Market Revenues & Volume By Active 3D Reconstruction for the Period 2022-2032
- Historical Data and Forecast of South Korea 3D Reconstruction Solutions Market Revenues & Volume By Passive 3D Reconstruction for the Period 2022-2032
- South Korea 3D Reconstruction Solutions Import Export Trade Statistics
- Market Opportunity Assessment By Component
- Market Opportunity Assessment By Type
- South Korea 3D Reconstruction Solutions Top Companies Market Share
- South Korea 3D Reconstruction Solutions Competitive Benchmarking By Technical and Operational Parameters
- South Korea 3D Reconstruction Solutions Company Profiles
- South Korea 3D Reconstruction Solutions Key Strategic Recommendations
Market Covered
The report offers a comprehensive study of the subsequent market segments:
By Component
- Software
- Services
By Type
- Active 3D Reconstruction
- Passive 3D Reconstruction
South Korea 3D Reconstruction Solutions Market (2026-2032): FAQs
South Korea 3D Reconstruction Solutions Market is projected to grow at a CAGR of 1.6% between 2026-2032.
Rising use in industrial automation, healthcare imaging, and government-backed digitalization programs are key growth drivers.
Autodesk, Siemens, Trimble, Dassault Systèmes, Materialise are the market leaders.
High software costs, limited technical expertise, and infrastructure requirements restrict
6Wresearch actively monitors the South Korea 3D Reconstruction Solutions Market and publishes its comprehensive annual report, highlighting emerging trends, growth drivers, revenue analysis, and forecast outlook. Our insights help businesses to make data-backed strategic decisions with ongoing market dynamics. Our analysts track relevent industries related to the South Korea 3D Reconstruction Solutions Market, allowing our clients with actionable intelligence and reliable forecasts tailored to emerging regional needs.
Yes, we provide customisation as per your requirements. To learn more, feel free to contact us on sales@6wresearch.com
| 1 Executive Summary |
| 2 Introduction |
| 2.1 Key Highlights of the Report |
| 2.2 Report Description |
| 2.3 Market Scope & Segmentation |
| 2.4 Research Methodology |
| 2.5 Assumptions |
| 3 South Korea 3D Reconstruction Solutions Market Overview |
| 3.1 South Korea Country Macro Economic Indicators |
| 3.2 South Korea 3D Reconstruction Solutions Market Revenues & Volume, 2022 & 2032F |
| 3.3 South Korea 3D Reconstruction Solutions Market - Industry Life Cycle |
| 3.4 South Korea 3D Reconstruction Solutions Market - Porter's Five Forces |
| 3.5 South Korea 3D Reconstruction Solutions Market Revenues & Volume Share, By Component, 2022 & 2032F |
| 3.6 South Korea 3D Reconstruction Solutions Market Revenues & Volume Share, By Type, 2022 & 2032F |
| 4 South Korea 3D Reconstruction Solutions Market Dynamics |
| 4.1 Impact Analysis |
| 4.2 Market Drivers |
| 4.2.1 Increasing demand for high-quality 3D models in industries like construction, entertainment, and healthcare |
| 4.2.2 Technological advancements in 3D scanning and modeling software |
| 4.2.3 Growing adoption of 3D reconstruction solutions in urban planning and infrastructure development |
| 4.3 Market Restraints |
| 4.3.1 High initial investment and ongoing maintenance costs associated with 3D reconstruction solutions |
| 4.3.2 Lack of skilled professionals proficient in 3D modeling and reconstruction |
| 4.3.3 Data privacy and security concerns related to capturing and processing sensitive information for 3D reconstruction |
| 5 South Korea 3D Reconstruction Solutions Market Trends |
| 6 South Korea 3D Reconstruction Solutions Market, By Types |
| 6.1 South Korea 3D Reconstruction Solutions Market, By Component |
| 6.1.1 Overview and Analysis |
| 6.1.2 South Korea 3D Reconstruction Solutions Market Revenues & Volume, By Component, 2022-2032F |
| 6.1.3 South Korea 3D Reconstruction Solutions Market Revenues & Volume, By Software, 2022-2032F |
| 6.1.4 South Korea 3D Reconstruction Solutions Market Revenues & Volume, By Services, 2022-2032F |
| 6.2 South Korea 3D Reconstruction Solutions Market, By Type |
| 6.2.1 Overview and Analysis |
| 6.2.2 South Korea 3D Reconstruction Solutions Market Revenues & Volume, By Active 3D Reconstruction, 2022-2032F |
| 6.2.3 South Korea 3D Reconstruction Solutions Market Revenues & Volume, By Passive 3D Reconstruction, 2022-2032F |
| 7 South Korea 3D Reconstruction Solutions Market Import-Export Trade Statistics |
| 7.1 South Korea 3D Reconstruction Solutions Market Export to Major Countries |
| 7.2 South Korea 3D Reconstruction Solutions Market Imports from Major Countries |
| 8 South Korea 3D Reconstruction Solutions Market Key Performance Indicators |
| 8.1 Average project completion time using 3D reconstruction solutions |
| 8.2 Percentage increase in the number of companies adopting 3D reconstruction technology |
| 8.3 Improvement in accuracy and precision of 3D models generated |
| 8.4 Rate of successful integration of 3D reconstruction solutions in various industries |
| 8.5 Number of research and development initiatives focused on enhancing 3D reconstruction technologies |
| 9 South Korea 3D Reconstruction Solutions Market - Opportunity Assessment |
| 9.1 South Korea 3D Reconstruction Solutions Market Opportunity Assessment, By Component, 2022 & 2032F |
| 9.2 South Korea 3D Reconstruction Solutions Market Opportunity Assessment, By Type, 2022 & 2032F |
| 10 South Korea 3D Reconstruction Solutions Market - Competitive Landscape |
| 10.1 South Korea 3D Reconstruction Solutions Market Revenue Share, By Companies, 2025 |
| 10.2 South Korea 3D Reconstruction Solutions Market Competitive Benchmarking, By Operating and Technical Parameters |
| 11 Company Profiles |
| 12 Recommendations |
| 13 Disclaimer |
Global Go To Market Strategy - 2030
Export potential enables firms to identify high-growth global markets with greater confidence by combining advanced trade intelligence with a structured quantitative methodology. The framework analyzes emerging demand trends and country-level import patterns while integrating macroeconomic and trade datasets such as GDP and population forecasts, bilateral import–export flows, tariff structures, elasticity differentials between developed and developing economies, geographic distance, and import demand projections. Using weighted trade values from 2020–2024 as the base period to project country-to-country export potential for 2030, these inputs are operationalized through calculated drivers such as gravity model parameters, tariff impact factors, and projected GDP per-capita growth. Through an analysis of hidden potentials, demand hotspots, and market conditions that are most favorable to success, this method enables firms to focus on target countries, maximize returns, and global expansion with data, backed by accuracy.
By factoring in the projected importer demand gap that is currently unmet and could be potential opportunity, it identifies the potential for the Exporter (Country) among 190 countries, against the general trade analysis, which identifies the biggest importer or exporter.
To discover high-growth global markets and optimize your business strategy:
Click Here
Pricing
- Single User License$ 1,995
- Department License$ 2,400
- Site License$ 3,120
- Global License$ 3,795

Leadership Perspectives from Industry Events
Search
Thought Leadership and Analyst Meet


Our Clients
6WResearch In News
- India Export Attractiveness Tracker 2026
- India Air Conditioner Market Set for Strong Rebound in 2026 After Weather-Led Correction and GST-Driven Recovery: 6Wresearch
- ADAS in India: How Automatic Emergency Braking, Blind Spot Detection & Driver Monitoring are Transforming Road Safety
- Doha a strategic location for EV manufacturing hub: IPA Qatar
- Demand for luxury TVs surging in the GCC, says Samsung
- Empowering Growth: The Thriving Journey of Bangladesh’s Cable Industry
Latest Reports
- Nicaragua RPG Gaming Market (2026-2032)
- New Zealand RPG Gaming Market (2026-2032)
- Netherlands RPG Gaming Market (2026-2032)
- Nauru RPG Gaming Market (2026-2032)
- Namibia RPG Gaming Market (2026-2032)
- Mozambique RPG Gaming Market (2026-2032)
- Montenegro RPG Gaming Market (2026-2032)
- Mongolia RPG Gaming Market (2026-2032)
- Monaco RPG Gaming Market (2026-2032)
- Micronesia RPG Gaming Market (2026-2032)
Industry Events and Analyst Meet

EV India Expo 2026

HIMTEX 2026

India Refining Summit 2026

India EV Show 2026

EV tech India Expo 2026
Whitepaper
- Middle East & Africa Commercial Security Market Click here to view more.
- Middle East & Africa Fire Safety Systems & Equipment Market Click here to view more.
- GCC Drone Market Click here to view more.
- Middle East Lighting Fixture Market Click here to view more.
- GCC Physical & Perimeter Security Market Click here to view more.