Spain Captive Power Plant Market (2026-2032) | Size & Revenue, Forecast, Companies, Segmentation, Analysis, Trends, Competitive Landscape, Outlook, Share, Value, Growth, Industry
Market Forecast By Fuel Source (Coal, Gas, Diesel, Renewable, Other Fuel Sources), By Industry (Cement, Steel, Metal & Minerals, Petrochemicals) And Competitive Landscape
| Product Code: ETC9442597 | Publication Date: Sep 2024 | Updated Date: Apr 2026 | Product Type: Market Research Report | |
| Publisher: 6Wresearch | Author: Sumit Sagar | No. of Pages: 75 | No. of Figures: 35 | No. of Tables: 20 |
Spain Captive Power Plant Market Size (2020-2030)
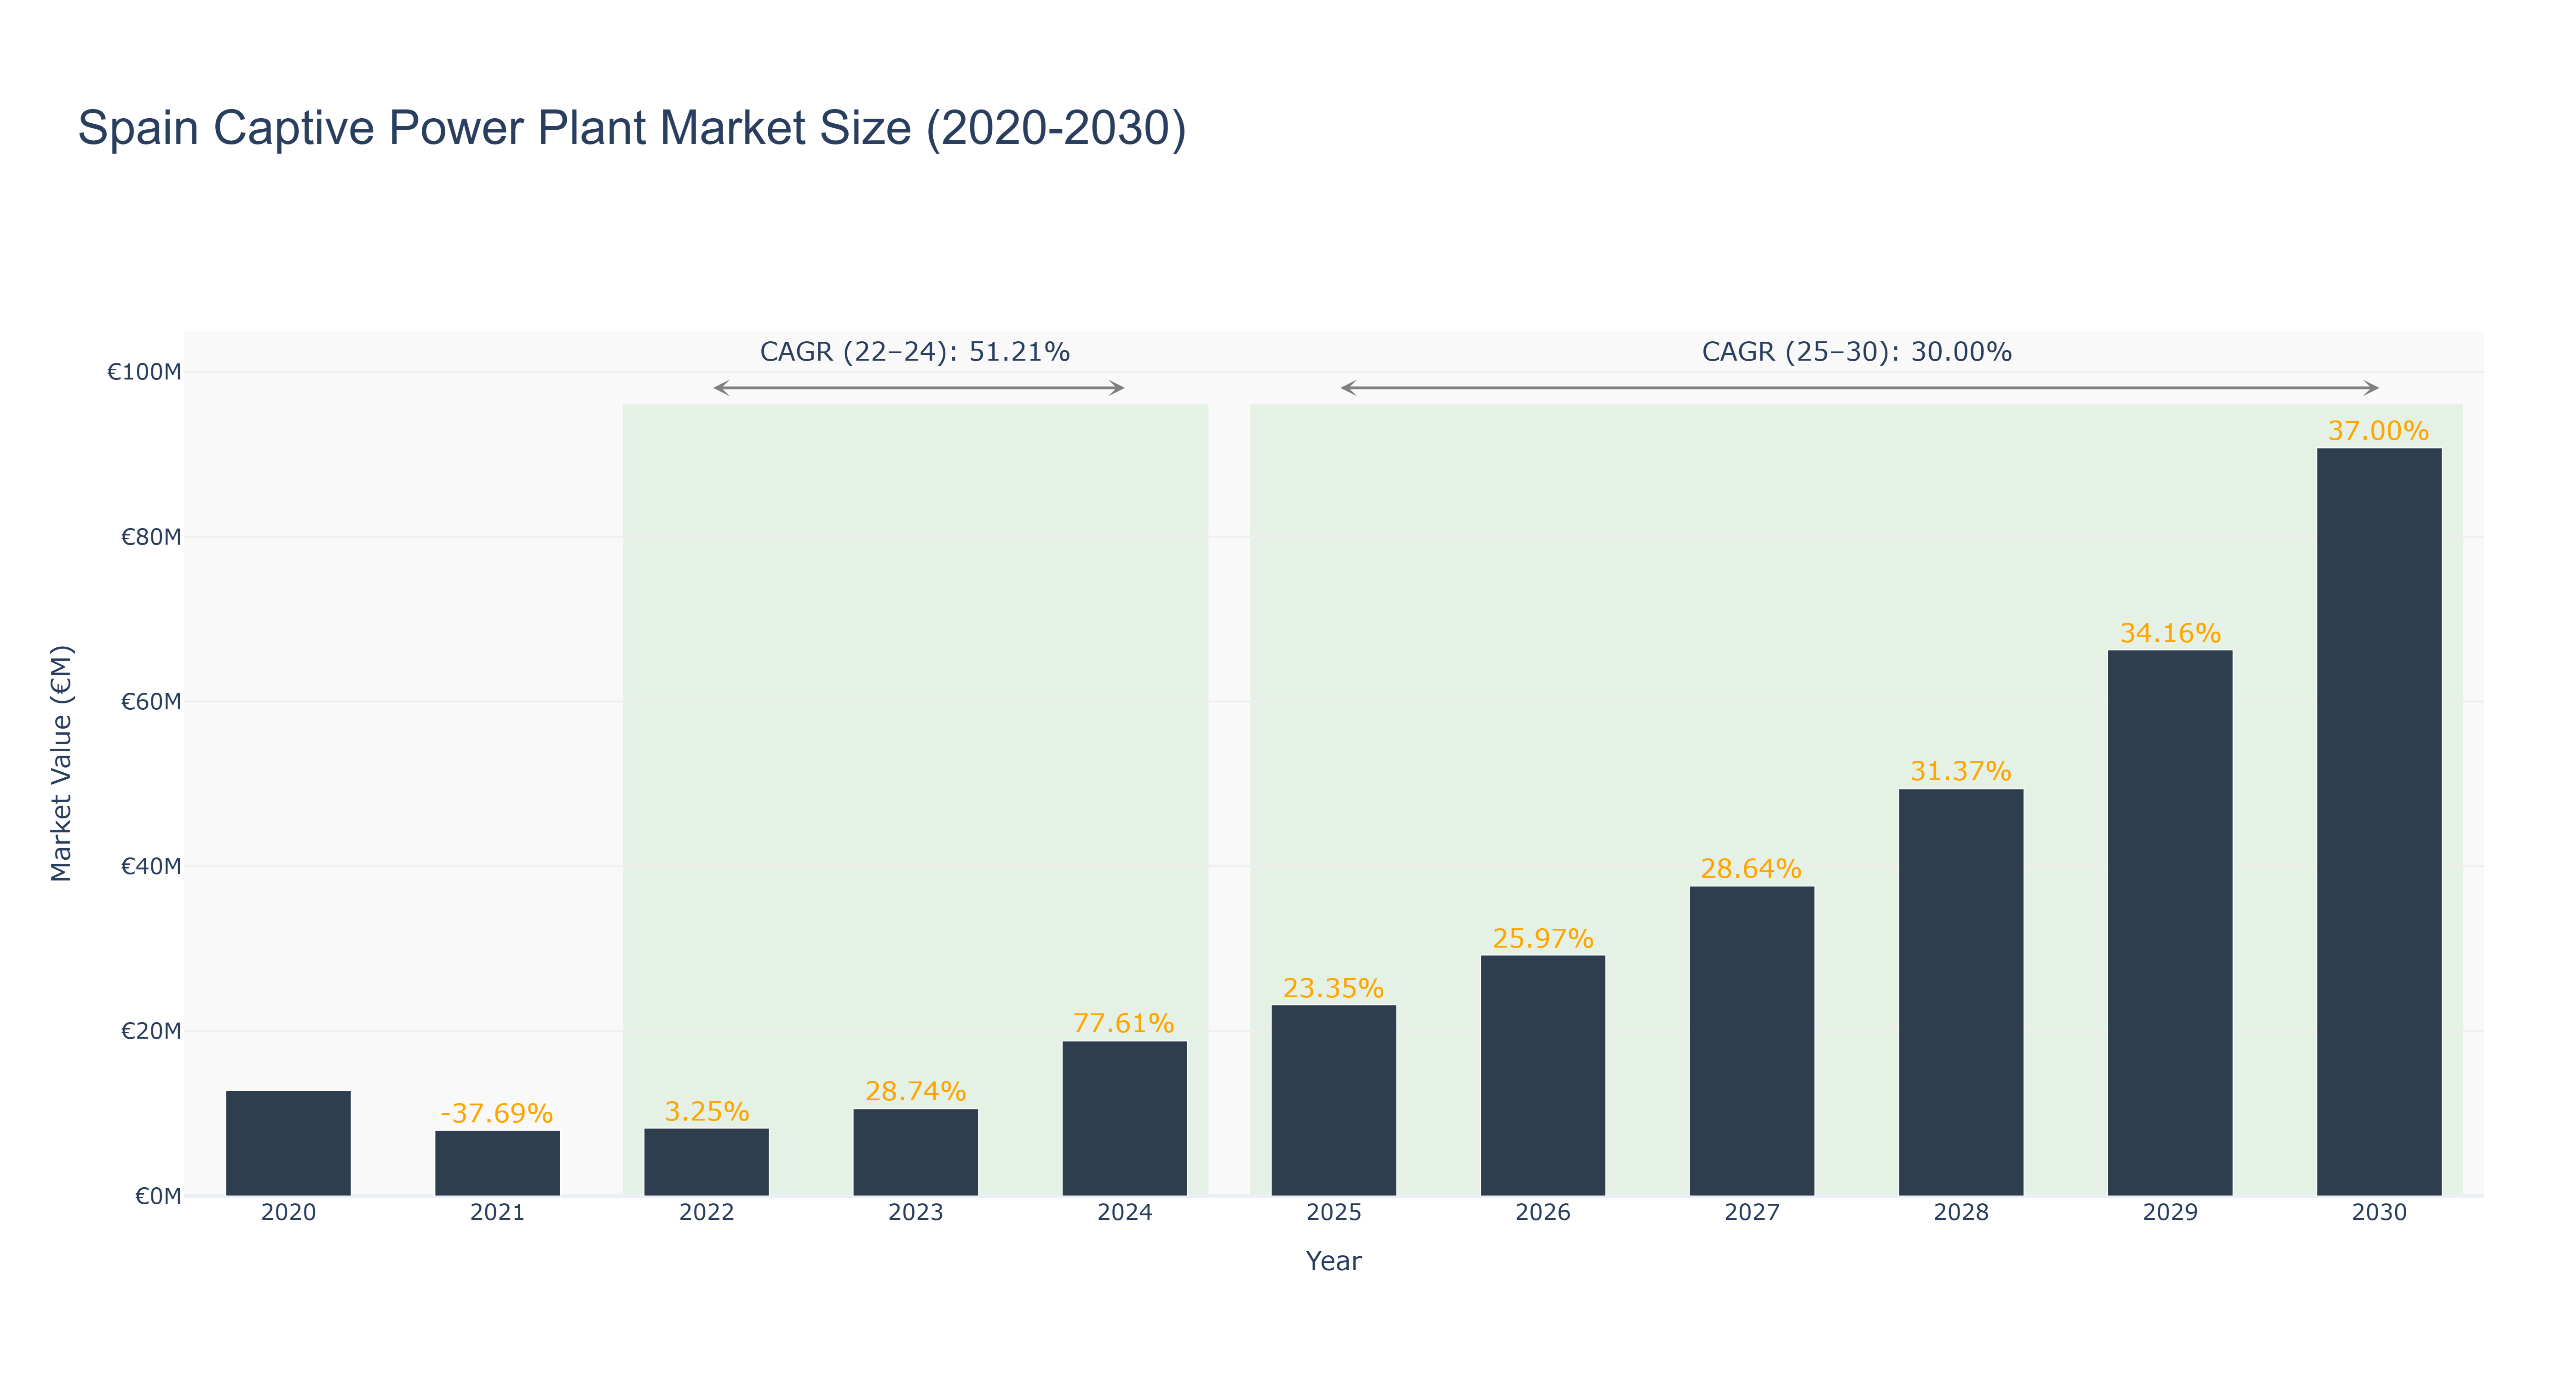
The Spain Captive Power Plant Market experienced significant fluctuations from 2020 to 2024, peaking at €12.79 million in 2020 before declining to €7.97 million in 2021, a drop of 37.69%. However, the market rebounded, reaching €10.59 million in 2023, and is projected to surge further to €18.81 million in 2024, reflecting a remarkable CAGR of 51.21% during the actual period. Looking forward, the market is anticipated to continue its robust growth trajectory, with forecasted values reaching €23.20 million in 2025 and €90.79 million by 2030, representing a CAGR of 30.00%. This upward momentum can be attributed to increasing energy demands, favorable regulatory frameworks promoting renewable energy, and investments in infrastructure. As Spain moves towards sustainability and energy independence, upcoming projects in renewable energy will likely further propel market expansion, positioning it as a critical component of the national energy strategy.
Spain Captive Power Plant Market: Production & Trade Performance (2019-2025)
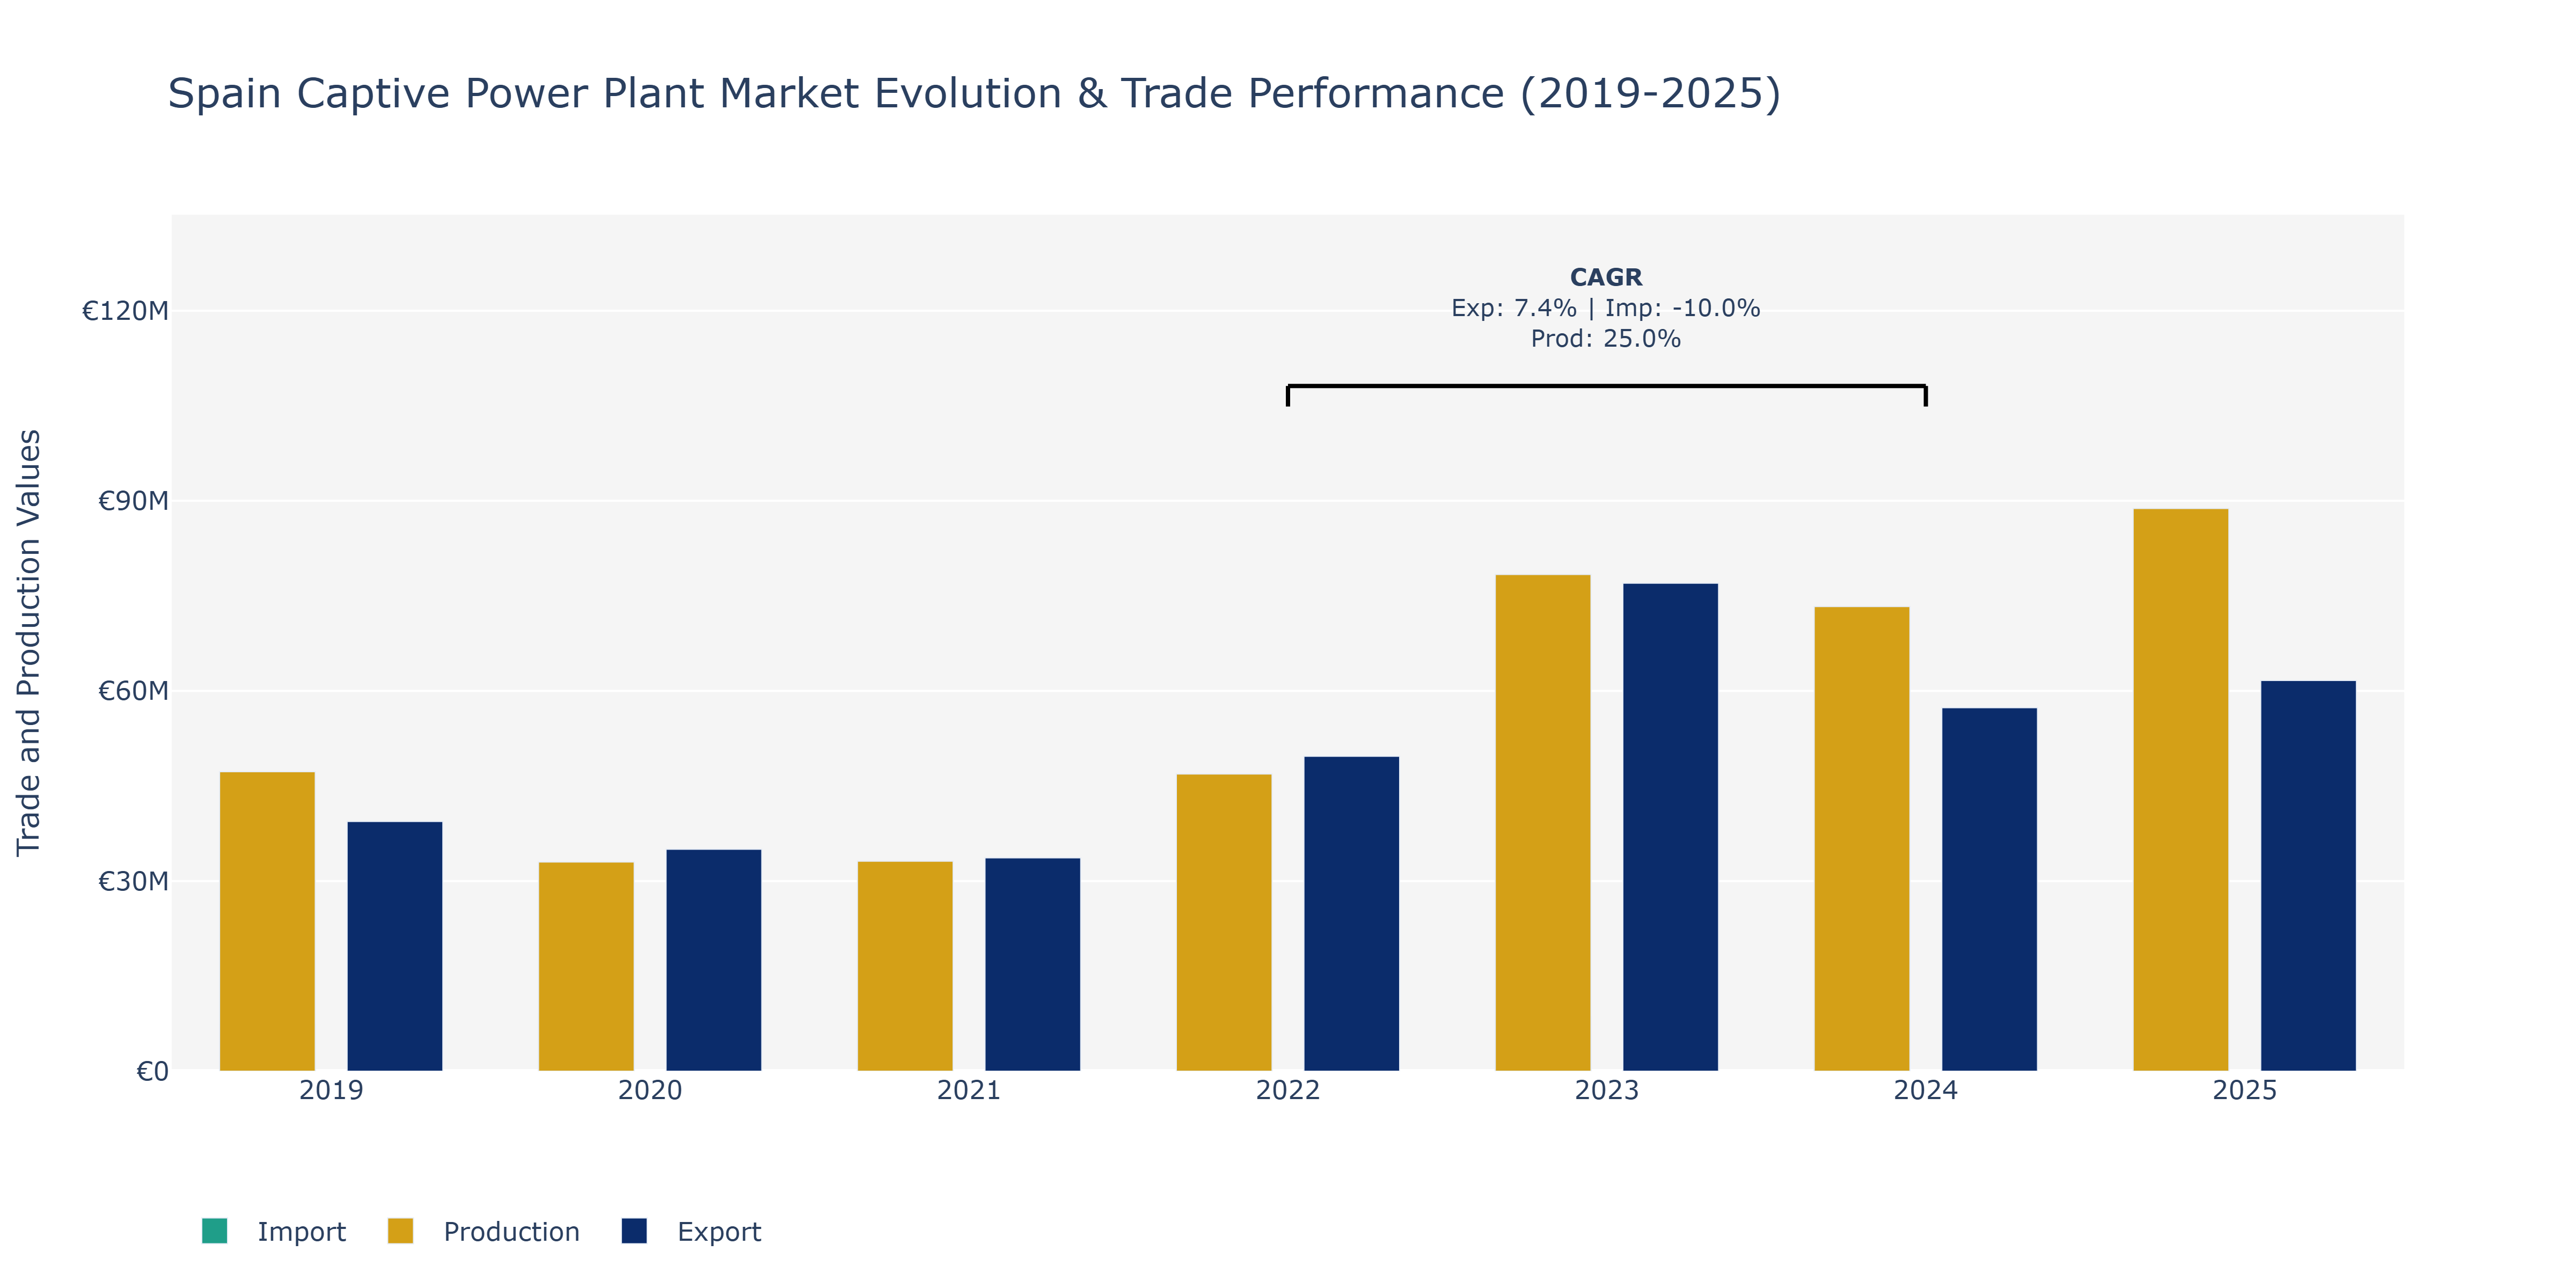
The Spain Captive Power Plant Market showed distinct dynamics in exports, imports, and production from 2019 to 2025. Exports experienced a notable fluctuation, starting at €39.4 million in 2019, dropping to €33.67 million in 2021, rising sharply to €77.0 million in 2023, and then slightly decreasing to €61.64 million in 2025. This fluctuation could be attributed to global energy demand shifts impacting export volumes and economic conditions affecting trade partnerships. Imports followed a more stable trend, with a slight decline from €7.3 million in 2019 to €6.27 million in 2021, before rising to €8.29 million in 2024. Production, showcasing significant growth, increased from €47.26 million in 2019 to €88.79 million in 2025. This surge aligns with the market's emphasis on renewable energy sources, driving investments in power plant infrastructure. The market's focus on enhancing energy efficiency and sustainability likely influenced the upward production trajectory, reflecting broader industry trends towards cleaner energy solutions.
Key Highlights of the Report:
- Spain Captive Power Plant Market Outlook
- Market Size of Spain Captive Power Plant Market, 2025
- Forecast of Spain Captive Power Plant Market, 2032
- Historical Data and Forecast of Spain Captive Power Plant Revenues & Volume for the Period 2022-2032F
- Spain Captive Power Plant Market Trend Evolution
- Spain Captive Power Plant Market Drivers and Challenges
- Spain Captive Power Plant Price Trends
- Spain Captive Power Plant Porter's Five Forces
- Spain Captive Power Plant Industry Life Cycle
- Historical Data and Forecast of Spain Captive Power Plant Market Revenues & Volume By Fuel Source for the Period 2022-2032F
- Historical Data and Forecast of Spain Captive Power Plant Market Revenues & Volume By Coal for the Period 2022-2032F
- Historical Data and Forecast of Spain Captive Power Plant Market Revenues & Volume By Gas for the Period 2022-2032F
- Historical Data and Forecast of Spain Captive Power Plant Market Revenues & Volume By Diesel for the Period 2022-2032F
- Historical Data and Forecast of Spain Captive Power Plant Market Revenues & Volume By Renewable for the Period 2022-2032F
- Historical Data and Forecast of Spain Captive Power Plant Market Revenues & Volume By Other Fuel Sources for the Period 2022-2032F
- Historical Data and Forecast of Spain Captive Power Plant Market Revenues & Volume By Industry for the Period 2022-2032F
- Historical Data and Forecast of Spain Captive Power Plant Market Revenues & Volume By Cement for the Period 2022-2032F
- Historical Data and Forecast of Spain Captive Power Plant Market Revenues & Volume By Steel for the Period 2022-2032F
- Historical Data and Forecast of Spain Captive Power Plant Market Revenues & Volume By Metal & Minerals for the Period 2022-2032F
- Historical Data and Forecast of Spain Captive Power Plant Market Revenues & Volume By Petrochemicals for the Period 2022-2032F
- Spain Captive Power Plant Import Export Trade Statistics
- Market Opportunity Assessment By Fuel Source
- Market Opportunity Assessment By Industry
- Spain Captive Power Plant Top Companies Market Share
- Spain Captive Power Plant Competitive Benchmarking By Technical and Operational Parameters
- Spain Captive Power Plant Company Profiles
- Spain Captive Power Plant Key Strategic Recommendations
Frequently Asked Questions About the Market Study (FAQs):
6Wresearch actively monitors the Spain Captive Power Plant Market and publishes its comprehensive annual report, highlighting emerging trends, growth drivers, revenue analysis, and forecast outlook. Our insights help businesses to make data-backed strategic decisions with ongoing market dynamics. Our analysts track relevent industries related to the Spain Captive Power Plant Market, allowing our clients with actionable intelligence and reliable forecasts tailored to emerging regional needs.
Yes, we provide customisation as per your requirements. To learn more, feel free to contact us on sales@6wresearch.com
1 Executive Summary |
2 Introduction |
2.1 Key Highlights of the Report |
2.2 Report Description |
2.3 Market Scope & Segmentation |
2.4 Research Methodology |
2.5 Assumptions |
3 Spain Captive Power Plant Market Overview |
3.1 Spain Country Macro Economic Indicators |
3.2 Spain Captive Power Plant Market Revenues & Volume, 2022 & 2032F |
3.3 Spain Captive Power Plant Market - Industry Life Cycle |
3.4 Spain Captive Power Plant Market - Porter's Five Forces |
3.5 Spain Captive Power Plant Market Revenues & Volume Share, By Fuel Source, 2022 & 2032F |
3.6 Spain Captive Power Plant Market Revenues & Volume Share, By Industry, 2022 & 2032F |
4 Spain Captive Power Plant Market Dynamics |
4.1 Impact Analysis |
4.2 Market Drivers |
4.2.1 Growing demand for reliable and uninterrupted power supply |
4.2.2 Increasing focus on energy efficiency and sustainability |
4.2.3 Rising industrialization and urbanization in Spain |
4.3 Market Restraints |
4.3.1 High initial investment and operational costs |
4.3.2 Regulatory challenges and compliance requirements |
4.3.3 Competition from traditional power sources |
5 Spain Captive Power Plant Market Trends |
6 Spain Captive Power Plant Market, By Types |
6.1 Spain Captive Power Plant Market, By Fuel Source |
6.1.1 Overview and Analysis |
6.1.2 Spain Captive Power Plant Market Revenues & Volume, By Fuel Source, 2022-2032F |
6.1.3 Spain Captive Power Plant Market Revenues & Volume, By Coal, 2022-2032F |
6.1.4 Spain Captive Power Plant Market Revenues & Volume, By Gas, 2022-2032F |
6.1.5 Spain Captive Power Plant Market Revenues & Volume, By Diesel, 2022-2032F |
6.1.6 Spain Captive Power Plant Market Revenues & Volume, By Renewable, 2022-2032F |
6.1.7 Spain Captive Power Plant Market Revenues & Volume, By Other Fuel Sources, 2022-2032F |
6.2 Spain Captive Power Plant Market, By Industry |
6.2.1 Overview and Analysis |
6.2.2 Spain Captive Power Plant Market Revenues & Volume, By Cement, 2022-2032F |
6.2.3 Spain Captive Power Plant Market Revenues & Volume, By Steel, 2022-2032F |
6.2.4 Spain Captive Power Plant Market Revenues & Volume, By Metal & Minerals, 2022-2032F |
6.2.5 Spain Captive Power Plant Market Revenues & Volume, By Petrochemicals, 2022-2032F |
7 Spain Captive Power Plant Market Import-Export Trade Statistics |
7.1 Spain Captive Power Plant Market Export to Major Countries |
7.2 Spain Captive Power Plant Market Imports from Major Countries |
8 Spain Captive Power Plant Market Key Performance Indicators |
8.1 Percentage of renewable energy sources in captive power plants |
8.2 Average downtime of captive power plants |
8.3 Energy efficiency improvement rate of captive power plants |
8.4 Adoption rate of advanced technologies in captive power generation |
8.5 Number of new installations and expansions in the captive power plant market |
9 Spain Captive Power Plant Market - Opportunity Assessment |
9.1 Spain Captive Power Plant Market Opportunity Assessment, By Fuel Source, 2022 & 2032F |
9.2 Spain Captive Power Plant Market Opportunity Assessment, By Industry, 2022 & 2032F |
10 Spain Captive Power Plant Market - Competitive Landscape |
10.1 Spain Captive Power Plant Market Revenue Share, By Companies, 2025 |
10.2 Spain Captive Power Plant Market Competitive Benchmarking, By Operating and Technical Parameters |
11 Company Profiles |
12 Recommendations |
13 Disclaimer |
Global Go To Market Strategy - 2030
Export potential enables firms to identify high-growth global markets with greater confidence by combining advanced trade intelligence with a structured quantitative methodology. The framework analyzes emerging demand trends and country-level import patterns while integrating macroeconomic and trade datasets such as GDP and population forecasts, bilateral import–export flows, tariff structures, elasticity differentials between developed and developing economies, geographic distance, and import demand projections. Using weighted trade values from 2020–2024 as the base period to project country-to-country export potential for 2030, these inputs are operationalized through calculated drivers such as gravity model parameters, tariff impact factors, and projected GDP per-capita growth. Through an analysis of hidden potentials, demand hotspots, and market conditions that are most favorable to success, this method enables firms to focus on target countries, maximize returns, and global expansion with data, backed by accuracy.
By factoring in the projected importer demand gap that is currently unmet and could be potential opportunity, it identifies the potential for the Exporter (Country) among 190 countries, against the general trade analysis, which identifies the biggest importer or exporter.
To discover high-growth global markets and optimize your business strategy:
Click Here
Pricing
- Single User License$ 1,995
- Department License$ 2,400
- Site License$ 3,120
- Global License$ 3,795

Leadership Perspectives from Industry Events
Search
Thought Leadership and Analyst Meet


Our Clients
6WResearch In News
- India Export Attractiveness Tracker 2026
- India Air Conditioner Market Set for Strong Rebound in 2026 After Weather-Led Correction and GST-Driven Recovery: 6Wresearch
- ADAS in India: How Automatic Emergency Braking, Blind Spot Detection & Driver Monitoring are Transforming Road Safety
- Doha a strategic location for EV manufacturing hub: IPA Qatar
- Demand for luxury TVs surging in the GCC, says Samsung
- Empowering Growth: The Thriving Journey of Bangladesh’s Cable Industry
Latest Reports
- Qatar Access and Home Network Market (2026-2032)
- Nicaragua RPG Gaming Market (2026-2032)
- New Zealand RPG Gaming Market (2026-2032)
- Netherlands RPG Gaming Market (2026-2032)
- Nauru RPG Gaming Market (2026-2032)
- Namibia RPG Gaming Market (2026-2032)
- Mozambique RPG Gaming Market (2026-2032)
- Montenegro RPG Gaming Market (2026-2032)
- Mongolia RPG Gaming Market (2026-2032)
- Monaco RPG Gaming Market (2026-2032)
Industry Events and Analyst Meet

EV India Expo 2026

HIMTEX 2026

India Refining Summit 2026

India EV Show 2026

EV tech India Expo 2026
Whitepaper
- Middle East & Africa Commercial Security Market Click here to view more.
- Middle East & Africa Fire Safety Systems & Equipment Market Click here to view more.
- GCC Drone Market Click here to view more.
- Middle East Lighting Fixture Market Click here to view more.
- GCC Physical & Perimeter Security Market Click here to view more.