Spain Ceramic And Natural Stone Tiles Market (2026-2032) | Share, Analysis, Growth, Segmentation, Value, Companies, Trends, Competitive Landscape, Outlook, Forecast, Industry, Size & Revenue
Market Forecast By Product (Glazed ceramic tiles, Porcelain tiles, Scratch free ceramic tiles, Granite tiles, Limestone tiles, Travertine tiles, Others) And Competitive Landscape
| Product Code: ETC9443007 | Publication Date: Sep 2024 | Updated Date: Apr 2026 | Product Type: Market Research Report | |
| Publisher: 6Wresearch | Author: Sumit Sagar | No. of Pages: 75 | No. of Figures: 35 | No. of Tables: 20 |
Spain Ceramic And Natural Stone Tiles Market Size (2020-2030)
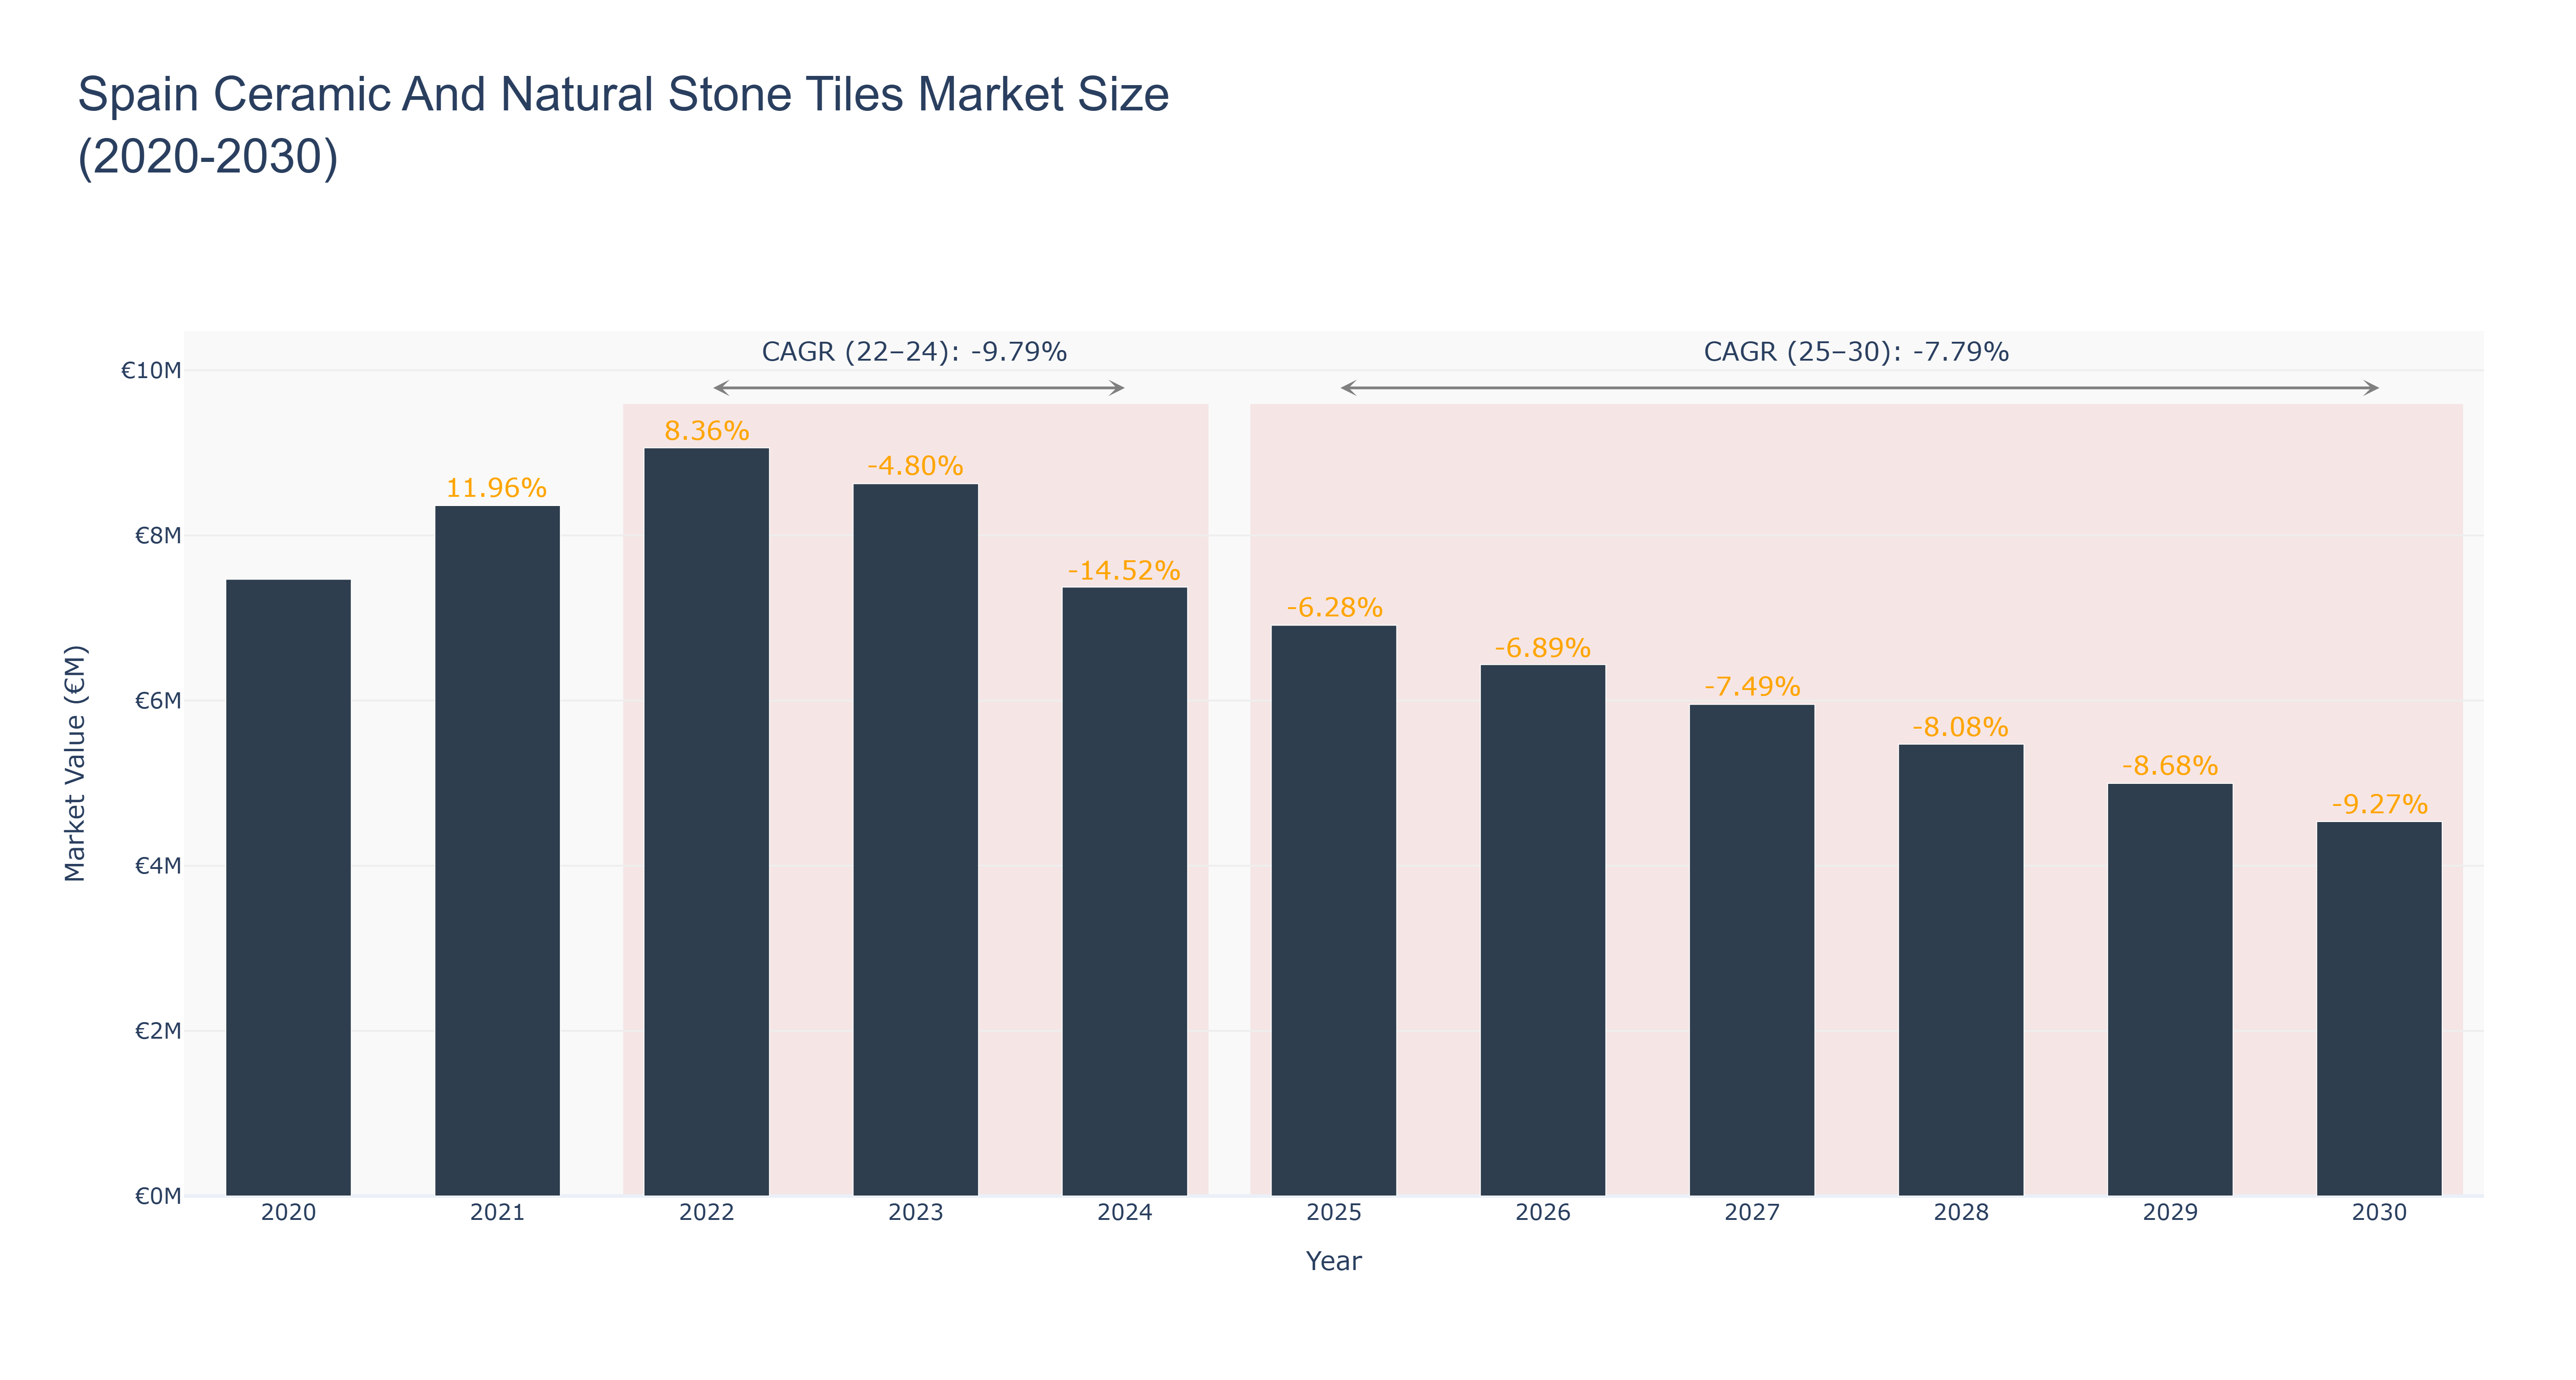
The Spain Ceramic And Natural Stone Tiles Market experienced a peak market size of €9.06 million in 2022, followed by a downward trend in subsequent years. The actual market size declined steadily from €8.63 million in 2023 to €4.53 million in 2030. The CAGR for the period 2022-24 was -9.79%, reflecting a significant contraction, while the CAGR for 2025-30 is projected to be -7.79%. The market faced challenges due to economic slowdowns impacting construction projects and reduced consumer spending on home renovations. Looking ahead, recent developments in sustainable tile manufacturing processes are expected to drive market recovery, along with upcoming infrastructure projects integrating ceramic and natural stone tiles for eco-friendly building solutions. As the market shifts towards sustainability and innovation, these developments are poised to reshape the industry landscape positively.
Spain Ceramic And Natural Stone Tiles Market: Production & Trade Performance (2019-2025)
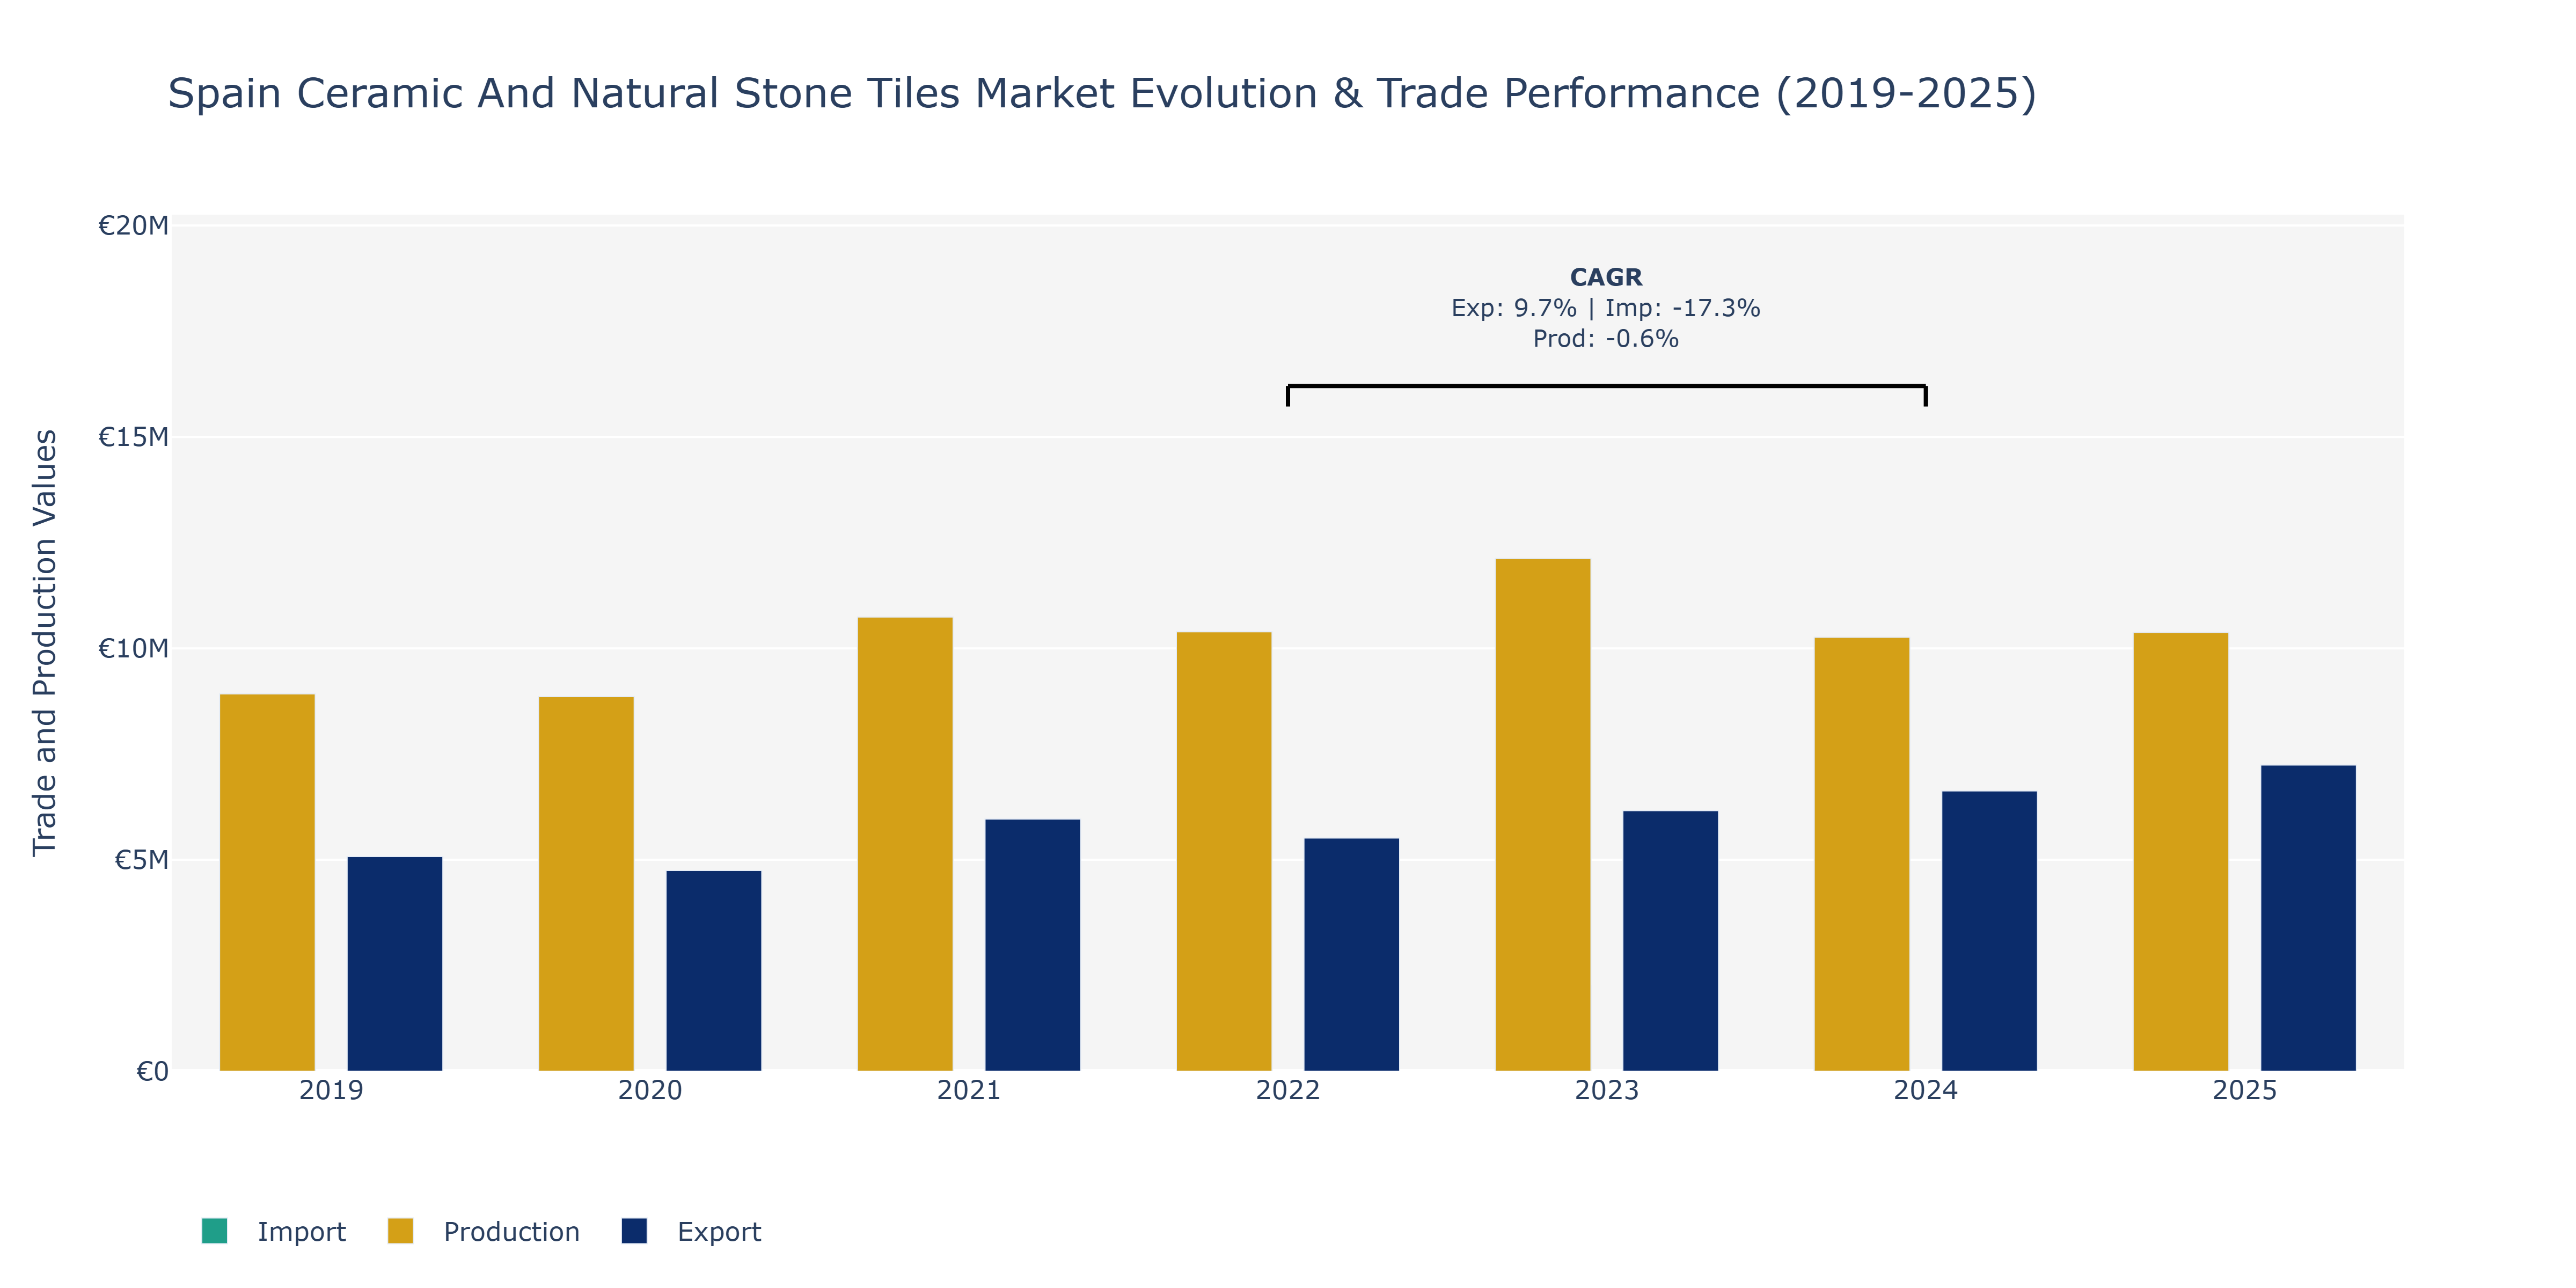
Between 2019 and 2025, the Spain Ceramic And Natural Stone Tiles Market exhibited varying trends in Exports, Imports, and Production. Exports saw a general upward trajectory, reaching €7.24 million in 2025 from €5.08 million in 2019, peaking in 2025. This growth can be attributed to the increasing global demand for high-quality ceramic and natural stone tiles, with Spain known for its innovative designs and superior product quality. In contrast, Imports fluctuated, hitting a low of €1.99 million in 2025 after a peak of €3.73 million in 2021. The decline in Imports could be linked to shifting trade dynamics, supply chain disruptions, or increased domestic production capacity. Production remained relatively stable, hovering around €10.3 million, experiencing a slight decrease in 2024 before rebounding in 2025. The minor dip in Production might be due to market saturation or operational challenges faced by manufacturers. To sustain growth, industry players could focus on enhancing product diversification, investing in advanced manufacturing technologies, and expanding into emerging markets to capitalize on the sector's growth potential.
Key Highlights of the Report:
- Spain Ceramic And Natural Stone Tiles Market Outlook
- Market Size of Spain Ceramic And Natural Stone Tiles Market, 2025
- Forecast of Spain Ceramic And Natural Stone Tiles Market, 2032
- Historical Data and Forecast of Spain Ceramic And Natural Stone Tiles Revenues & Volume for the Period 2022-2032F
- Spain Ceramic And Natural Stone Tiles Market Trend Evolution
- Spain Ceramic And Natural Stone Tiles Market Drivers and Challenges
- Spain Ceramic And Natural Stone Tiles Price Trends
- Spain Ceramic And Natural Stone Tiles Porter's Five Forces
- Spain Ceramic And Natural Stone Tiles Industry Life Cycle
- Historical Data and Forecast of Spain Ceramic And Natural Stone Tiles Market Revenues & Volume By Product for the Period 2022-2032F
- Historical Data and Forecast of Spain Ceramic And Natural Stone Tiles Market Revenues & Volume By Glazed ceramic tiles for the Period 2022-2032F
- Historical Data and Forecast of Spain Ceramic And Natural Stone Tiles Market Revenues & Volume By Porcelain tiles for the Period 2022-2032F
- Historical Data and Forecast of Spain Ceramic And Natural Stone Tiles Market Revenues & Volume By Scratch free ceramic tiles for the Period 2022-2032F
- Historical Data and Forecast of Spain Ceramic And Natural Stone Tiles Market Revenues & Volume By Granite tiles for the Period 2022-2032F
- Historical Data and Forecast of Spain Ceramic And Natural Stone Tiles Market Revenues & Volume By Limestone tiles for the Period 2022-2032F
- Historical Data and Forecast of Spain Ceramic And Natural Stone Tiles Market Revenues & Volume By Travertine tiles for the Period 2022-2032F
- Historical Data and Forecast of Spain Ceramic And Natural Stone Tiles Market Revenues & Volume By Others for the Period 2022-2032F
- Spain Ceramic And Natural Stone Tiles Import Export Trade Statistics
- Market Opportunity Assessment By Product
- Spain Ceramic And Natural Stone Tiles Top Companies Market Share
- Spain Ceramic And Natural Stone Tiles Competitive Benchmarking By Technical and Operational Parameters
- Spain Ceramic And Natural Stone Tiles Company Profiles
- Spain Ceramic And Natural Stone Tiles Key Strategic Recommendations
Frequently Asked Questions About the Market Study (FAQs):
6Wresearch actively monitors the Spain Ceramic And Natural Stone Tiles Market and publishes its comprehensive annual report, highlighting emerging trends, growth drivers, revenue analysis, and forecast outlook. Our insights help businesses to make data-backed strategic decisions with ongoing market dynamics. Our analysts track relevent industries related to the Spain Ceramic And Natural Stone Tiles Market, allowing our clients with actionable intelligence and reliable forecasts tailored to emerging regional needs.
Yes, we provide customisation as per your requirements. To learn more, feel free to contact us on sales@6wresearch.com
1 Executive Summary |
2 Introduction |
2.1 Key Highlights of the Report |
2.2 Report Description |
2.3 Market Scope & Segmentation |
2.4 Research Methodology |
2.5 Assumptions |
3 Spain Ceramic And Natural Stone Tiles Market Overview |
3.1 Spain Country Macro Economic Indicators |
3.2 Spain Ceramic And Natural Stone Tiles Market Revenues & Volume, 2022 & 2032F |
3.3 Spain Ceramic And Natural Stone Tiles Market - Industry Life Cycle |
3.4 Spain Ceramic And Natural Stone Tiles Market - Porter's Five Forces |
3.5 Spain Ceramic And Natural Stone Tiles Market Revenues & Volume Share, By Product, 2022 & 2032F |
4 Spain Ceramic And Natural Stone Tiles Market Dynamics |
4.1 Impact Analysis |
4.2 Market Drivers |
4.2.1 Growing demand for aesthetically pleasing and durable flooring solutions |
4.2.2 Increasing focus on sustainable and eco-friendly building materials |
4.2.3 Rise in construction activities in residential and commercial sectors |
4.3 Market Restraints |
4.3.1 Fluctuating raw material costs impacting profit margins |
4.3.2 Intense competition from alternative flooring materials |
4.3.3 Economic uncertainties affecting consumer spending on home improvement projects |
5 Spain Ceramic And Natural Stone Tiles Market Trends |
6 Spain Ceramic And Natural Stone Tiles Market, By Types |
6.1 Spain Ceramic And Natural Stone Tiles Market, By Product |
6.1.1 Overview and Analysis |
6.1.2 Spain Ceramic And Natural Stone Tiles Market Revenues & Volume, By Product, 2022-2032F |
6.1.3 Spain Ceramic And Natural Stone Tiles Market Revenues & Volume, By Glazed ceramic tiles, 2022-2032F |
6.1.4 Spain Ceramic And Natural Stone Tiles Market Revenues & Volume, By Porcelain tiles, 2022-2032F |
6.1.5 Spain Ceramic And Natural Stone Tiles Market Revenues & Volume, By Scratch free ceramic tiles, 2022-2032F |
6.1.6 Spain Ceramic And Natural Stone Tiles Market Revenues & Volume, By Granite tiles, 2022-2032F |
6.1.7 Spain Ceramic And Natural Stone Tiles Market Revenues & Volume, By Limestone tiles, 2022-2032F |
6.1.8 Spain Ceramic And Natural Stone Tiles Market Revenues & Volume, By Travertine tiles, 2022-2032F |
7 Spain Ceramic And Natural Stone Tiles Market Import-Export Trade Statistics |
7.1 Spain Ceramic And Natural Stone Tiles Market Export to Major Countries |
7.2 Spain Ceramic And Natural Stone Tiles Market Imports from Major Countries |
8 Spain Ceramic And Natural Stone Tiles Market Key Performance Indicators |
8.1 Average selling price per square meter of ceramic and natural stone tiles |
8.2 Number of new construction projects incorporating ceramic and natural stone tiles |
8.3 Percentage of market share held by eco-friendly and sustainable tile manufacturers |
8.4 Rate of innovation in tile designs and technology adoption |
9 Spain Ceramic And Natural Stone Tiles Market - Opportunity Assessment |
9.1 Spain Ceramic And Natural Stone Tiles Market Opportunity Assessment, By Product, 2022 & 2032F |
10 Spain Ceramic And Natural Stone Tiles Market - Competitive Landscape |
10.1 Spain Ceramic And Natural Stone Tiles Market Revenue Share, By Companies, 2025 |
10.2 Spain Ceramic And Natural Stone Tiles Market Competitive Benchmarking, By Operating and Technical Parameters |
11 Company Profiles |
12 Recommendations |
13 Disclaimer |
Global Go To Market Strategy - 2030
Export potential enables firms to identify high-growth global markets with greater confidence by combining advanced trade intelligence with a structured quantitative methodology. The framework analyzes emerging demand trends and country-level import patterns while integrating macroeconomic and trade datasets such as GDP and population forecasts, bilateral import–export flows, tariff structures, elasticity differentials between developed and developing economies, geographic distance, and import demand projections. Using weighted trade values from 2020–2024 as the base period to project country-to-country export potential for 2030, these inputs are operationalized through calculated drivers such as gravity model parameters, tariff impact factors, and projected GDP per-capita growth. Through an analysis of hidden potentials, demand hotspots, and market conditions that are most favorable to success, this method enables firms to focus on target countries, maximize returns, and global expansion with data, backed by accuracy.
By factoring in the projected importer demand gap that is currently unmet and could be potential opportunity, it identifies the potential for the Exporter (Country) among 190 countries, against the general trade analysis, which identifies the biggest importer or exporter.
To discover high-growth global markets and optimize your business strategy:
Click Here
Pricing
- Single User License$ 1,995
- Department License$ 2,400
- Site License$ 3,120
- Global License$ 3,795

Leadership Perspectives from Industry Events
Search
Thought Leadership and Analyst Meet


Our Clients
6WResearch In News
- India Export Attractiveness Tracker 2026
- India Air Conditioner Market Set for Strong Rebound in 2026 After Weather-Led Correction and GST-Driven Recovery: 6Wresearch
- ADAS in India: How Automatic Emergency Braking, Blind Spot Detection & Driver Monitoring are Transforming Road Safety
- Doha a strategic location for EV manufacturing hub: IPA Qatar
- Demand for luxury TVs surging in the GCC, says Samsung
- Empowering Growth: The Thriving Journey of Bangladesh’s Cable Industry
Latest Reports
- Qatar Access and Home Network Market (2026-2032)
- Nicaragua RPG Gaming Market (2026-2032)
- New Zealand RPG Gaming Market (2026-2032)
- Netherlands RPG Gaming Market (2026-2032)
- Nauru RPG Gaming Market (2026-2032)
- Namibia RPG Gaming Market (2026-2032)
- Mozambique RPG Gaming Market (2026-2032)
- Montenegro RPG Gaming Market (2026-2032)
- Mongolia RPG Gaming Market (2026-2032)
- Monaco RPG Gaming Market (2026-2032)
Industry Events and Analyst Meet

EV India Expo 2026

HIMTEX 2026

India Refining Summit 2026

India EV Show 2026

EV tech India Expo 2026
Whitepaper
- Middle East & Africa Commercial Security Market Click here to view more.
- Middle East & Africa Fire Safety Systems & Equipment Market Click here to view more.
- GCC Drone Market Click here to view more.
- Middle East Lighting Fixture Market Click here to view more.
- GCC Physical & Perimeter Security Market Click here to view more.