Spain Honey Market (2020-2026) | COVID-19 IMPACT, Size, Industry, Outlook, Companies, Trends, Revenue, Growth, Analysis, Forecast, Share & Value
Market Forecast By Type (Alfalfa Honey, Wildflower Honey, Buckwheat Honey, Acacia Honey, Clover Honey, Others), By Applications (Food and Beverage, Personal Care Products, Pharmaceuticals, Others), By Packaging (Bottle, Jar, Tube, Tub, Others) And Competitive Landscape
| Product Code: ETC015694 | Publication Date: Jun 2023 | Updated Date: Feb 2026 | Product Type: Report | |
| Publisher: 6Wresearch | Author: Ravi Bhandari | No. of Pages: 70 | No. of Figures: 35 | No. of Tables: 5 |
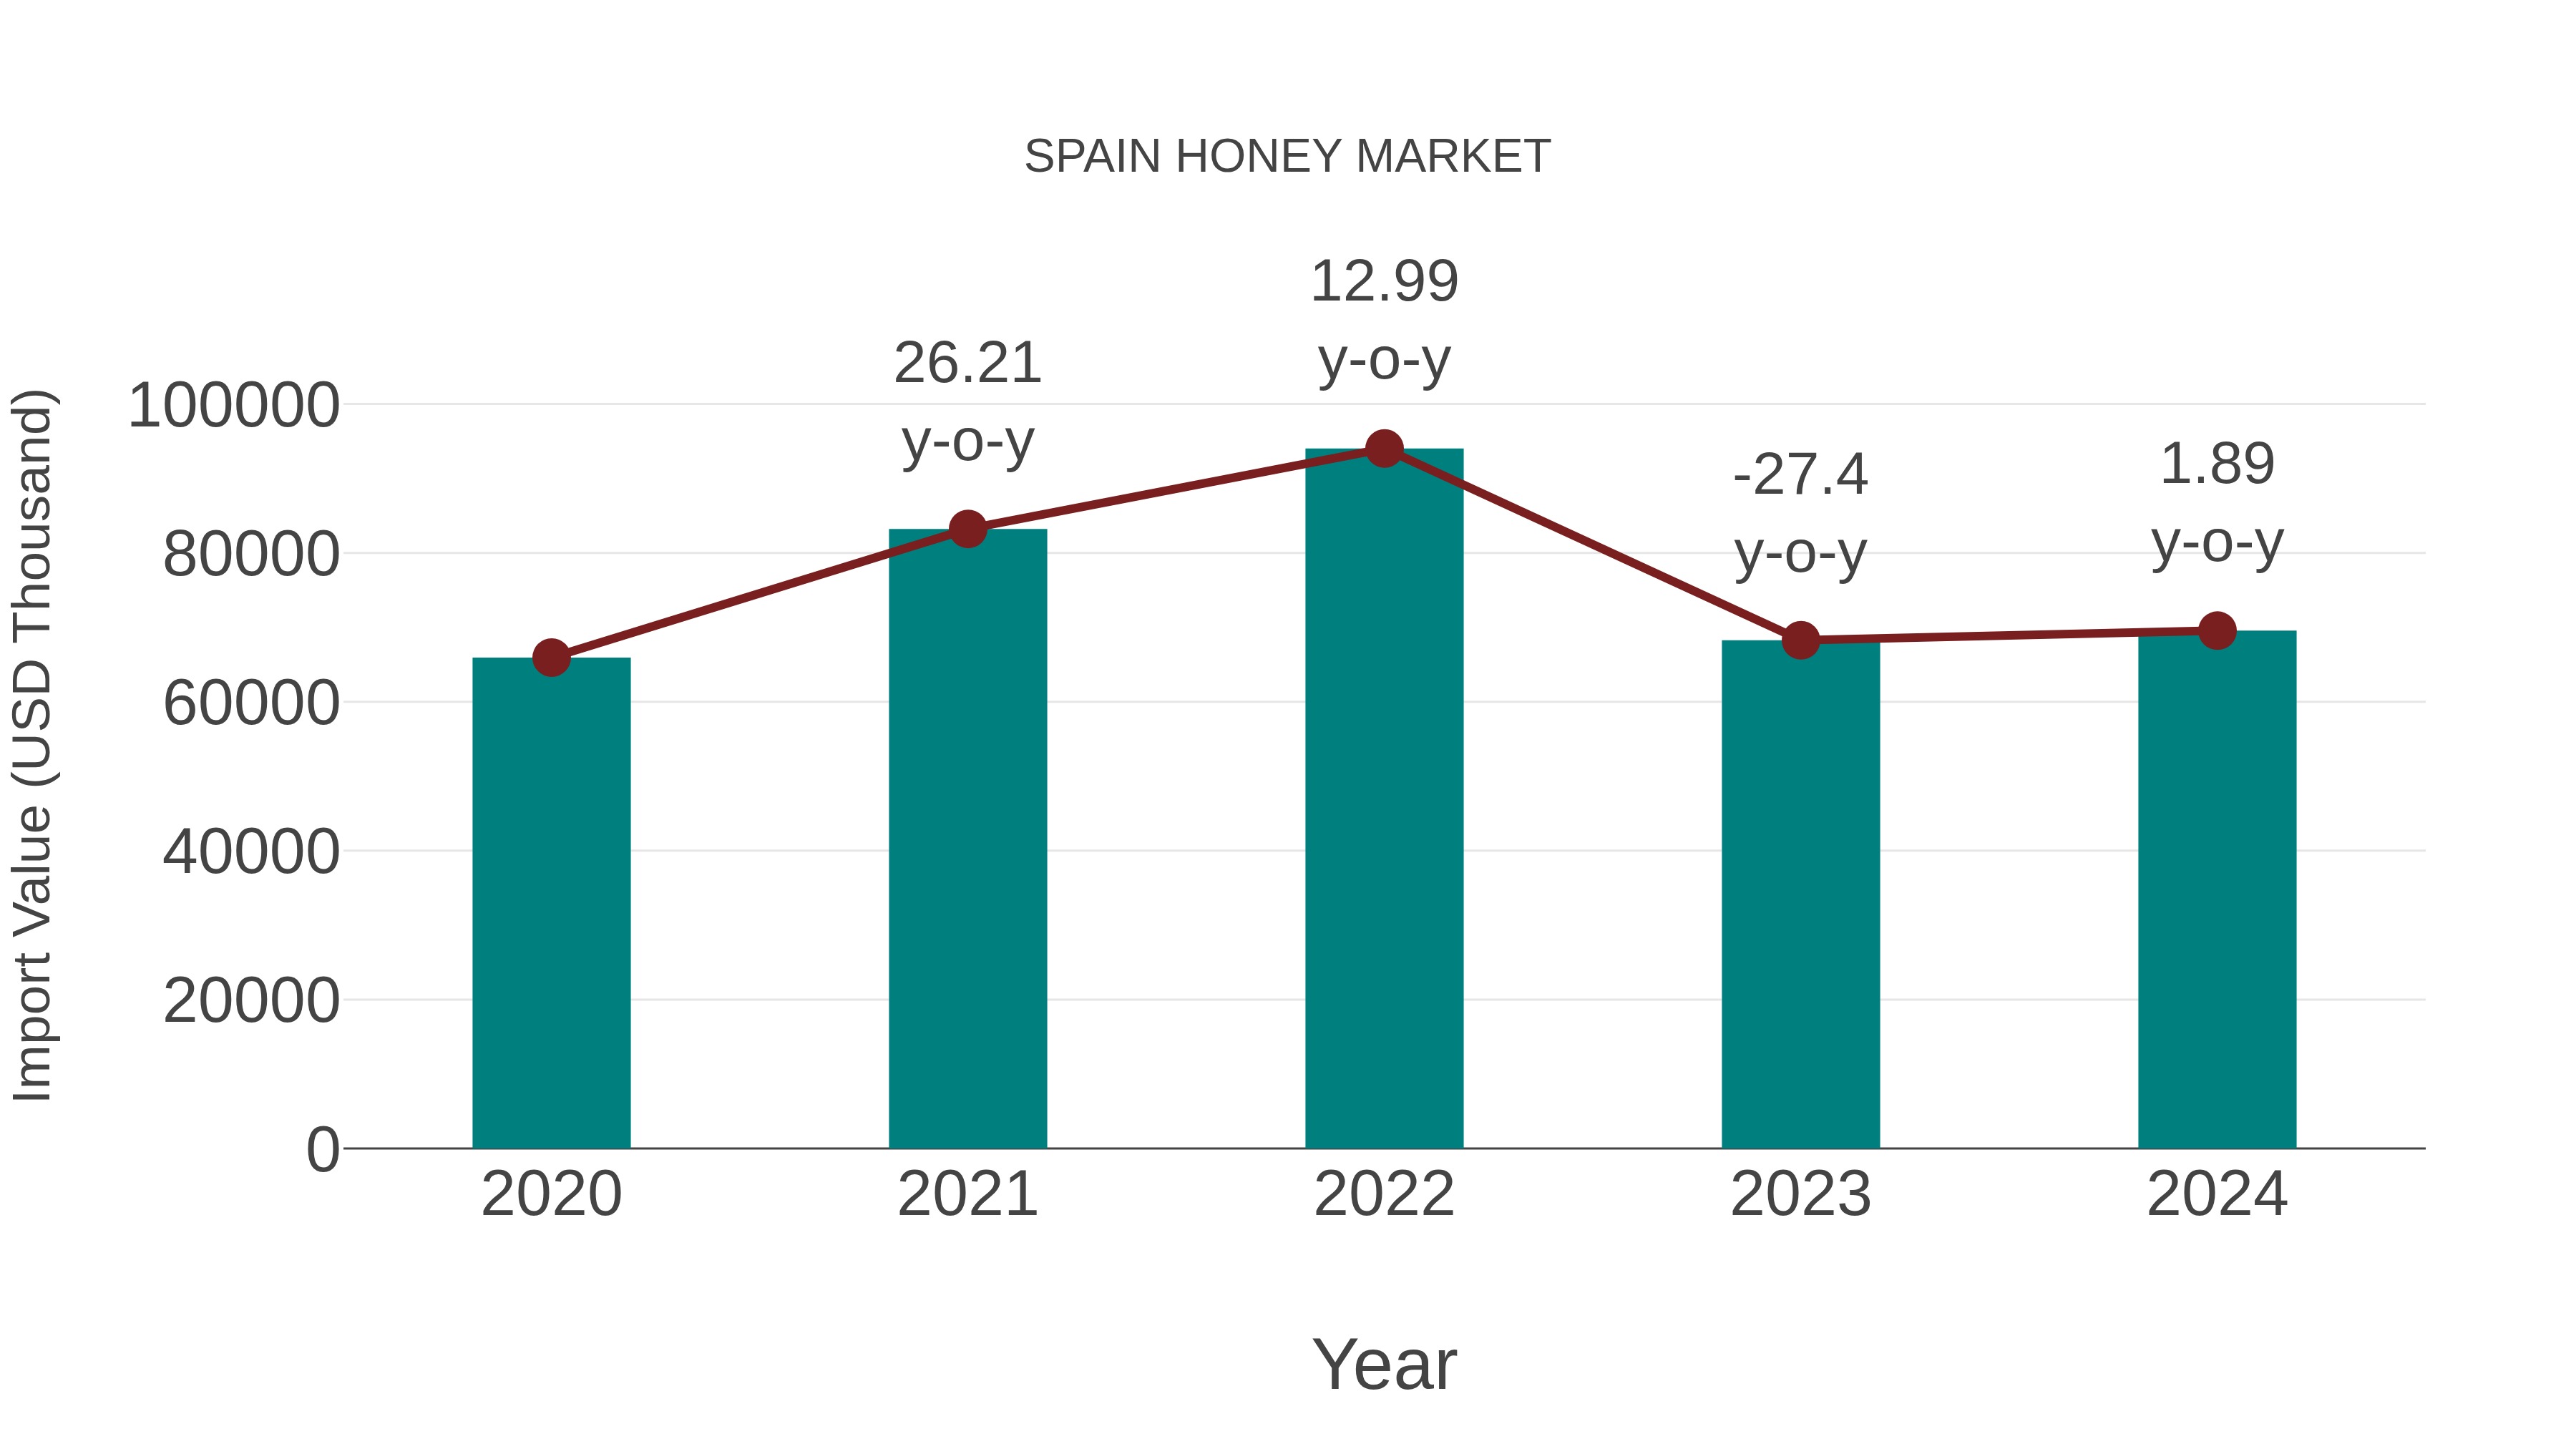
Spain Honey Market: Import Trend Analysis
In 2024, Spain`s honey market saw a consistent increase in imports. This trend was driven by rising consumer demand for a diverse range of honey products. The import data reflected a growing preference for imported honey varieties among Spanish consumers.
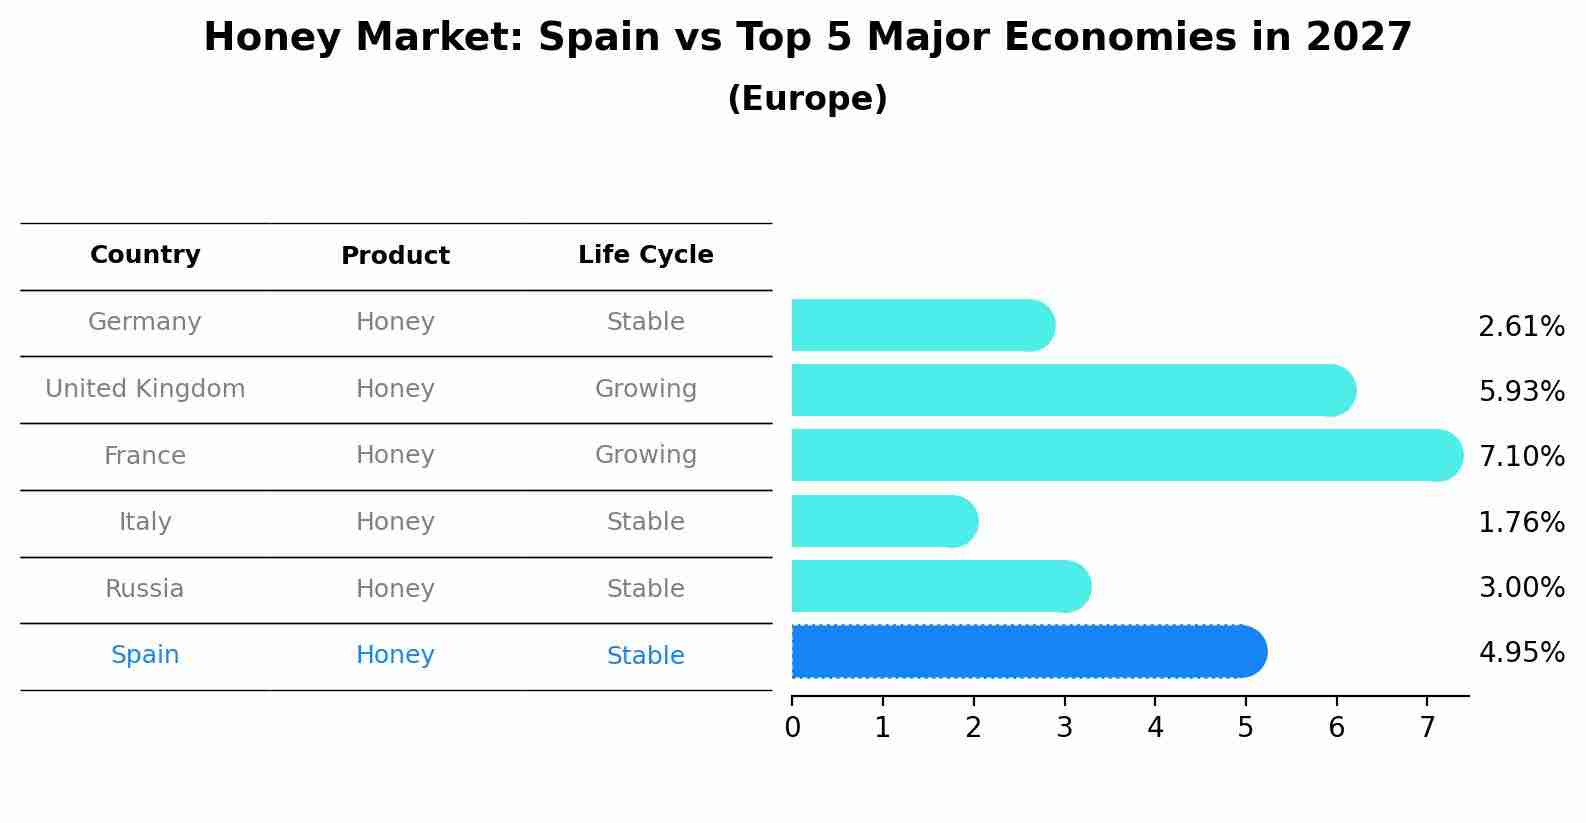
Honey Market: Spain vs Top 5 Major Economies in 2027 (Europe)
By 2027, Spain's Honey market is forecasted to achieve a stable growth rate of 4.95%, with Germany leading the Europe region, followed by United Kingdom, France, Italy and Russia.
The honey market in Spain is expected to grow at a CAGR of 5.1% during the forecast period 2020?2026. Factors such as increasing consumer demand for organic and natural food products, rising health consciousness among people, growing number of beekeepers across the country, and high availability of various types of honey are driving the growth of the Spanish honey market. Moreover, government support for local producers and technological advancements have further contributed to its growth.
In addition, initiatives taken by the European Union (EU) towards ensuring sustainability in agricultural practices has resulted in increased production levels, providing an impetus to the Spanish honey market growth over recent years. Furthermore, growing awareness regarding therapeutic benefits associated with regular consumption of honey is also expected to drive its demand over coming years. However, fluctuating prices due to seasonal changes may restrain growth prospects over next few years.
Key Highlights of the Report:
- Spain Honey Market Outlook
- Market Size of Spain Honey Market, 2019
- Forecast of Spain Honey Market, 2026
- Historical Data and Forecast of Spain Honey Revenues & Volume for the Period 2016 - 2026
- Spain Honey Market Trend Evolution
- Spain Honey Market Drivers and Challenges
- Spain Honey Price Trends
- Spain Honey Porter's Five Forces
- Spain Honey Industry Life Cycle
- Historical Data and Forecast of Spain Honey Market Revenues & Volume By Type for the Period 2016 - 2026
- Historical Data and Forecast of Spain Honey Market Revenues & Volume By Alfalfa Honey for the Period 2016 - 2026
- Historical Data and Forecast of Spain Honey Market Revenues & Volume By Wildflower Honey for the Period 2016 - 2026
- Historical Data and Forecast of Spain Honey Market Revenues & Volume By Buckwheat Honey for the Period 2016 - 2026
- Historical Data and Forecast of Spain Honey Market Revenues & Volume By Acacia Honey for the Period 2016 - 2026
- Historical Data and Forecast of Spain Honey Market Revenues & Volume By Clover Honey for the Period 2016 - 2026
- Historical Data and Forecast of Spain Honey Market Revenues & Volume By Others for the Period 2016 - 2026
- Historical Data and Forecast of Spain Honey Market Revenues & Volume By Applications for the Period 2016 - 2026
- Historical Data and Forecast of Spain Honey Market Revenues & Volume By Food and Beverage for the Period 2016 - 2026
- Historical Data and Forecast of Spain Honey Market Revenues & Volume By Personal Care Products for the Period 2016 - 2026
- Historical Data and Forecast of Spain Honey Market Revenues & Volume By Pharmaceuticals for the Period 2016 - 2026
- Historical Data and Forecast of Spain Honey Market Revenues & Volume By Others for the Period 2016 - 2026
- Historical Data and Forecast of Spain Honey Market Revenues & Volume By Packaging for the Period 2016 - 2026
- Historical Data and Forecast of Spain Honey Market Revenues & Volume By Bottle for the Period 2016 - 2026
- Historical Data and Forecast of Spain Honey Market Revenues & Volume By Jar for the Period 2016 - 2026
- Historical Data and Forecast of Spain Honey Market Revenues & Volume By Tube for the Period 2016 - 2026
- Historical Data and Forecast of Spain Honey Market Revenues & Volume By Tub for the Period 2016 - 2026
- Historical Data and Forecast of Spain Honey Market Revenues & Volume By Others for the Period 2016 - 2026
- Spain Honey Import Export Trade Statistics
- Market Opportunity Assessment By Type
- Market Opportunity Assessment By Applications
- Market Opportunity Assessment By Packaging
- Spain Honey Top Companies Market Share
- Spain Honey Competitive Benchmarking By Technical and Operational Parameters
- Spain Honey Company Profiles
- Spain Honey Key Strategic Recommendations
Frequently Asked Questions About the Market Study (FAQs):
6Wresearch actively monitors the Spain Honey Market and publishes its comprehensive annual report, highlighting emerging trends, growth drivers, revenue analysis, and forecast outlook. Our insights help businesses to make data-backed strategic decisions with ongoing market dynamics. Our analysts track relevent industries related to the Spain Honey Market, allowing our clients with actionable intelligence and reliable forecasts tailored to emerging regional needs.
Yes, we provide customisation as per your requirements. To learn more, feel free to contact us on sales@6wresearch.com
1 Executive Summary |
2 Introduction |
2.1 Key Highlights of the Report |
2.2 Report Description |
2.3 Market Scope & Segmentation |
2.4 Research Methodology |
2.5 Assumptions |
3 Spain Honey Market Overview |
3.1 Spain Country Macro Economic Indicators |
3.2 Spain Honey Market Revenues & Volume, 2019 & 2026F |
3.3 Spain Honey Market - Industry Life Cycle |
3.4 Spain Honey Market - Porter's Five Forces |
3.5 Spain Honey Market Revenues & Volume Share, By Type, 2019 & 2026F |
3.6 Spain Honey Market Revenues & Volume Share, By Applications, 2019 & 2026F |
3.7 Spain Honey Market Revenues & Volume Share, By Packaging, 2019 & 2026F |
4 Spain Honey Market Dynamics |
4.1 Impact Analysis |
4.2 Market Drivers |
4.2.1 Increasing consumer awareness about the health benefits of honey |
4.2.2 Growing demand for natural and organic food products |
4.2.3 Innovations in honey packaging and marketing strategies |
4.3 Market Restraints |
4.3.1 Fluctuations in honey production due to environmental factors |
4.3.2 Competition from substitute products like artificial sweeteners |
4.3.3 Stringent regulations and quality standards in the honey industry |
5 Spain Honey Market Trends |
6 Spain Honey Market, By Types |
6.1 Spain Honey Market, By Type |
6.1.1 Overview and Analysis |
6.1.2 Spain Honey Market Revenues & Volume, By Type, 2016 - 2026F |
6.1.3 Spain Honey Market Revenues & Volume, By Alfalfa Honey, 2016 - 2026F |
6.1.4 Spain Honey Market Revenues & Volume, By Wildflower Honey, 2016 - 2026F |
6.1.5 Spain Honey Market Revenues & Volume, By Buckwheat Honey, 2016 - 2026F |
6.1.6 Spain Honey Market Revenues & Volume, By Acacia Honey, 2016 - 2026F |
6.1.7 Spain Honey Market Revenues & Volume, By Clover Honey, 2016 - 2026F |
6.1.8 Spain Honey Market Revenues & Volume, By Others, 2016 - 2026F |
6.2 Spain Honey Market, By Applications |
6.2.1 Overview and Analysis |
6.2.2 Spain Honey Market Revenues & Volume, By Food and Beverage, 2016 - 2026F |
6.2.3 Spain Honey Market Revenues & Volume, By Personal Care Products, 2016 - 2026F |
6.2.4 Spain Honey Market Revenues & Volume, By Pharmaceuticals, 2016 - 2026F |
6.2.5 Spain Honey Market Revenues & Volume, By Others, 2016 - 2026F |
6.3 Spain Honey Market, By Packaging |
6.3.1 Overview and Analysis |
6.3.2 Spain Honey Market Revenues & Volume, By Bottle, 2016 - 2026F |
6.3.3 Spain Honey Market Revenues & Volume, By Jar, 2016 - 2026F |
6.3.4 Spain Honey Market Revenues & Volume, By Tube, 2016 - 2026F |
6.3.5 Spain Honey Market Revenues & Volume, By Tub, 2016 - 2026F |
6.3.6 Spain Honey Market Revenues & Volume, By Others, 2016 - 2026F |
7 Spain Honey Market Import-Export Trade Statistics |
7.1 Spain Honey Market Export to Major Countries |
7.2 Spain Honey Market Imports from Major Countries |
8 Spain Honey Market Key Performance Indicators |
8.1 Number of new honey product launches in the market |
8.2 Percentage growth in honey exports from Spain |
8.3 Consumer satisfaction and loyalty metrics for honey brands |
8.4 Adoption rate of honey in new market segments |
8.5 Investment in research and development for honey products |
9 Spain Honey Market - Opportunity Assessment |
9.1 Spain Honey Market Opportunity Assessment, By Type, 2019 & 2026F |
9.2 Spain Honey Market Opportunity Assessment, By Applications, 2019 & 2026F |
9.3 Spain Honey Market Opportunity Assessment, By Packaging, 2019 & 2026F |
10 Spain Honey Market - Competitive Landscape |
10.1 Spain Honey Market Revenue Share, By Companies, 2019 |
10.2 Spain Honey Market Competitive Benchmarking, By Operating and Technical Parameters |
11 Company Profiles |
12 Recommendations |
13 Disclaimer |
Global Go To Market Strategy - 2030
Export potential enables firms to identify high-growth global markets with greater confidence by combining advanced trade intelligence with a structured quantitative methodology. The framework analyzes emerging demand trends and country-level import patterns while integrating macroeconomic and trade datasets such as GDP and population forecasts, bilateral import–export flows, tariff structures, elasticity differentials between developed and developing economies, geographic distance, and import demand projections. Using weighted trade values from 2020–2024 as the base period to project country-to-country export potential for 2030, these inputs are operationalized through calculated drivers such as gravity model parameters, tariff impact factors, and projected GDP per-capita growth. Through an analysis of hidden potentials, demand hotspots, and market conditions that are most favorable to success, this method enables firms to focus on target countries, maximize returns, and global expansion with data, backed by accuracy.
By factoring in the projected importer demand gap that is currently unmet and could be potential opportunity, it identifies the potential for the Exporter (Country) among 190 countries, against the general trade analysis, which identifies the biggest importer or exporter.
To discover high-growth global markets and optimize your business strategy:
Click Here
Pricing
- Single User License$ 1,995
- Department License$ 2,400
- Site License$ 3,120
- Global License$ 3,795

Leadership Perspectives from Industry Events
Search
Thought Leadership and Analyst Meet


Our Clients
6WResearch In News
- India Air Conditioner Market Set for Strong Rebound in 2026 After Weather-Led Correction and GST-Driven Recovery: 6Wresearch
- ADAS in India: How Automatic Emergency Braking, Blind Spot Detection & Driver Monitoring are Transforming Road Safety
- Doha a strategic location for EV manufacturing hub: IPA Qatar
- Demand for luxury TVs surging in the GCC, says Samsung
- Empowering Growth: The Thriving Journey of Bangladesh’s Cable Industry
- Demand for luxury TVs surging in the GCC, says Samsung
Latest Reports
- Poland Fire Protection Systems Market (2026-2032)
- Cape Verde Portable Hand-Thrown Extinguisher Market (2026-2032)
- Canada Portable Hand-Thrown Extinguisher Market (2026-2032)
- Cameroon Portable Hand-Thrown Extinguisher Market (2026-2032)
- Burundi Portable Hand-Thrown Extinguisher Market (2026-2032)
- Burkina Faso Portable Hand-Thrown Extinguisher Market (2026-2032)
- Bulgaria Portable Hand-Thrown Extinguisher Market (2026-2032)
- Brunei Portable Hand-Thrown Extinguisher Market (2026-2032)
- Botswana Portable Hand-Thrown Extinguisher Market (2026-2032)
- Bosnia and Herzegovina Portable Hand-Thrown Extinguisher Market (2026-2032)
Industry Events and Analyst Meet

HIMTEX 2026

India Refining Summit 2026

India EV Show 2026

EV tech India Expo 2026

Auto Tech Asia 2026
Whitepaper
- Middle East & Africa Commercial Security Market Click here to view more.
- Middle East & Africa Fire Safety Systems & Equipment Market Click here to view more.
- GCC Drone Market Click here to view more.
- Middle East Lighting Fixture Market Click here to view more.
- GCC Physical & Perimeter Security Market Click here to view more.