Sri Lanka Plastic Drums Market (2026-2032) | Growth, Trends, Forecast, Revenue, Companies, Value, Industry, Analysis, Size, Outlook & Share
Market Forecast By Material Type (Polyethylene (PE), LDPE, LLDPE, HDPE, Polypropylene (PP), Others), By Head Type (Open head, Tight head), By Capacity (Less than 10 gallons, 10-30 gallons, 30-55 gallons, 55 gallons and above), By End-users (Food & Beverages, Chemical & Petrochemicals, Building and Construction, Agriculture, Pharmaceuticals, Oil and lubricants, Others) And Competitive Landscape
| Product Code: ETC029871 | Publication Date: Oct 2020 | Updated Date: Jun 2026 | Product Type: Report | |
| Publisher: 6Wresearch | Author: Ravi Bhandari | No. of Pages: 70 | No. of Figures: 35 | No. of Tables: 5 |
Sri Lanka Plastic Drums Market Summary
The sri lanka plastic drums market was estimated at USD 497 Million in 2025 and is projected to reach USD 697 Million by 2032, growing at a CAGR of 5.6% from 2026 to 2032.
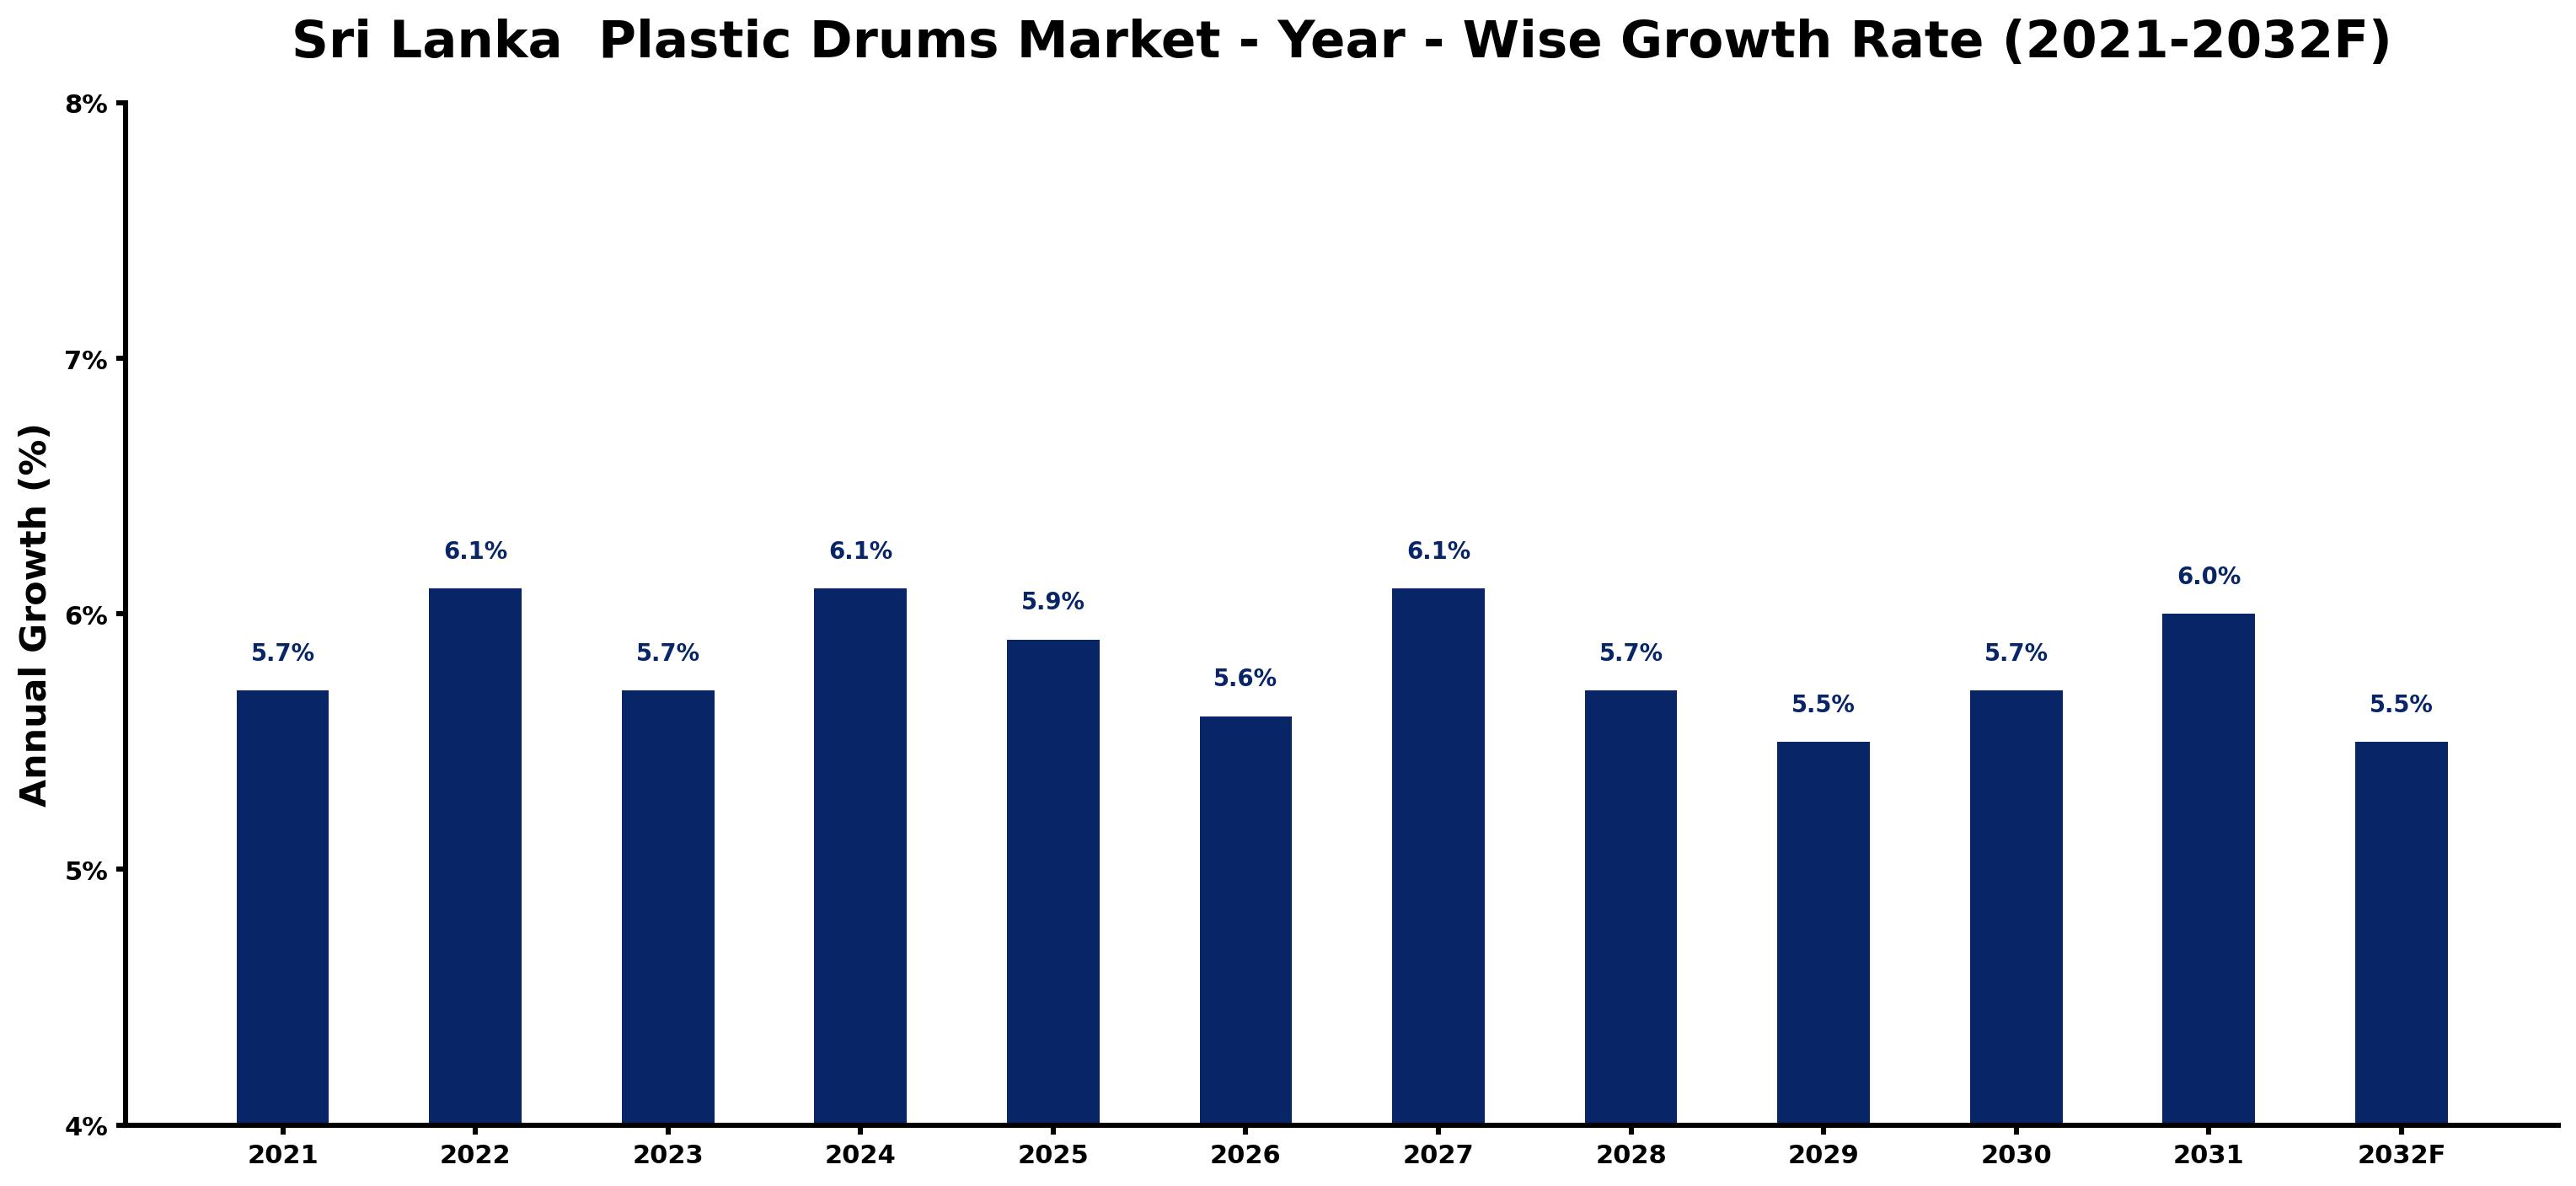
Sri Lanka Plastic Drums Market Growth Rate Analysis (2021-2032)
The Sri Lanka plastic drums market has exhibited stable growth, with a notable increase of 5.7% in 2021, followed by 6.1% in 2022. This upward trend continued, particularly in 2024, where growth peaked again at 6.1%. The market's performance is largely driven by rising consumer demand in industries such as chemicals and food processing, alongside strategic investments in manufacturing infrastructure. Fluctuations in growth, with slight dips to 5.5% in 2029 and 2032, are tied to global supply chain disruptions and shifting technology preferences that occasionally impact production efficiency. Nevertheless, the sector is poised for resilience as local businesses adapt to these challenges and embrace digitalization in their operations.
Sri Lanka Plastic Drums Market Year-wise Growth Rate and Key Drivers
This graph highlights how the Sri Lanka Plastic Drums Market has steadily grown over the past five years, supported by major growth factors.
The table below presents the year wise growth rates along with the key drivers influencing the market
| Year | Growth Rate | Major Drivers |
| 2021 | 5.7% | Manufacturers prioritize sustainable practices, attracting environmentally-conscious consumers in Sri Lanka. |
| 2022 | 6.1% | Local industries expand, increasing the need for durable storage solutions like plastic drums. |
| 2023 | 5.7% | Agricultural exports stabilize, driving demand for efficient packaging across various sectors. |
| 2024 | 6.1% | Infrastructure investments boost construction activities, necessitating robust storage options for materials. |
| 2025 | 5.9% | Regional trade agreements facilitate greater market access for plastic drum manufacturers. |
| 2026 | 5.6% | Technological innovations enhance production efficiency, reducing costs and improving product quality. |
| 2027 | 6.1% | Consumer preferences shift towards lightweight alternatives, boosting sales in the plastic drum segment. |
| 2028 | 5.7% | The sustainability movement influences companies to adopt eco-friendly packaging solutions extensively. |
| 2029 | 5.5% | Increased urbanization correlates with higher waste generation, prompting storage solution requirements. |
| 2030 | 5.7% | Emerging industries, such as pharmaceuticals, seek specialized storage options for liquids and chemicals. |
| 2031 | 6.0% | Logistics infrastructure advancements enhance distribution networks, making plastic drums more accessible. |
| 2032 | 5.5% | Global sustainability benchmarks influence local production practices and drive market evolution. |
Note - Market size estimations and growth projections presented in this report are based on 6Wresearch's advanced forecasting approach, validated with industry datasets as of June 2026.
Sri Lanka Plastic Drums Market Synopsis
The Sri Lanka Plastic Drums Market is projected to reach 5.6% and witness significant growth during the forecast period (2026-2032). This market is gaining traction as various sectors increasingly seek efficient, durable, and cost-effective solutions for the storage and transportation of a wide range of materials. Key factors contributing to this momentum include the expansion of industries, evolving logistics demands, and enhanced regulatory requirements for handling potentially hazardous materials.
Sri Lanka Plastic Drums Market Growth Drivers
The growth of the Sri Lanka Plastic Drums Market is primarily propelled by several essential drivers:
- Industrial Expansion: The growth in various industries such as chemicals, lubricants, and food processing is driving demand for efficient packaging solutions, thus enhancing the plastic drums market.
- Cost-effectiveness: Plastic drums provide an economic advantage due to their lower production costs compared to traditional materials like metal and fiber, promoting their adoption across multiple sectors.
- Lightweight and Durable: The lightweight nature of plastic drums facilitates easy handling and transportation, making them a preferred choice for logistics providers.
- Chemical Resistance: The ability of plastic drums to resist corrosive substances makes them ideal for storing hazardous materials, further boosting market demand.
- Reusable Packaging Preferences: With increasing environmental awareness, industries are favoring reusable packaging solutions, which is driving the adoption of plastic drums.
Sri Lanka Plastic Drums Market Challenges and Restraints
Despite its growth prospects, the Sri Lanka Plastic Drums Market faces several challenges:
- High Raw Material Costs: The cost of materials needed for manufacturing plastic drums is relatively high, affecting overall production expenses and profitability.
- Limited Local Manufacturing: The market suffers from a lack of adequate local manufacturing facilities, leading to reliance on imports which can be subject to economic fluctuations.
- Regulatory Compliance: The stringent safety and environmental standards pose a challenge for manufacturers in terms of compliance and operational adjustments.
- Competition from Alternatives: The presence of alternative packaging solutions, such as metal and composite drums, poses a competitive challenge to the plastic drums segment.
- Lack of Awareness: Limited understanding of the benefits of plastic drums among businesses may hinder market growth, necessitating improved educational initiatives.
Sri Lanka Plastic Drums Market Trends and Opportunities
Emerging trends present lucrative opportunities for the Sri Lanka Plastic Drums Market:
- Innovation in Drum Design: Manufacturers are focusing on developing specialized drum designs tailored for specific industries, enhancing functionality and safety.
- Advancements in Recycling Technologies: The integration of advanced recycling methods is enabling manufacturers to promote sustainable practices, appealing to environmentally-conscious consumers.
- Circular Economy Initiatives: Emphasis on sustainability is driving the adoption of circular economy principles within the market, enhancing the appeal of plastic drums as recyclable packaging solutions.
- Increased Logistics Demand: Growing logistics and supply chain activities within Sri Lanka necessitate efficient packaging solutions, positively impacting plastic drum demand.
- Regulatory Support for Sustainability: Government initiatives promoting circular economy practices create an enabling environment for the growth of sustainable packaging options like plastic drums.
Sri Lanka Plastic Drums Market Government Investment and Initiatives
The Sri Lankan government plays a significant role in fostering the growth of the plastic drums market by implementing various supportive policies and initiatives:
- Promotion of Local Manufacturing: The government encourages domestic production of plastic drums through financial incentives and support programs, aiming to reduce reliance on imports.
- Research and Development Support: Investments in research for innovative packaging technologies are promoted to enhance the overall quality and safety of industrial packaging solutions.
- Regulatory Compliance Framework: Establishing a robust regulatory framework ensures that safety and environmental standards are met, enhancing consumer trust in locally produced packaging.
- Public Awareness Campaigns: Initiatives aimed at educating businesses about the benefits of using plastic drums are being implemented to stimulate market interest and adoption.
- Support for Sustainable Practices: Government policies are increasingly aligned with sustainability goals, fostering the development of eco-friendly packaging options in industries.
Sri Lanka Plastic Drums Market Latest Developments (May 2025 - June 2026)
Recent industry developments indicate a dynamic shift in the Sri Lanka Plastic Drums Market:
- Innovation in Product Offerings: Manufacturers are increasingly introducing innovative designs that cater to specific industrial applications, enhancing operational efficiencies.
- Partnerships for Sustainability: Collaborative efforts between private and public sectors are emerging to promote environmental sustainability and improve recycling practices within the plastic drums market.
- Increased Focus on Safety: Enhanced safety measures and compliance protocols are being implemented across manufacturing facilities to meet growing regulatory demands.
- Rise in Export Opportunities: The expansion of Sri Lanka's logistics capabilities has opened avenues for exporting plastic drums to international markets, fostering growth prospects.
- Market Consolidation: The industry is witnessing consolidation efforts as companies seek to strengthen their market positions through mergers and partnerships.
Sri Lanka Plastic Drums Market - Key Attractiveness of the Report
- 10 Years of Market Numbers
- Historical Data Starting from 2022 to 2025
- Base Year: 2025
- Forecast Data until 2032
- Key Performance Indicators Impacting the Market
- Major Upcoming Developments and Projects
Key Highlights of the Report:
- Sri Lanka Plastic Drums Market Outlook
- Market Size of Sri Lanka Plastic Drums Market, 2025
- Forecast of Sri Lanka Plastic Drums Market, 2032
- Historical Data and Forecast of Sri Lanka Plastic Drums Revenues & Volume for the Period 2022-2032F
- Sri Lanka Plastic Drums Market Trend Evolution
- Sri Lanka Plastic Drums Market Drivers and Challenges
- Sri Lanka Plastic Drums Price Trends
- Sri Lanka Plastic Drums Porter's Five Forces
- Sri Lanka Plastic Drums Industry Life Cycle
- Historical Data and Forecast of Sri Lanka Plastic Drums Market Revenues & Volume By Material Type for the Period 2022-2032F
- Historical Data and Forecast of Sri Lanka Plastic Drums Market Revenues & Volume By Polyethylene (PE) for the Period 2022-2032F
- Historical Data and Forecast of Sri Lanka Plastic Drums Market Revenues & Volume By LDPE for the Period 2022-2032F
- Historical Data and Forecast of Sri Lanka Plastic Drums Market Revenues & Volume By LLDPE for the Period 2022-2032F
- Historical Data and Forecast of Sri Lanka Plastic Drums Market Revenues & Volume By HDPE for the Period 2022-2032F
- Historical Data and Forecast of Sri Lanka Plastic Drums Market Revenues & Volume By Polypropylene (PP) for the Period 2022-2032F
- Historical Data and Forecast of Sri Lanka Plastic Drums Market Revenues & Volume By Others for the Period 2022-2032F
- Historical Data and Forecast of Sri Lanka Plastic Drums Market Revenues & Volume By Head Type for the Period 2022-2032F
- Historical Data and Forecast of Sri Lanka Plastic Drums Market Revenues & Volume By Open head for the Period 2022-2032F
- Historical Data and Forecast of Sri Lanka Plastic Drums Market Revenues & Volume By Tight head for the Period 2022-2032F
- Historical Data and Forecast of Sri Lanka Plastic Drums Market Revenues & Volume By Capacity for the Period 2022-2032F
- Historical Data and Forecast of Sri Lanka Plastic Drums Market Revenues & Volume By Less than 10 gallons for the Period 2022-2032F
- Historical Data and Forecast of Sri Lanka Plastic Drums Market Revenues & Volume By 10-30 gallons for the Period 2022-2032F
- Historical Data and Forecast of Sri Lanka Plastic Drums Market Revenues & Volume By 30-55 gallons for the Period 2022-2032F
- Historical Data and Forecast of Sri Lanka Plastic Drums Market Revenues & Volume By 55 gallons and above for the Period 2022-2032F
- Historical Data and Forecast of Sri Lanka Plastic Drums Market Revenues & Volume By End-users for the Period 2022-2032F
- Historical Data and Forecast of Sri Lanka Plastic Drums Market Revenues & Volume By Food & Beverages for the Period 2022-2032F
- Historical Data and Forecast of Sri Lanka Plastic Drums Market Revenues & Volume By Chemical & Petrochemicals for the Period 2022-2032F
- Historical Data and Forecast of Sri Lanka Plastic Drums Market Revenues & Volume By Building and Construction for the Period 2022-2032F
- Historical Data and Forecast of Sri Lanka Plastic Drums Market Revenues & Volume By Agriculture for the Period 2022-2032F
- Historical Data and Forecast of Sri Lanka Plastic Drums Market Revenues & Volume By Pharmaceuticals for the Period 2022-2032F
- Historical Data and Forecast of Sri Lanka Plastic Drums Market Revenues & Volume By Oil and lubricants for the Period 2022-2032F
- Historical Data and Forecast of Sri Lanka Plastic Drums Market Revenues & Volume By Others for the Period 2022-2032F
- Sri Lanka Plastic Drums Import Export Trade Statistics
- Market Opportunity Assessment By Material Type
- Market Opportunity Assessment By Head Type
- Market Opportunity Assessment By Capacity
- Market Opportunity Assessment By End-users
- Sri Lanka Plastic Drums Top Companies Market Share
- Sri Lanka Plastic Drums Competitive Benchmarking By Technical and Operational Parameters
- Sri Lanka Plastic Drums Company Profiles
- Sri Lanka Plastic Drums Key Strategic Recommendations
Frequently Asked Questions About the Market Study (FAQs):
The main drivers include industrial expansion, cost-effectiveness, lightweight construction, chemical resistance, and the increasing preference for reusable packaging solutions.
Key challenges include high raw material costs, limited local manufacturing capacity, regulatory compliance issues, competition from alternative packaging, and a general lack of awareness about the benefits of plastic drums.
The government supports the market through financial incentives for local manufacturing, research initiatives, regulatory compliance frameworks, and campaigns to raise awareness of the benefits of plastic drums.
Current trends include innovation in drum design, advancements in recycling technologies, emphasis on circular economy principles, increased logistics demand, and regulatory support for sustainable practices.
6Wresearch actively monitors the Sri Lanka Plastic Drums Market and publishes its comprehensive annual report, highlighting emerging trends, growth drivers, revenue analysis, and forecast outlook. Our insights help businesses to make data-backed strategic decisions with ongoing market dynamics. Our analysts track relevent industries related to the Sri Lanka Plastic Drums Market, allowing our clients with actionable intelligence and reliable forecasts tailored to emerging regional needs.
Yes, we provide customisation as per your requirements. To learn more, feel free to contact us on sales@6wresearch.com
1 Executive Summary |
2 Introduction |
2.1 Key Highlights of the Report |
2.2 Report Description |
2.3 Market Scope & Segmentation |
2.4 Research Methodology |
2.5 Assumptions |
3 Sri Lanka Plastic Drums Market Overview |
3.1 Sri Lanka Country Macro Economic Indicators |
3.2 Sri Lanka Plastic Drums Market Revenues & Volume, 2022 & 2032F |
3.3 Sri Lanka Plastic Drums Market - Industry Life Cycle |
3.4 Sri Lanka Plastic Drums Market - Porter's Five Forces |
3.5 Sri Lanka Plastic Drums Market Revenues & Volume Share, By Material Type, 2022 & 2032F |
3.6 Sri Lanka Plastic Drums Market Revenues & Volume Share, By Head Type, 2022 & 2032F |
3.7 Sri Lanka Plastic Drums Market Revenues & Volume Share, By Capacity, 2022 & 2032F |
3.8 Sri Lanka Plastic Drums Market Revenues & Volume Share, By End-users, 2022 & 2032F |
4 Sri Lanka Plastic Drums Market Dynamics |
4.1 Impact Analysis |
4.2 Market Drivers |
4.3 Market Restraints |
5 Sri Lanka Plastic Drums Market Trends |
6 Sri Lanka Plastic Drums Market, By Types |
6.1 Sri Lanka Plastic Drums Market, By Material Type |
6.1.1 Overview and Analysis |
6.1.2 Sri Lanka Plastic Drums Market Revenues & Volume, By Material Type, 2022-2032F |
6.1.3 Sri Lanka Plastic Drums Market Revenues & Volume, By Polyethylene (PE), 2022-2032F |
6.1.4 Sri Lanka Plastic Drums Market Revenues & Volume, By LDPE, 2022-2032F |
6.1.5 Sri Lanka Plastic Drums Market Revenues & Volume, By LLDPE, 2022-2032F |
6.1.6 Sri Lanka Plastic Drums Market Revenues & Volume, By HDPE, 2022-2032F |
6.1.7 Sri Lanka Plastic Drums Market Revenues & Volume, By Polypropylene (PP), 2022-2032F |
6.1.8 Sri Lanka Plastic Drums Market Revenues & Volume, By Others, 2022-2032F |
6.2 Sri Lanka Plastic Drums Market, By Head Type |
6.2.1 Overview and Analysis |
6.2.2 Sri Lanka Plastic Drums Market Revenues & Volume, By Open head, 2022-2032F |
6.2.3 Sri Lanka Plastic Drums Market Revenues & Volume, By Tight head, 2022-2032F |
6.3 Sri Lanka Plastic Drums Market, By Capacity |
6.3.1 Overview and Analysis |
6.3.2 Sri Lanka Plastic Drums Market Revenues & Volume, By Less than 10 gallons, 2022-2032F |
6.3.3 Sri Lanka Plastic Drums Market Revenues & Volume, By 10-30 gallons, 2022-2032F |
6.3.4 Sri Lanka Plastic Drums Market Revenues & Volume, By 30-55 gallons, 2022-2032F |
6.3.5 Sri Lanka Plastic Drums Market Revenues & Volume, By 55 gallons and above, 2022-2032F |
6.4 Sri Lanka Plastic Drums Market, By End-users |
6.4.1 Overview and Analysis |
6.4.2 Sri Lanka Plastic Drums Market Revenues & Volume, By Food & Beverages, 2022-2032F |
6.4.3 Sri Lanka Plastic Drums Market Revenues & Volume, By Chemical & Petrochemicals, 2022-2032F |
6.4.4 Sri Lanka Plastic Drums Market Revenues & Volume, By Building and Construction, 2022-2032F |
6.4.5 Sri Lanka Plastic Drums Market Revenues & Volume, By Agriculture, 2022-2032F |
6.4.6 Sri Lanka Plastic Drums Market Revenues & Volume, By Pharmaceuticals, 2022-2032F |
6.4.7 Sri Lanka Plastic Drums Market Revenues & Volume, By Oil and lubricants, 2022-2032F |
7 Sri Lanka Plastic Drums Market Import-Export Trade Statistics |
7.1 Sri Lanka Plastic Drums Market Export to Major Countries |
7.2 Sri Lanka Plastic Drums Market Imports from Major Countries |
8 Sri Lanka Plastic Drums Market Key Performance Indicators |
9 Sri Lanka Plastic Drums Market - Opportunity Assessment |
9.1 Sri Lanka Plastic Drums Market Opportunity Assessment, By Material Type, 2022 & 2032F |
9.2 Sri Lanka Plastic Drums Market Opportunity Assessment, By Head Type, 2022 & 2032F |
9.3 Sri Lanka Plastic Drums Market Opportunity Assessment, By Capacity, 2022 & 2032F |
9.4 Sri Lanka Plastic Drums Market Opportunity Assessment, By End-users, 2022 & 2032F |
10 Sri Lanka Plastic Drums Market - Competitive Landscape |
10.1 Sri Lanka Plastic Drums Market Revenue Share, By Companies, 2025 |
10.2 Sri Lanka Plastic Drums Market Competitive Benchmarking, By Operating and Technical Parameters |
11 Company Profiles |
12 Recommendations |
13 Disclaimer |
Global Go To Market Strategy - 2030
Export potential enables firms to identify high-growth global markets with greater confidence by combining advanced trade intelligence with a structured quantitative methodology. The framework analyzes emerging demand trends and country-level import patterns while integrating macroeconomic and trade datasets such as GDP and population forecasts, bilateral import–export flows, tariff structures, elasticity differentials between developed and developing economies, geographic distance, and import demand projections. Using weighted trade values from 2020–2024 as the base period to project country-to-country export potential for 2030, these inputs are operationalized through calculated drivers such as gravity model parameters, tariff impact factors, and projected GDP per-capita growth. Through an analysis of hidden potentials, demand hotspots, and market conditions that are most favorable to success, this method enables firms to focus on target countries, maximize returns, and global expansion with data, backed by accuracy.
By factoring in the projected importer demand gap that is currently unmet and could be potential opportunity, it identifies the potential for the Exporter (Country) among 190 countries, against the general trade analysis, which identifies the biggest importer or exporter.
To discover high-growth global markets and optimize your business strategy:
Click Here
Pricing
- Single User License$ 1,995
- Department License$ 2,400
- Site License$ 3,120
- Global License$ 3,795

Leadership Perspectives from Industry Events
Search
Thought Leadership and Analyst Meet


Our Clients
6WResearch In News
- India Air Conditioner Market Set for Strong Rebound in 2026 After Weather-Led Correction and GST-Driven Recovery: 6Wresearch
- ADAS in India: How Automatic Emergency Braking, Blind Spot Detection & Driver Monitoring are Transforming Road Safety
- Doha a strategic location for EV manufacturing hub: IPA Qatar
- Demand for luxury TVs surging in the GCC, says Samsung
- Empowering Growth: The Thriving Journey of Bangladesh’s Cable Industry
- Demand for luxury TVs surging in the GCC, says Samsung
Latest Reports
- Poland Fire Protection Systems Market (2026-2032)
- Cape Verde Portable Hand-Thrown Extinguisher Market (2026-2032)
- Canada Portable Hand-Thrown Extinguisher Market (2026-2032)
- Cameroon Portable Hand-Thrown Extinguisher Market (2026-2032)
- Burundi Portable Hand-Thrown Extinguisher Market (2026-2032)
- Burkina Faso Portable Hand-Thrown Extinguisher Market (2026-2032)
- Bulgaria Portable Hand-Thrown Extinguisher Market (2026-2032)
- Brunei Portable Hand-Thrown Extinguisher Market (2026-2032)
- Botswana Portable Hand-Thrown Extinguisher Market (2026-2032)
- Bosnia and Herzegovina Portable Hand-Thrown Extinguisher Market (2026-2032)
Industry Events and Analyst Meet

HIMTEX 2026

India Refining Summit 2026

India EV Show 2026

EV tech India Expo 2026

Auto Tech Asia 2026
Whitepaper
- Middle East & Africa Commercial Security Market Click here to view more.
- Middle East & Africa Fire Safety Systems & Equipment Market Click here to view more.
- GCC Drone Market Click here to view more.
- Middle East Lighting Fixture Market Click here to view more.
- GCC Physical & Perimeter Security Market Click here to view more.