Sri Lanka Video Game Accessories Market (2026-2032) | Revenue, Size, Trends, Analysis, Outlook, Forecast, Companies, Industry, Value, Growth & Share
Market Forecast By Product Type (Gamepads, Keyboards, Mice, Headset, Surfaces, Controllers/Joysticks, Virtual Reality Devices, Others), By End-users (Casual Gaming, Professional Gaming) And Competitive Landscape
| Product Code: ETC012531 | Publication Date: Oct 2020 | Updated Date: Jun 2026 | Product Type: Report | |
| Publisher: 6Wresearch | Author: Ravi Bhandari | No. of Pages: 70 | No. of Figures: 35 | No. of Tables: 5 |
Sri Lanka Video Game Accessories Market Summary
The sri lanka video game accessories market was estimated at USD 958 Million in 2025 and is projected to reach USD 1382 Million by 2032, growing at a CAGR of 6.4% from 2026 to 2032.
Sri Lanka Video Game Accessories Market Year-wise Growth Rate and Key Drivers
This graph highlights how the Sri Lanka Video Game Accessories Market has steadily grown over the past five years, supported by major growth factors.
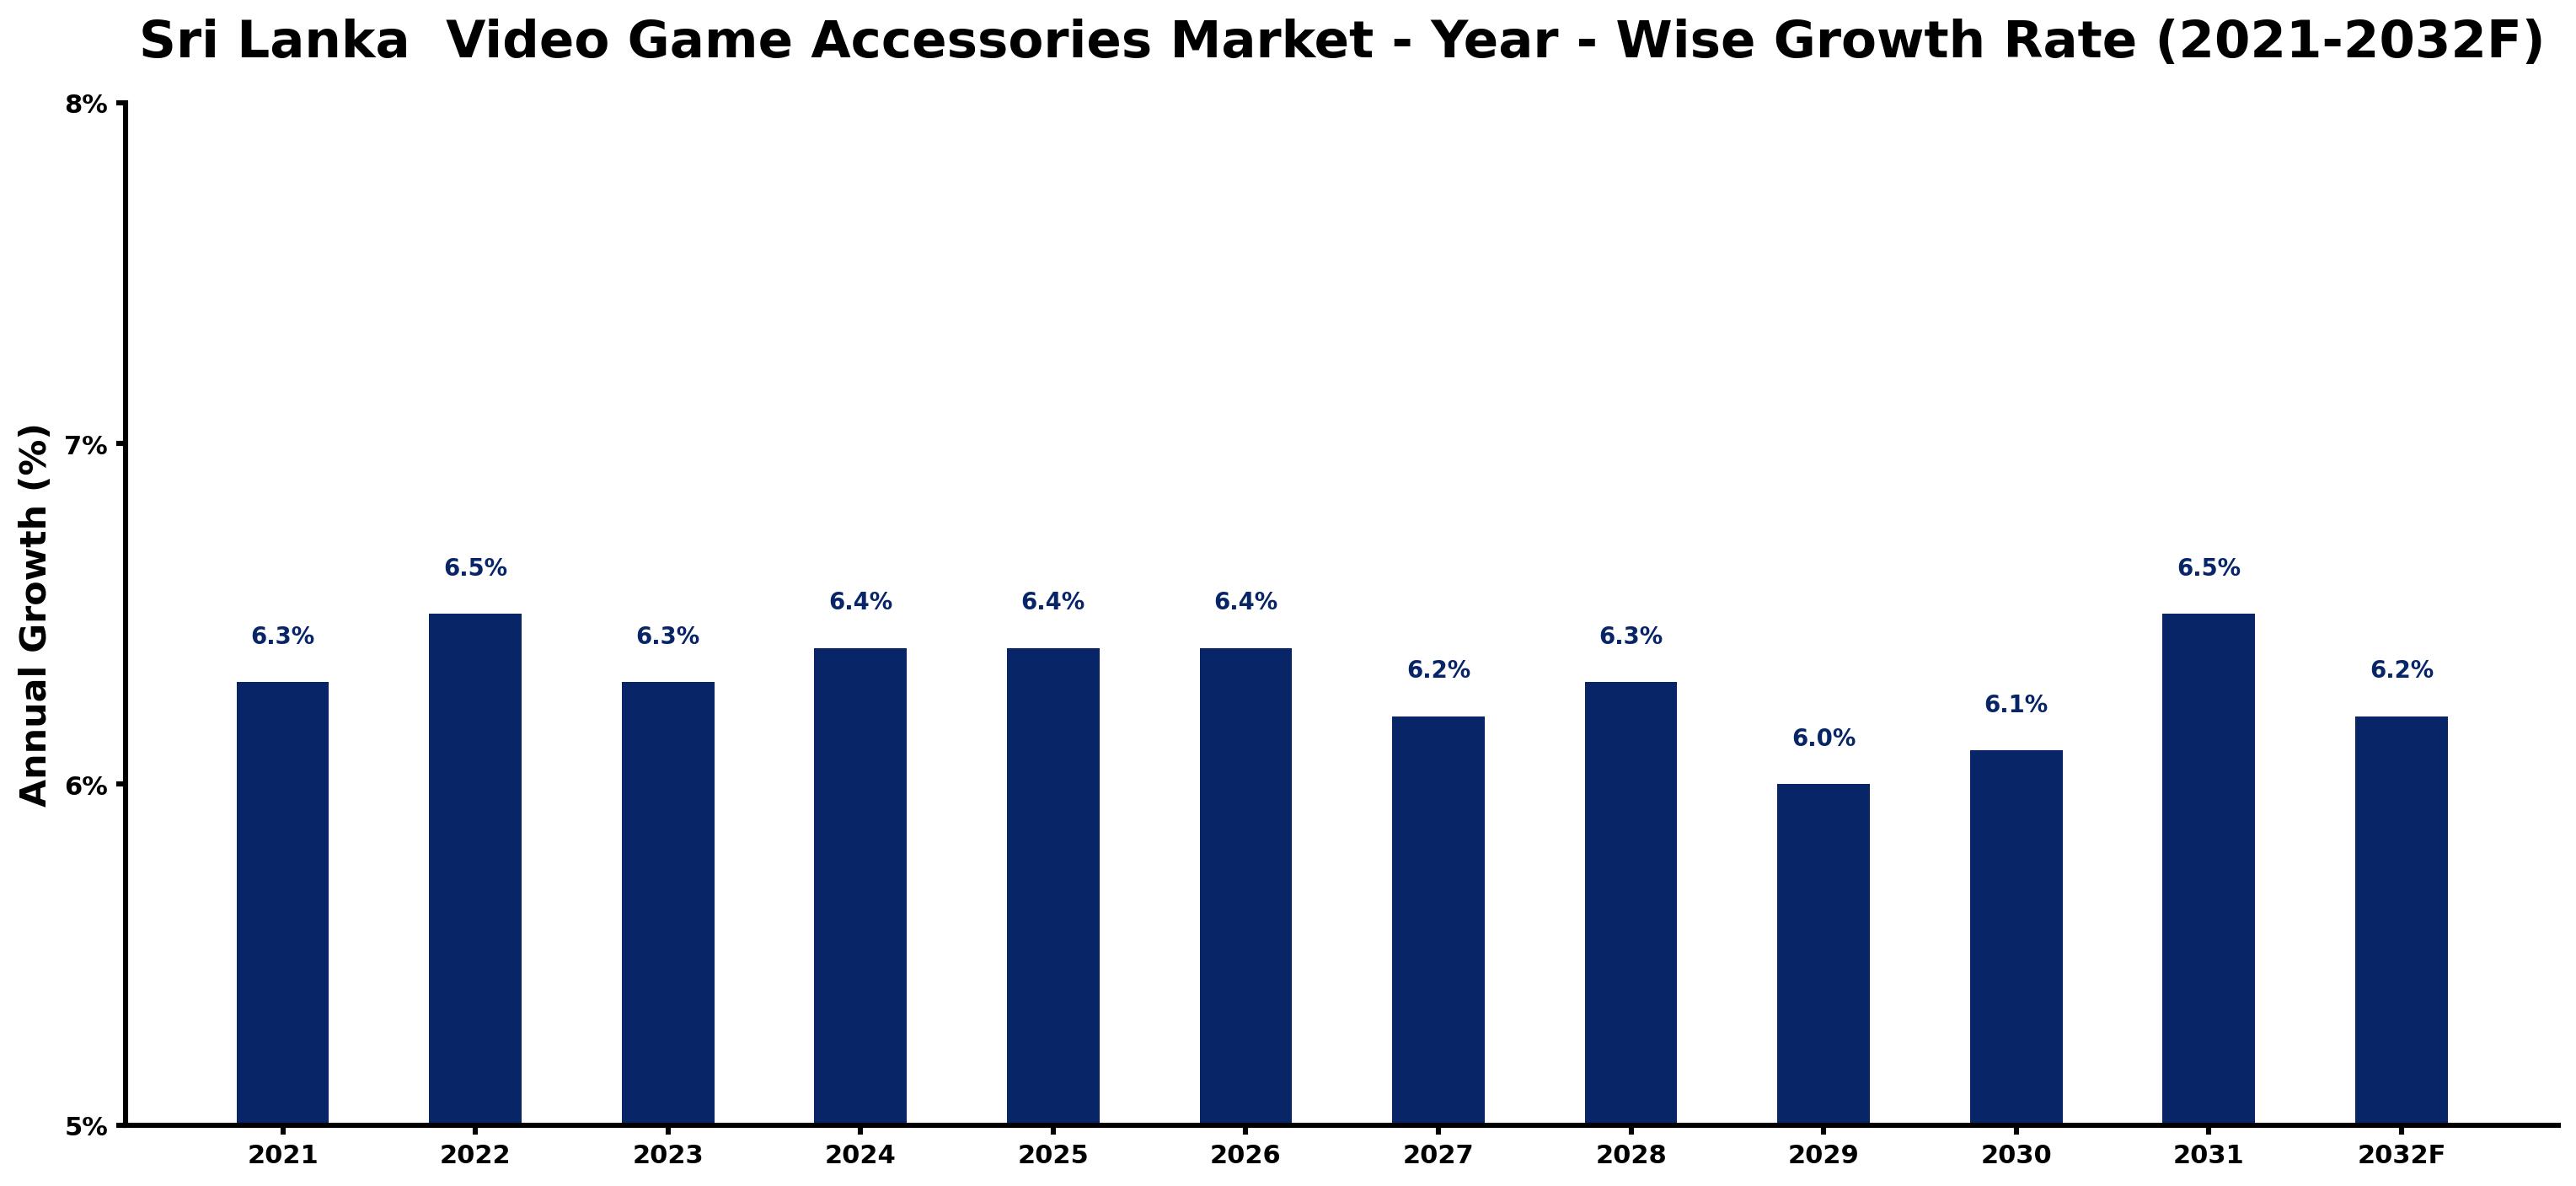
The table below presents the year wise growth rates along with the key drivers influencing the market
| Year | Growth Rate | Major Drivers |
| 2021 | 6.3% | Increased focus on mobile gaming from both casual and competitive players. |
| 2022 | 6.5% | Retail expansion of gaming accessories through both online and physical storefronts. |
| 2023 | 6.3% | Local esports tournaments engage youth, boosting interest in quality accessories. |
| 2024 | 6.4% | Emerging middle class seeks premium gaming experiences, fueling accessory sales. |
| 2025 | 6.4% | Brand collaborations with influencers enhance visibility of gaming products significantly. |
| 2026 | 6.4% | Technological convergence encourages integration of VR accessories in gaming setups. |
| 2027 | 6.2% | Youth culture shifts prioritize gaming as a primary entertainment medium. |
| 2028 | 6.3% | Rising internet penetration supports online gaming communities and accessory demand. |
| 2029 | 6.0% | Manufacturers invest in regional production facilities to reduce logistics costs. |
| 2030 | 6.1% | Sustainability trends push brands to develop eco-friendly gaming accessory options. |
| 2031 | 6.5% | Social media platforms amplify trends, prompting quick shifts in consumer preferences. |
| 2032 | 6.2% | International partnerships expand local market access, enhancing product diversity. |
Note - Market size estimations and growth projections presented in this report are based on 6Wresearch's advanced forecasting approach, validated with industry datasets as of June 2026.
Key Highlights of the Report:
- Sri Lanka Video Game Accessories Market Outlook
- Market Size of Sri Lanka Video Game Accessories Market, 2025
- Forecast of Sri Lanka Video Game Accessories Market, 2032F
- Historical Data and Forecast of Sri Lanka Video Game Accessories Revenues & Volume for the Period 2022-2032F
- Sri Lanka Video Game Accessories Market Trend Evolution
- Sri Lanka Video Game Accessories Market Drivers and Challenges
- Sri Lanka Video Game Accessories Price Trends
- Sri Lanka Video Game Accessories Porter's Five Forces
- Sri Lanka Video Game Accessories Industry Life Cycle
- Historical Data and Forecast of Sri Lanka Video Game Accessories Market Revenues & Volume By Product Type for the Period 2022-2032F
- Historical Data and Forecast of Sri Lanka Video Game Accessories Market Revenues & Volume By Gamepads for the Period 2022-2032F
- Historical Data and Forecast of Sri Lanka Video Game Accessories Market Revenues & Volume By Keyboards for the Period 2022-2032F
- Historical Data and Forecast of Sri Lanka Video Game Accessories Market Revenues & Volume By Mice for the Period 2022-2032F
- Historical Data and Forecast of Sri Lanka Video Game Accessories Market Revenues & Volume By Headset for the Period 2022-2032F
- Historical Data and Forecast of Sri Lanka Video Game Accessories Market Revenues & Volume By Surfaces for the Period 2022-2032F
- Historical Data and Forecast of Sri Lanka Video Game Accessories Market Revenues & Volume By Controllers/Joysticks for the Period 2022-2032F
- Historical Data and Forecast of Sri Lanka Video Game Accessories Market Revenues & Volume By Virtual Reality Devices for the Period 2022-2032F
- Historical Data and Forecast of Sri Lanka Gamepads Video Game Accessories Market Revenues & Volume By Others for the Period 2022-2032F
- Historical Data and Forecast of Sri Lanka Video Game Accessories Market Revenues & Volume By End-users for the Period 2022-2032F
- Historical Data and Forecast of Sri Lanka Video Game Accessories Market Revenues & Volume By Casual Gaming? for the Period 2022-2032F
- Historical Data and Forecast of Sri Lanka Video Game Accessories Market Revenues & Volume By Professional Gaming for the Period 2022-2032F
- Sri Lanka Video Game Accessories Import Export Trade Statistics
- Market Opportunity Assessment By Product Type
- Market Opportunity Assessment By End-users
- Sri Lanka Video Game Accessories Top Companies Market Share
- Sri Lanka Video Game Accessories Competitive Benchmarking By Technical and Operational Parameters
- Sri Lanka Video Game Accessories Company Profiles
- Sri Lanka Video Game Accessories Key Strategic Recommendations
Frequently Asked Questions About the Market Study (FAQs):
6Wresearch actively monitors the Sri Lanka Video Game Accessories Market and publishes its comprehensive annual report, highlighting emerging trends, growth drivers, revenue analysis, and forecast outlook. Our insights help businesses to make data-backed strategic decisions with ongoing market dynamics. Our analysts track relevent industries related to the Sri Lanka Video Game Accessories Market, allowing our clients with actionable intelligence and reliable forecasts tailored to emerging regional needs.
Yes, we provide customisation as per your requirements. To learn more, feel free to contact us on sales@6wresearch.com
1 Executive Summary |
2 Introduction |
2.1 Key Highlights of the Report |
2.2 Report Description |
2.3 Market Scope & Segmentation |
2.4 Research Methodology |
2.5 Assumptions |
3 Sri Lanka Video Game Accessories Market Overview |
3.1 Sri Lanka Country Macro Economic Indicators |
3.2 Sri Lanka Video Game Accessories Market Revenues & Volume, 2022 & 2032F |
3.3 Sri Lanka Video Game Accessories Market - Industry Life Cycle |
3.4 Sri Lanka Video Game Accessories Market - Porter's Five Forces |
3.5 Sri Lanka Video Game Accessories Market Revenues & Volume Share, By Product Type, 2022 & 2032F |
3.6 Sri Lanka Video Game Accessories Market Revenues & Volume Share, By End-users, 2022 & 2032F |
4 Sri Lanka Video Game Accessories Market Dynamics |
4.1 Impact Analysis |
4.2 Market Drivers |
4.3 Market Restraints |
5 Sri Lanka Video Game Accessories Market Trends |
6 Sri Lanka Video Game Accessories Market, By Types |
6.1 Sri Lanka Video Game Accessories Market, By Product Type |
6.1.1 Overview and Analysis |
6.1.2 Sri Lanka Video Game Accessories Market Revenues & Volume, By Product Type, 2022 - 2032F |
6.1.3 Sri Lanka Video Game Accessories Market Revenues & Volume, By Gamepads, 2022 - 2032F |
6.1.4 Sri Lanka Video Game Accessories Market Revenues & Volume, By Keyboards, 2022 - 2032F |
6.1.5 Sri Lanka Video Game Accessories Market Revenues & Volume, By Mice, 2022 - 2032F |
6.1.6 Sri Lanka Video Game Accessories Market Revenues & Volume, By Headset, 2022 - 2032F |
6.1.7 Sri Lanka Video Game Accessories Market Revenues & Volume, By Surfaces, 2022 - 2032F |
6.1.8 Sri Lanka Video Game Accessories Market Revenues & Volume, By Controllers/Joysticks, 2022 - 2032F |
6.1.9 Sri Lanka Video Game Accessories Market Revenues & Volume, By Others, 2022 - 2032F |
6.1.10 Sri Lanka Video Game Accessories Market Revenues & Volume, By Others, 2022 - 2032F |
6.2 Sri Lanka Video Game Accessories Market, By End-users |
6.2.1 Overview and Analysis |
6.2.2 Sri Lanka Video Game Accessories Market Revenues & Volume, By Casual Gaming , 2022 - 2032F |
6.2.3 Sri Lanka Video Game Accessories Market Revenues & Volume, By Professional Gaming, 2022 - 2032F |
7 Sri Lanka Video Game Accessories Market Import-Export Trade Statistics |
7.1 Sri Lanka Video Game Accessories Market Export to Major Countries |
7.2 Sri Lanka Video Game Accessories Market Imports from Major Countries |
8 Sri Lanka Video Game Accessories Market Key Performance Indicators |
9 Sri Lanka Video Game Accessories Market - Opportunity Assessment |
9.1 Sri Lanka Video Game Accessories Market Opportunity Assessment, By Product Type, 2022 & 2032F |
9.2 Sri Lanka Video Game Accessories Market Opportunity Assessment, By End-users, 2022 & 2032F |
10 Sri Lanka Video Game Accessories Market - Competitive Landscape |
10.1 Sri Lanka Video Game Accessories Market Revenue Share, By Companies, 2025 |
10.2 Sri Lanka Video Game Accessories Market Competitive Benchmarking, By Operating and Technical Parameters |
11 Company Profiles |
12 Recommendations |
13 Disclaimer |
Global Go To Market Strategy - 2030
Export potential enables firms to identify high-growth global markets with greater confidence by combining advanced trade intelligence with a structured quantitative methodology. The framework analyzes emerging demand trends and country-level import patterns while integrating macroeconomic and trade datasets such as GDP and population forecasts, bilateral import–export flows, tariff structures, elasticity differentials between developed and developing economies, geographic distance, and import demand projections. Using weighted trade values from 2020–2024 as the base period to project country-to-country export potential for 2030, these inputs are operationalized through calculated drivers such as gravity model parameters, tariff impact factors, and projected GDP per-capita growth. Through an analysis of hidden potentials, demand hotspots, and market conditions that are most favorable to success, this method enables firms to focus on target countries, maximize returns, and global expansion with data, backed by accuracy.
By factoring in the projected importer demand gap that is currently unmet and could be potential opportunity, it identifies the potential for the Exporter (Country) among 190 countries, against the general trade analysis, which identifies the biggest importer or exporter.
To discover high-growth global markets and optimize your business strategy:
Click Here
Pricing
- Single User License$ 1,995
- Department License$ 2,400
- Site License$ 3,120
- Global License$ 3,795

Leadership Perspectives from Industry Events
Search
Thought Leadership and Analyst Meet


Our Clients
6WResearch In News
- India Air Conditioner Market Set for Strong Rebound in 2026 After Weather-Led Correction and GST-Driven Recovery: 6Wresearch
- ADAS in India: How Automatic Emergency Braking, Blind Spot Detection & Driver Monitoring are Transforming Road Safety
- Doha a strategic location for EV manufacturing hub: IPA Qatar
- Demand for luxury TVs surging in the GCC, says Samsung
- Empowering Growth: The Thriving Journey of Bangladesh’s Cable Industry
- Demand for luxury TVs surging in the GCC, says Samsung
Latest Reports
- Nicaragua RPG Gaming Market (2026-2032)
- New Zealand RPG Gaming Market (2026-2032)
- Netherlands RPG Gaming Market (2026-2032)
- Nauru RPG Gaming Market (2026-2032)
- Namibia RPG Gaming Market (2026-2032)
- Mozambique RPG Gaming Market (2026-2032)
- Montenegro RPG Gaming Market (2026-2032)
- Mongolia RPG Gaming Market (2026-2032)
- Monaco RPG Gaming Market (2026-2032)
- Micronesia RPG Gaming Market (2026-2032)
Industry Events and Analyst Meet

EV India Expo 2026

HIMTEX 2026

India Refining Summit 2026

India EV Show 2026

EV tech India Expo 2026
Whitepaper
- Middle East & Africa Commercial Security Market Click here to view more.
- Middle East & Africa Fire Safety Systems & Equipment Market Click here to view more.
- GCC Drone Market Click here to view more.
- Middle East Lighting Fixture Market Click here to view more.
- GCC Physical & Perimeter Security Market Click here to view more.