Swaziland Phosphonates Market (2026-2032) | Segmentation, Value, Companies, Growth, Revenue, Share, Trends, Size, Forecast, Outlook, Analysis & Industry
Market Forecast By Product (ATMP, BHMT, HEDP, DTPMP, Others), By Function (Chemical Intermediates, Metal chelating agents, Scale Inhibitor, Bleach Stabilizer, Concrete Retarder, Others), By End-Use (Pharmaceutical, Water Treatment, Oil & Gas, Detergents & cleaning agents, Paper & Pulp, Textile, Agriculture, Others) And Competitive Landscape
| Product Code: ETC5301886 | Publication Date: Nov 2023 | Updated Date: Feb 2026 | Product Type: Market Research Report | |
| Publisher: 6Wresearch | Author: Ravi Bhandari | No. of Pages: 60 | No. of Figures: 30 | No. of Tables: 5 |
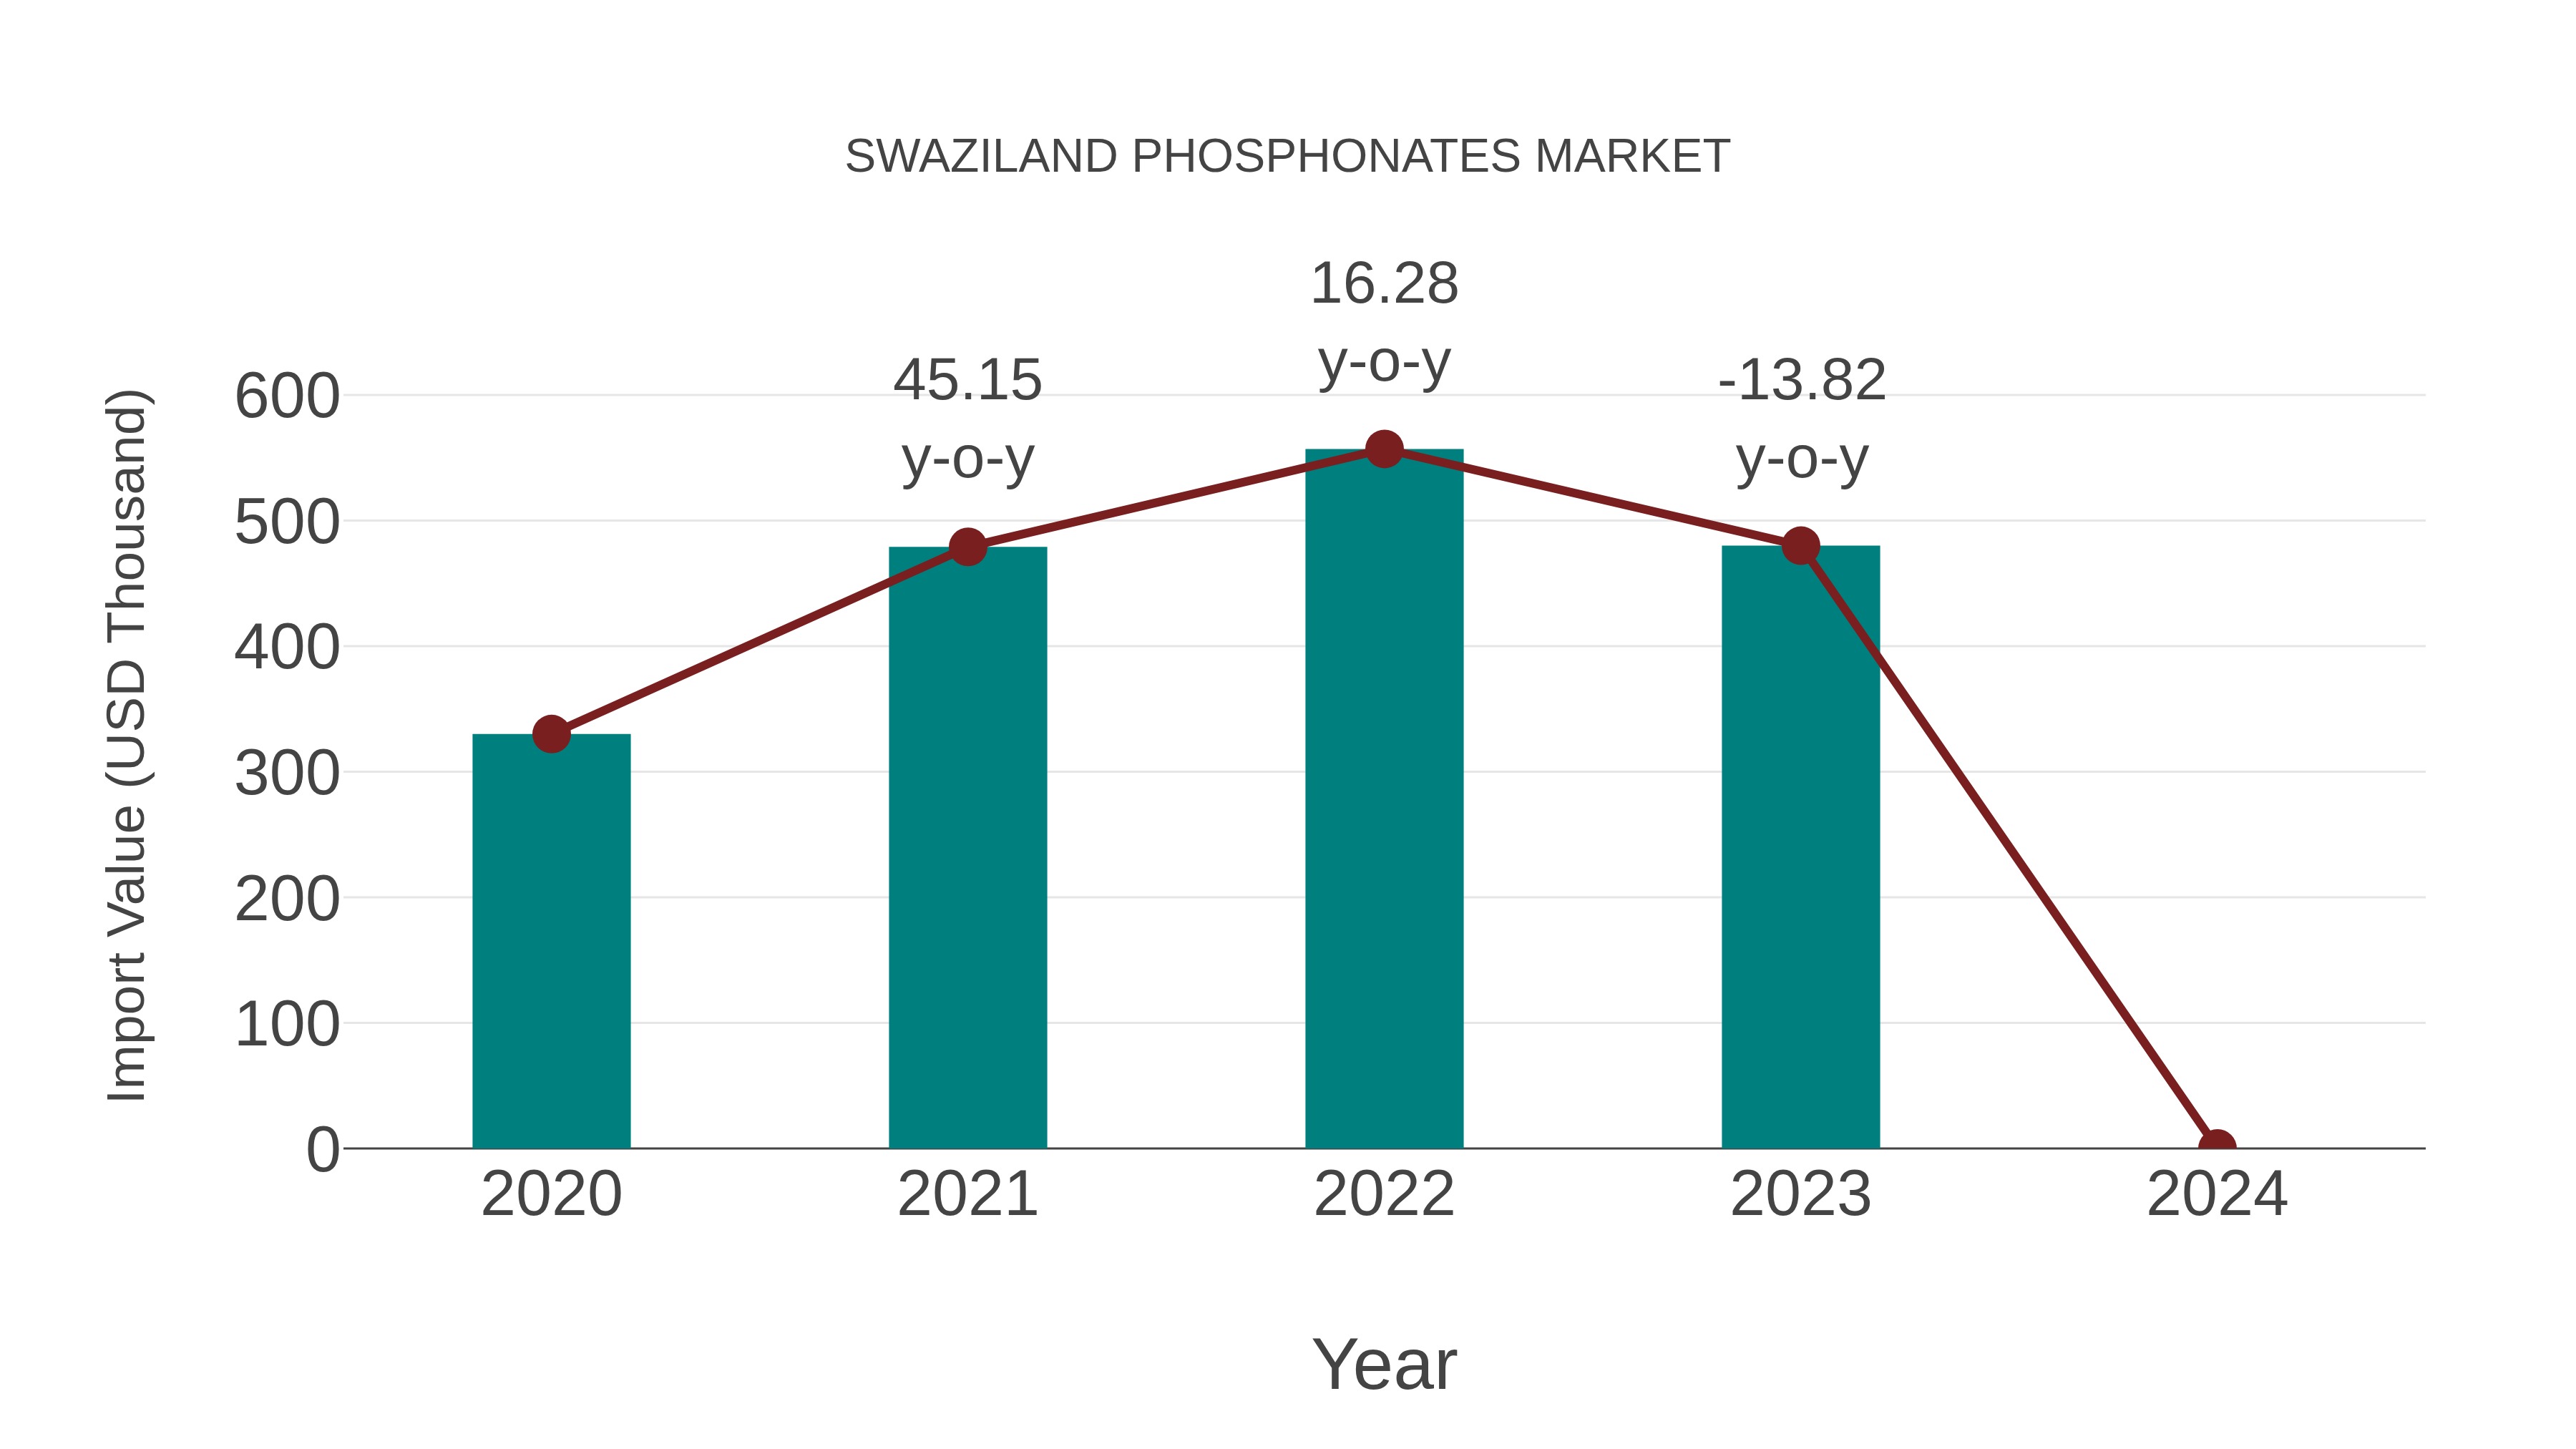
Swaziland Phosphonates Market: Import Trend Analysis
During 2020-2024, the Swaziland phosphonates market experienced a significant increase in imports, with a Compound Annual Growth Rate (CAGR) of 248.95%. Despite a zero year-on-year growth rate in 2023-2024, the overall trend showed a substantial rise in imported phosphonates during the period.
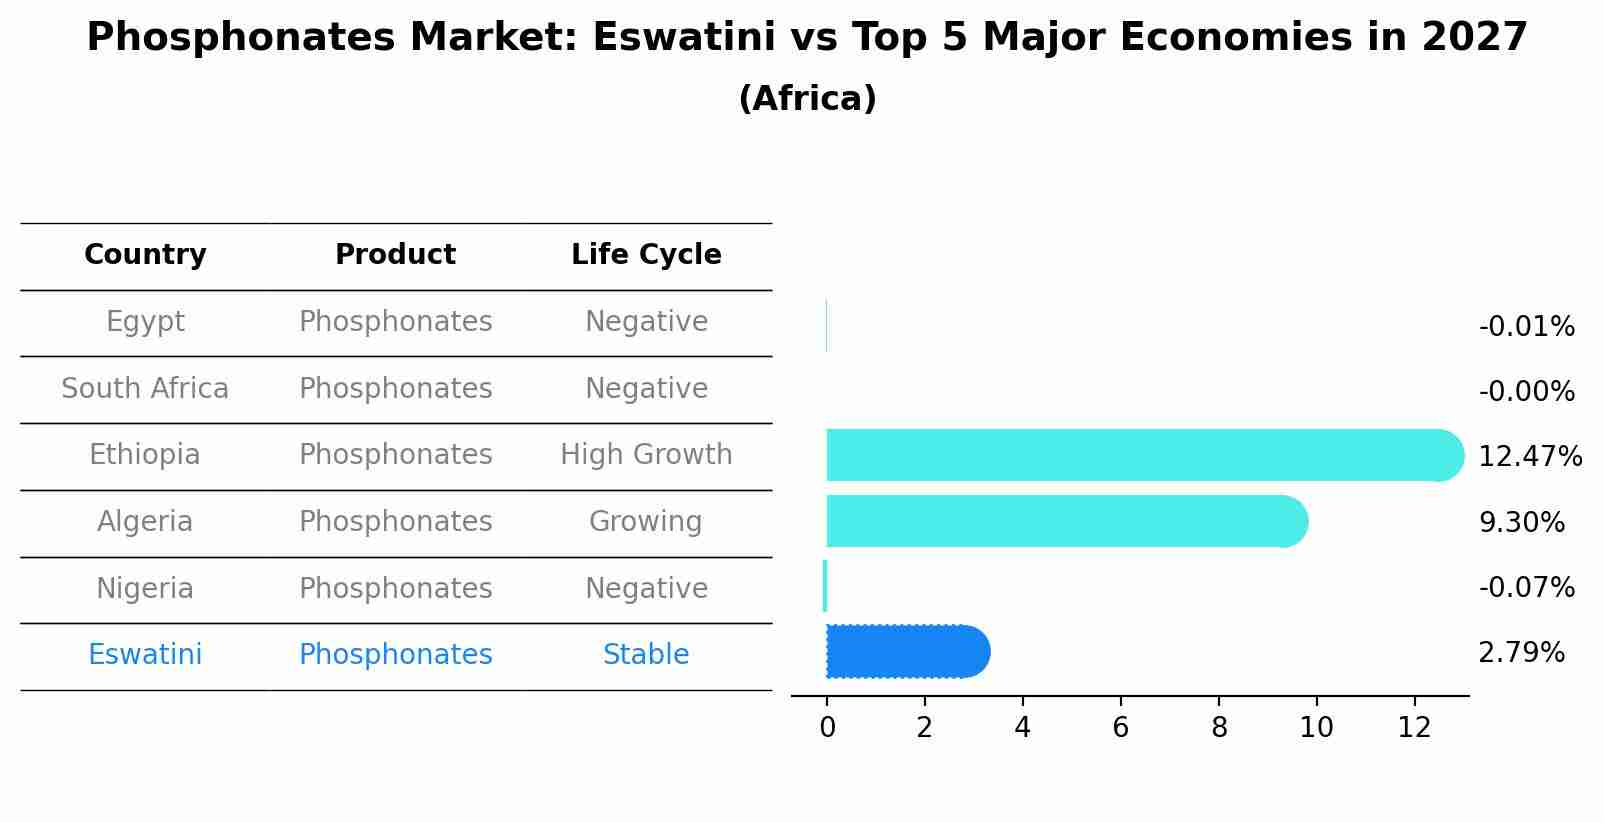
Phosphonates Market: Eswatini vs Top 5 Major Economies in 2027 (Africa)
The Phosphonates market in Eswatini is projected to grow at a stable growth rate of 2.79% by 2027, highlighting the country's increasing focus on advanced technologies within the Africa region, where Egypt holds the dominant position, followed closely by South Africa, Ethiopia, Algeria and Nigeria, shaping overall regional demand.
Key Highlights of the Report:
- Swaziland Phosphonates Market Outlook
- Market Size of Swaziland Phosphonates Market, 2025
- Forecast of Swaziland Phosphonates Market, 2032
- Historical Data and Forecast of Swaziland Phosphonates Revenues & Volume for the Period 2022-2032F
- Swaziland Phosphonates Market Trend Evolution
- Swaziland Phosphonates Market Drivers and Challenges
- Swaziland Phosphonates Price Trends
- Swaziland Phosphonates Porter`s Five Forces
- Swaziland Phosphonates Industry Life Cycle
- Historical Data and Forecast of Swaziland Phosphonates Market Revenues & Volume By Product for the Period 2022-2032F
- Historical Data and Forecast of Swaziland Phosphonates Market Revenues & Volume By ATMP for the Period 2022-2032F
- Historical Data and Forecast of Swaziland Phosphonates Market Revenues & Volume By BHMT for the Period 2022-2032F
- Historical Data and Forecast of Swaziland Phosphonates Market Revenues & Volume By HEDP for the Period 2022-2032F
- Historical Data and Forecast of Swaziland Phosphonates Market Revenues & Volume By DTPMP for the Period 2022-2032F
- Historical Data and Forecast of Swaziland Phosphonates Market Revenues & Volume By Others for the Period 2022-2032F
- Historical Data and Forecast of Swaziland Phosphonates Market Revenues & Volume By Function for the Period 2022-2032F
- Historical Data and Forecast of Swaziland Phosphonates Market Revenues & Volume By Chemical Intermediates for the Period 2022-2032F
- Historical Data and Forecast of Swaziland Phosphonates Market Revenues & Volume By Metal chelating agents for the Period 2022-2032F
- Historical Data and Forecast of Swaziland Phosphonates Market Revenues & Volume By Scale Inhibitor for the Period 2022-2032F
- Historical Data and Forecast of Swaziland Phosphonates Market Revenues & Volume By Bleach Stabilizer for the Period 2022-2032F
- Historical Data and Forecast of Swaziland Phosphonates Market Revenues & Volume By Concrete Retarder for the Period 2022-2032F
- Historical Data and Forecast of Swaziland Phosphonates Market Revenues & Volume By Others for the Period 2022-2032F
- Historical Data and Forecast of Swaziland Phosphonates Market Revenues & Volume By End-Use for the Period 2022-2032F
- Historical Data and Forecast of Swaziland Phosphonates Market Revenues & Volume By Pharmaceutical for the Period 2022-2032F
- Historical Data and Forecast of Swaziland Phosphonates Market Revenues & Volume By Water Treatment for the Period 2022-2032F
- Historical Data and Forecast of Swaziland Phosphonates Market Revenues & Volume By Oil & Gas for the Period 2022-2032F
- Historical Data and Forecast of Swaziland Phosphonates Market Revenues & Volume By Detergents & cleaning agents for the Period 2022-2032F
- Historical Data and Forecast of Swaziland Phosphonates Market Revenues & Volume By Paper & Pulp for the Period 2022-2032F
- Historical Data and Forecast of Swaziland Phosphonates Market Revenues & Volume By Textile for the Period 2022-2032F
- Historical Data and Forecast of Swaziland Phosphonates Market Revenues & Volume By Agriculture for the Period 2022-2032F
- Historical Data and Forecast of Swaziland Phosphonates Market Revenues & Volume By Others for the Period 2022-2032F
- Swaziland Phosphonates Import Export Trade Statistics
- Market Opportunity Assessment By Product
- Market Opportunity Assessment By Function
- Market Opportunity Assessment By End-Use
- Swaziland Phosphonates Top Companies Market Share
- Swaziland Phosphonates Competitive Benchmarking By Technical and Operational Parameters
- Swaziland Phosphonates Company Profiles
- Swaziland Phosphonates Key Strategic Recommendations
Frequently Asked Questions About the Market Study (FAQs):
6Wresearch actively monitors the Swaziland Phosphonates Market and publishes its comprehensive annual report, highlighting emerging trends, growth drivers, revenue analysis, and forecast outlook. Our insights help businesses to make data-backed strategic decisions with ongoing market dynamics. Our analysts track relevent industries related to the Swaziland Phosphonates Market, allowing our clients with actionable intelligence and reliable forecasts tailored to emerging regional needs.
Yes, we provide customisation as per your requirements. To learn more, feel free to contact us on sales@6wresearch.com
1 Executive Summary |
2 Introduction |
2.1 Key Highlights of the Report |
2.2 Report Description |
2.3 Market Scope & Segmentation |
2.4 Research Methodology |
2.5 Assumptions |
3 Swaziland Phosphonates Market Overview |
3.1 Swaziland Country Macro Economic Indicators |
3.2 Swaziland Phosphonates Market Revenues & Volume, 2022 & 2032F |
3.3 Swaziland Phosphonates Market - Industry Life Cycle |
3.4 Swaziland Phosphonates Market - Porter's Five Forces |
3.5 Swaziland Phosphonates Market Revenues & Volume Share, By Product, 2022 & 2032F |
3.6 Swaziland Phosphonates Market Revenues & Volume Share, By Function, 2022 & 2032F |
3.7 Swaziland Phosphonates Market Revenues & Volume Share, By End-Use, 2022 & 2032F |
4 Swaziland Phosphonates Market Dynamics |
4.1 Impact Analysis |
4.2 Market Drivers |
4.2.1 Increasing demand for phosphonates in water treatment applications due to growing concerns about water quality and environmental regulations. |
4.2.2 Rising adoption of phosphonates in agricultural sector for enhancing crop yield and soil health. |
4.2.3 Government initiatives promoting the use of phosphonates in industrial applications for corrosion inhibition and scale prevention. |
4.3 Market Restraints |
4.3.1 Volatility in raw material prices leading to fluctuating production costs for phosphonates manufacturers. |
4.3.2 Stringent regulations on the use of certain types of phosphonates in consumer products and water treatment processes. |
5 Swaziland Phosphonates Market Trends |
6 Swaziland Phosphonates Market Segmentations |
6.1 Swaziland Phosphonates Market, By Product |
6.1.1 Overview and Analysis |
6.1.2 Swaziland Phosphonates Market Revenues & Volume, By ATMP, 2022-2032F |
6.1.3 Swaziland Phosphonates Market Revenues & Volume, By BHMT, 2022-2032F |
6.1.4 Swaziland Phosphonates Market Revenues & Volume, By HEDP, 2022-2032F |
6.1.5 Swaziland Phosphonates Market Revenues & Volume, By DTPMP, 2022-2032F |
6.1.6 Swaziland Phosphonates Market Revenues & Volume, By Others, 2022-2032F |
6.2 Swaziland Phosphonates Market, By Function |
6.2.1 Overview and Analysis |
6.2.2 Swaziland Phosphonates Market Revenues & Volume, By Chemical Intermediates, 2022-2032F |
6.2.3 Swaziland Phosphonates Market Revenues & Volume, By Metal chelating agents, 2022-2032F |
6.2.4 Swaziland Phosphonates Market Revenues & Volume, By Scale Inhibitor, 2022-2032F |
6.2.5 Swaziland Phosphonates Market Revenues & Volume, By Bleach Stabilizer, 2022-2032F |
6.2.6 Swaziland Phosphonates Market Revenues & Volume, By Concrete Retarder, 2022-2032F |
6.2.7 Swaziland Phosphonates Market Revenues & Volume, By Others, 2022-2032F |
6.3 Swaziland Phosphonates Market, By End-Use |
6.3.1 Overview and Analysis |
6.3.2 Swaziland Phosphonates Market Revenues & Volume, By Pharmaceutical, 2022-2032F |
6.3.3 Swaziland Phosphonates Market Revenues & Volume, By Water Treatment, 2022-2032F |
6.3.4 Swaziland Phosphonates Market Revenues & Volume, By Oil & Gas, 2022-2032F |
6.3.5 Swaziland Phosphonates Market Revenues & Volume, By Detergents & cleaning agents, 2022-2032F |
6.3.6 Swaziland Phosphonates Market Revenues & Volume, By Paper & Pulp, 2022-2032F |
6.3.7 Swaziland Phosphonates Market Revenues & Volume, By Textile, 2022-2032F |
6.3.8 Swaziland Phosphonates Market Revenues & Volume, By Others, 2022-2032F |
6.3.9 Swaziland Phosphonates Market Revenues & Volume, By Others, 2022-2032F |
7 Swaziland Phosphonates Market Import-Export Trade Statistics |
7.1 Swaziland Phosphonates Market Export to Major Countries |
7.2 Swaziland Phosphonates Market Imports from Major Countries |
8 Swaziland Phosphonates Market Key Performance Indicators |
8.1 Number of new product launches and innovations in the phosphonates market. |
8.2 Investment in research and development activities for the development of new phosphonates applications. |
8.3 Adoption rate of phosphonates in key end-use industries such as water treatment, agriculture, and industrial applications. |
9 Swaziland Phosphonates Market - Opportunity Assessment |
9.1 Swaziland Phosphonates Market Opportunity Assessment, By Product, 2022 & 2032F |
9.2 Swaziland Phosphonates Market Opportunity Assessment, By Function, 2022 & 2032F |
9.3 Swaziland Phosphonates Market Opportunity Assessment, By End-Use, 2022 & 2032F |
10 Swaziland Phosphonates Market - Competitive Landscape |
10.1 Swaziland Phosphonates Market Revenue Share, By Companies, 2025 |
10.2 Swaziland Phosphonates Market Competitive Benchmarking, By Operating and Technical Parameters |
11 Company Profiles |
12 Recommendations | 13 Disclaimer |
Global Go To Market Strategy - 2030
Export potential enables firms to identify high-growth global markets with greater confidence by combining advanced trade intelligence with a structured quantitative methodology. The framework analyzes emerging demand trends and country-level import patterns while integrating macroeconomic and trade datasets such as GDP and population forecasts, bilateral import–export flows, tariff structures, elasticity differentials between developed and developing economies, geographic distance, and import demand projections. Using weighted trade values from 2020–2024 as the base period to project country-to-country export potential for 2030, these inputs are operationalized through calculated drivers such as gravity model parameters, tariff impact factors, and projected GDP per-capita growth. Through an analysis of hidden potentials, demand hotspots, and market conditions that are most favorable to success, this method enables firms to focus on target countries, maximize returns, and global expansion with data, backed by accuracy.
By factoring in the projected importer demand gap that is currently unmet and could be potential opportunity, it identifies the potential for the Exporter (Country) among 190 countries, against the general trade analysis, which identifies the biggest importer or exporter.
To discover high-growth global markets and optimize your business strategy:
Click Here
Pricing
- Single User License$ 1,995
- Department License$ 2,400
- Site License$ 3,120
- Global License$ 3,795

Leadership Perspectives from Industry Events
Search
Thought Leadership and Analyst Meet


Our Clients
6WResearch In News
- Doha a strategic location for EV manufacturing hub: IPA Qatar
- Demand for luxury TVs surging in the GCC, says Samsung
- Empowering Growth: The Thriving Journey of Bangladesh’s Cable Industry
- Demand for luxury TVs surging in the GCC, says Samsung
- Video call with a traditional healer? Once unthinkable, it’s now common in South Africa
- Intelligent Buildings To Smooth GCC’s Path To Net Zero
Latest Reports
- Cape Verde Portable Hand-Thrown Extinguisher Market (2026-2032)
- Canada Portable Hand-Thrown Extinguisher Market (2026-2032)
- Cameroon Portable Hand-Thrown Extinguisher Market (2026-2032)
- Burundi Portable Hand-Thrown Extinguisher Market (2026-2032)
- Burkina Faso Portable Hand-Thrown Extinguisher Market (2026-2032)
- Bulgaria Portable Hand-Thrown Extinguisher Market (2026-2032)
- Brunei Portable Hand-Thrown Extinguisher Market (2026-2032)
- Botswana Portable Hand-Thrown Extinguisher Market (2026-2032)
- Bosnia and Herzegovina Portable Hand-Thrown Extinguisher Market (2026-2032)
- Bolivia Portable Hand-Thrown Extinguisher Market (2026-2032)
Industry Events and Analyst Meet

HIMTEX 2026

India Refining Summit 2026

India EV Show 2026

EV tech India Expo 2026

Auto Tech Asia 2026
Whitepaper
- Middle East & Africa Commercial Security Market Click here to view more.
- Middle East & Africa Fire Safety Systems & Equipment Market Click here to view more.
- GCC Drone Market Click here to view more.
- Middle East Lighting Fixture Market Click here to view more.
- GCC Physical & Perimeter Security Market Click here to view more.