Sweden Orange Juice Market (2026-2032) | Forecast, Revenue, Trends, Share, Growth, Outlook, Size, Companies, Value, Industry, Segmentation & Analysis
Market Forecast By Product Type (Frozen Concentrated Orange Juice, Not From Concentrate, Canned Orange Juice, Fresh-Squeezed Orange juice, Dehydrated Orange Juice, Others), By Packaging (Tetra Pak, PP Material Bottle, Metal Can, Others), By Distribution Channel (Offline Channel, Online Channel) And Competitive Landscape
| Product Code: ETC5018730 | Publication Date: Nov 2023 | Updated Date: Apr 2026 | Product Type: Market Research Report | |
| Publisher: 6Wresearch | Author: Shubham Padhi | No. of Pages: 60 | No. of Figures: 30 | No. of Tables: 5 |
Sweden Orange Juice Market Size (2020-2030)
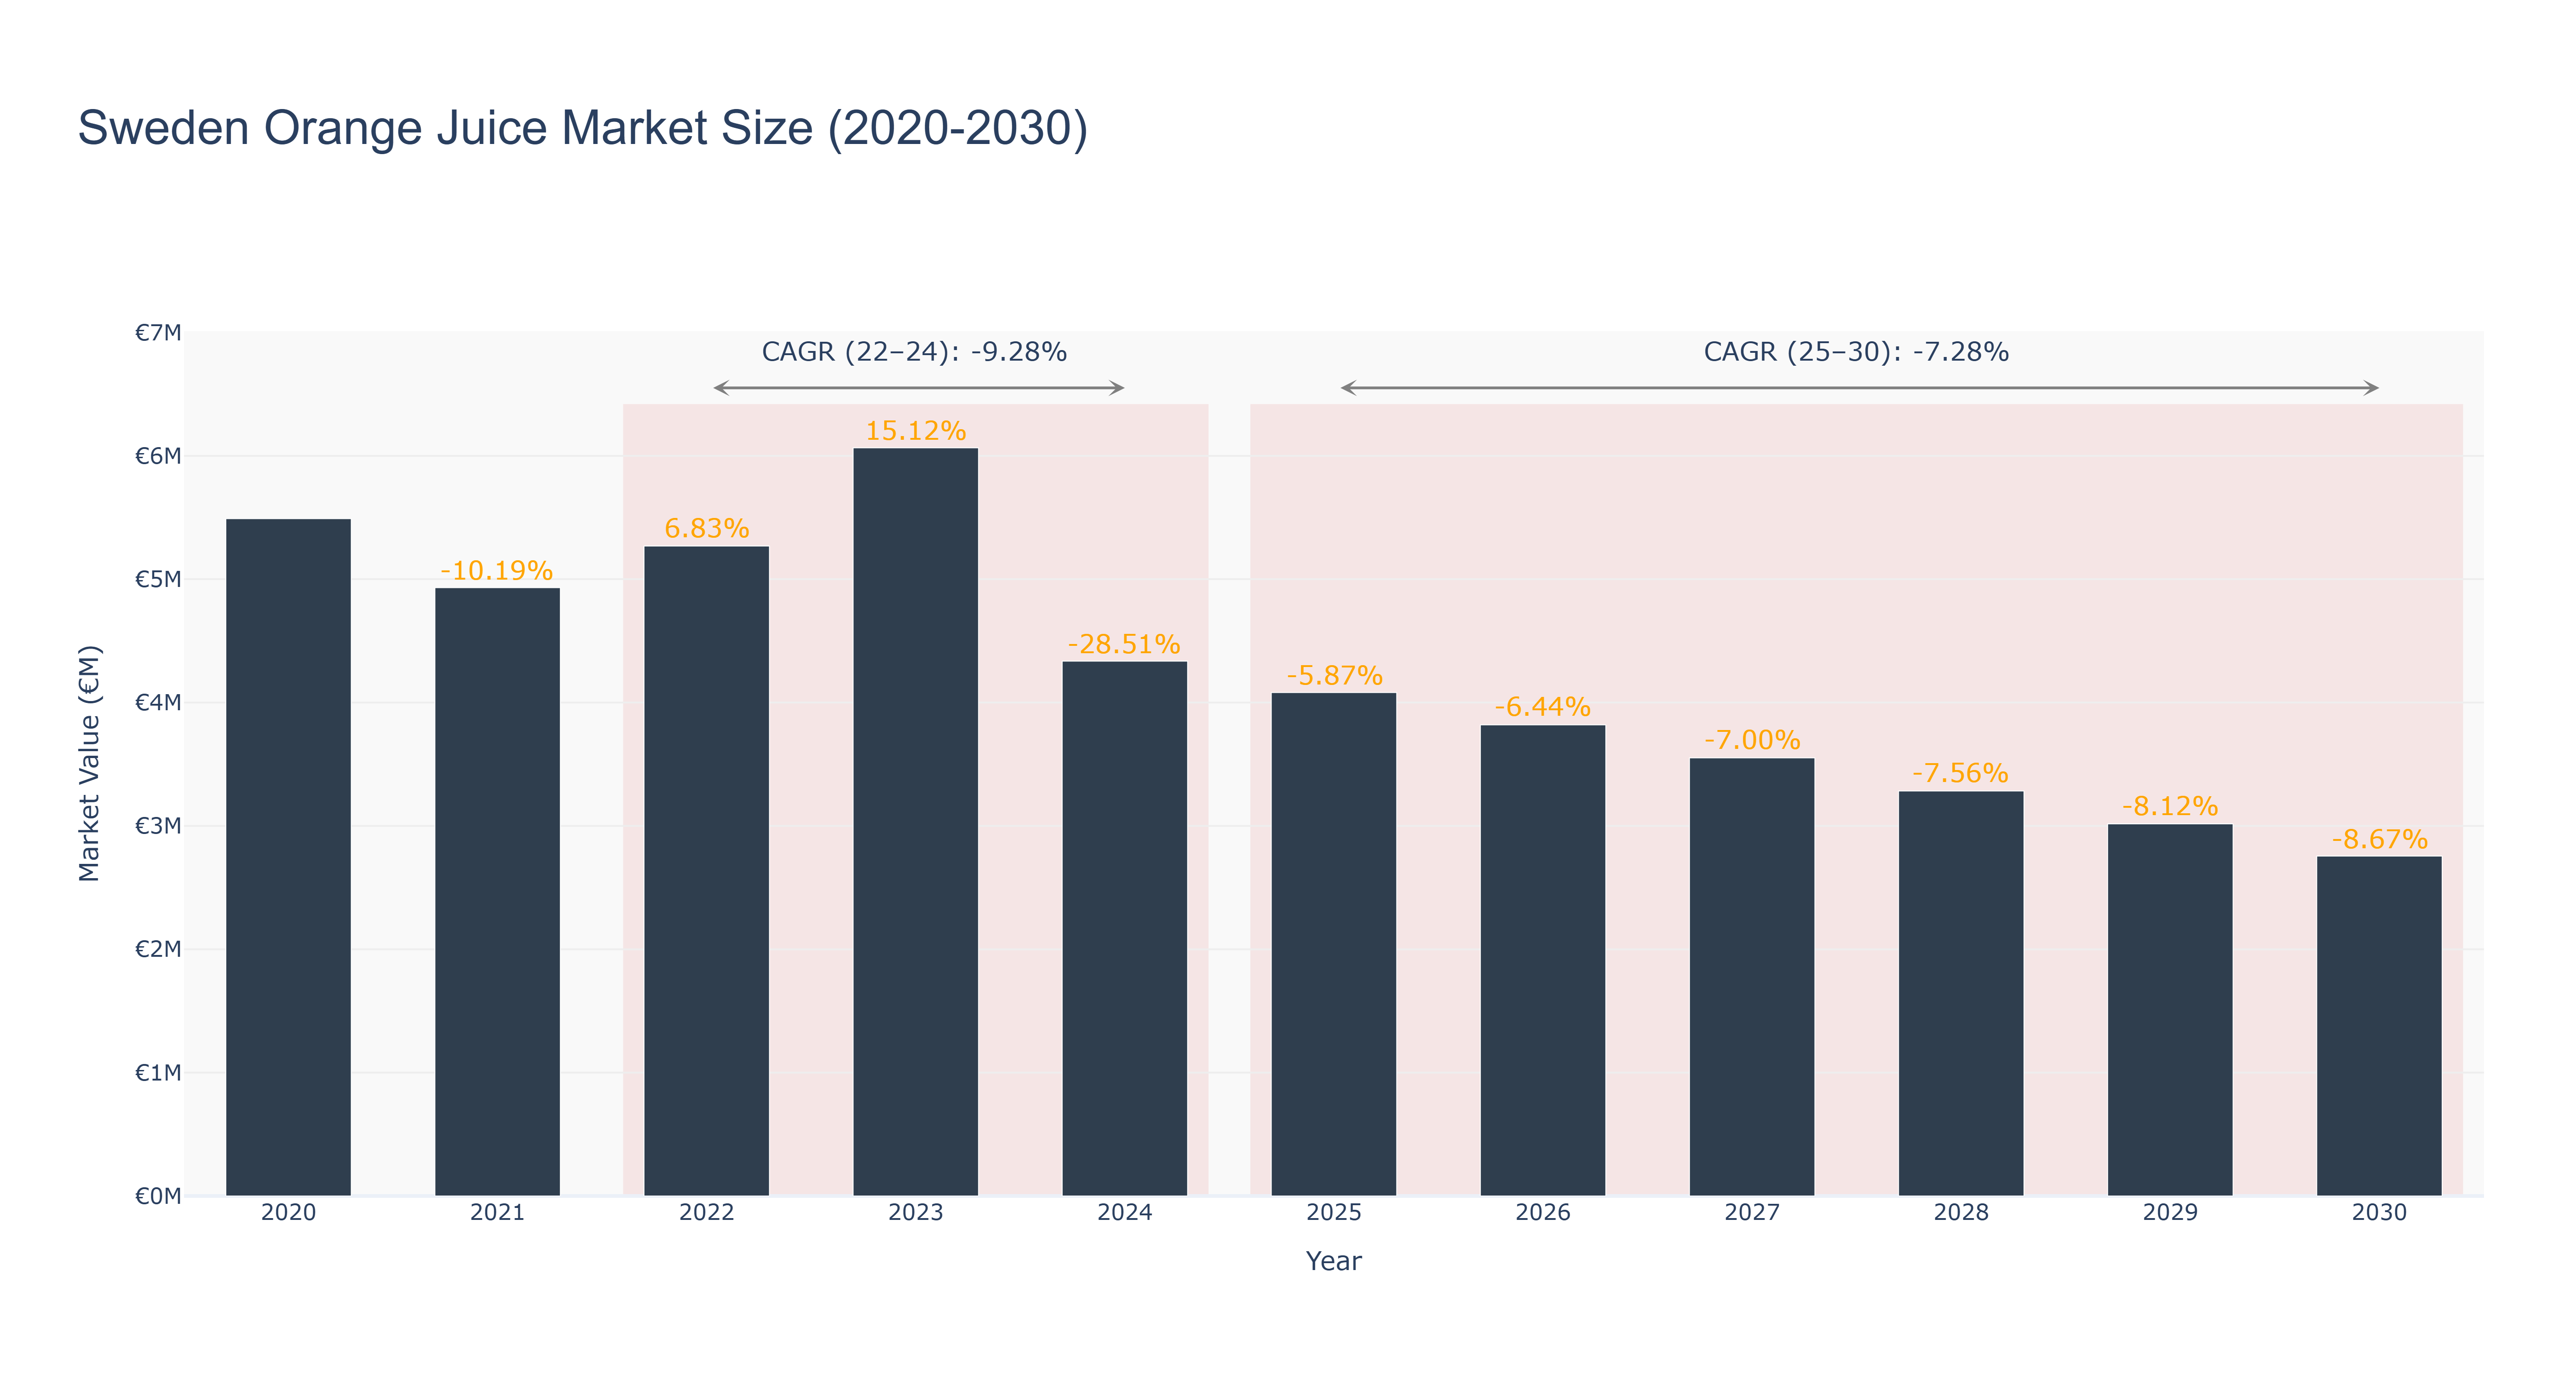
Sweden Orange Juice Market has experienced a fluctuating trend in recent years. The peak market size of €6.07 million was recorded in 2023, followed by a decline to €4.34 million in 2024. The market is forecasted to further decrease to €2.76 million by 2030, with a CAGR of -7.28% from 2025 to 2030. The CAGR from 2022 to 2024 was -9.28%. The downward trend can be attributed to changing consumer preferences towards healthier alternatives and the impact of economic uncertainties. To counter this trend, market players are focusing on product innovation and marketing strategies to attract health-conscious consumers. In the near future, Sweden is set to introduce sustainable packaging initiatives in the orange juice market to align with environmental sustainability goals, which could potentially drive market growth amidst challenging conditions.
Sweden Orange Juice Market: Production & Trade Performance (2019-2025)
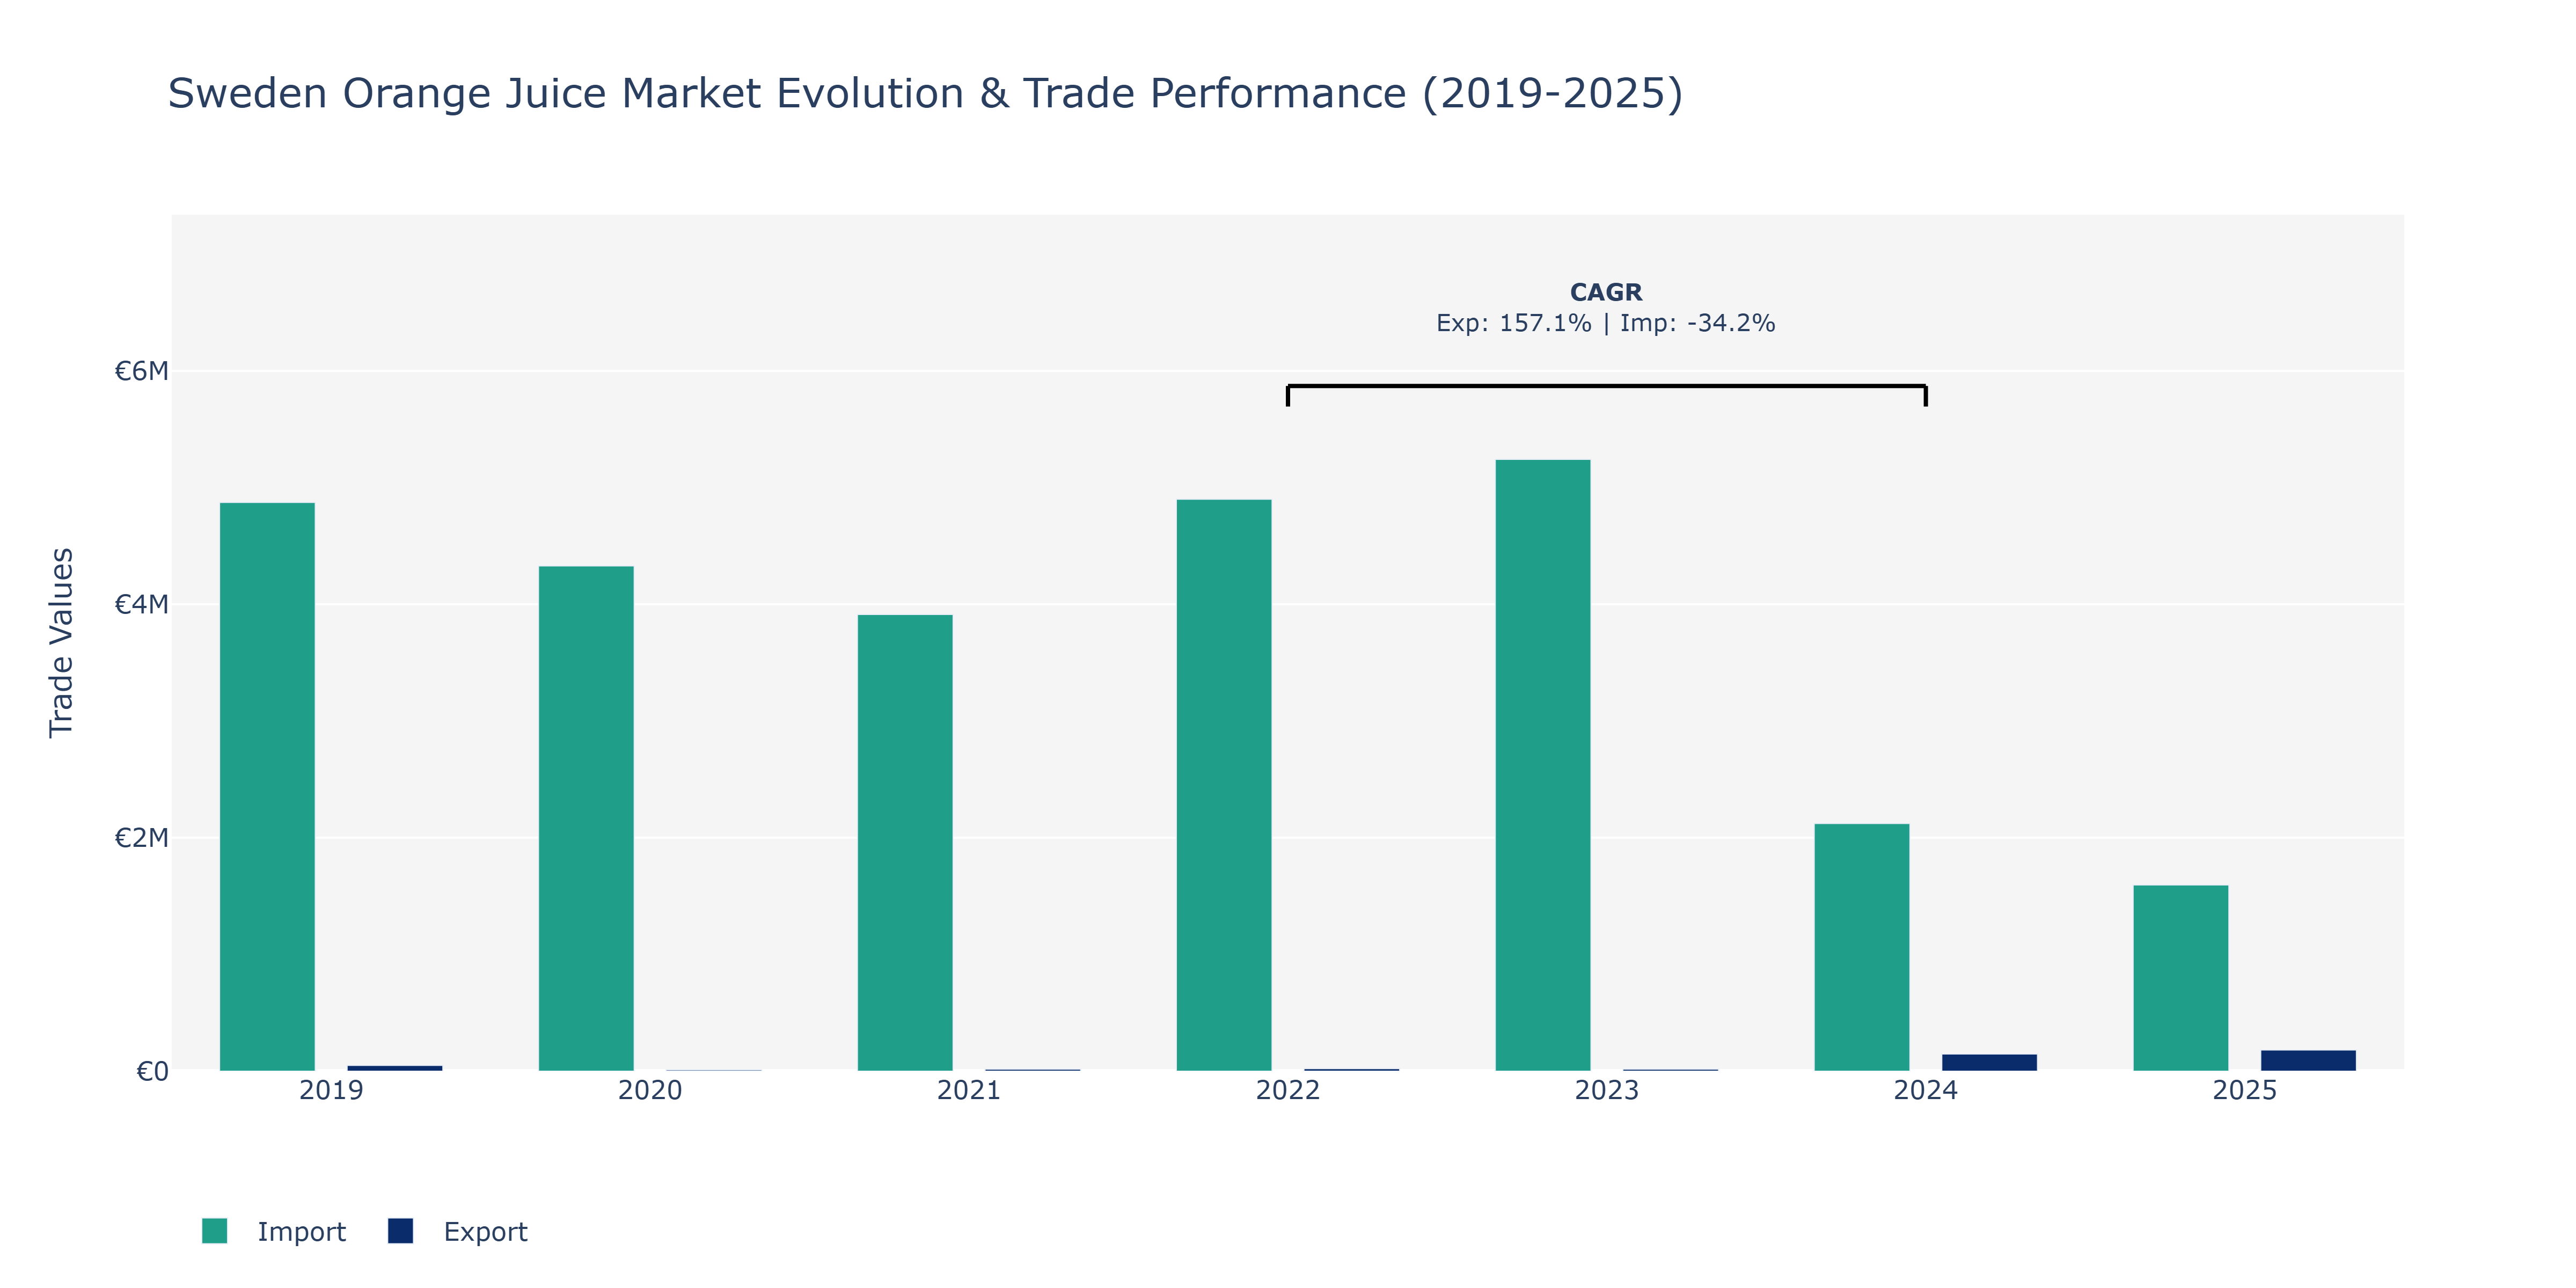
Between 2019 and 2025, the Sweden Orange Juice Market exhibited varying trends in exports and imports. Exports saw a substantial decline from €49.0 thousand in 2019 to €11.42 thousand in 2020, followed by a gradual recovery reaching €181.22 thousand in 2025. Conversely, imports fluctuated over the period, peaking at €5.24 million in 2023 and then dropping to €1.6 million in 2025. The surge in exports post-2020 could be attributed to an increase in demand for Swedish orange juice products internationally, likely due to enhanced marketing strategies and product quality improvements. On the other hand, the fluctuating Import value may reflect changes in domestic consumption patterns or shifts in global trade dynamics impacting the import of orange juice into Sweden. The contrasting trends in exports and imports emphasize the market's evolving dynamics and the need for industry players to adapt their strategies to meet changing consumer preferences and international trade conditions.
Key Highlights of the Report:
- Sweden Orange Juice Market Outlook
- Market Size of Sweden Orange Juice Market, 2025
- Forecast of Sweden Orange Juice Market, 2032
- Historical Data and Forecast of Sweden Orange Juice Revenues & Volume for the Period 2022 - 2032F
- Sweden Orange Juice Market Trend Evolution
- Sweden Orange Juice Market Drivers and Challenges
- Sweden Orange Juice Price Trends
- Sweden Orange Juice Porter`s Five Forces
- Sweden Orange Juice Industry Life Cycle
- Historical Data and Forecast of Sweden Orange Juice Market Revenues & Volume By Product Type for the Period 2022 - 2032F
- Historical Data and Forecast of Sweden Orange Juice Market Revenues & Volume By Frozen Concentrated Orange Juice for the Period 2022 - 2032F
- Historical Data and Forecast of Sweden Orange Juice Market Revenues & Volume By Not From Concentrate for the Period 2022 - 2032F
- Historical Data and Forecast of Sweden Orange Juice Market Revenues & Volume By Canned Orange Juice for the Period 2022 - 2032F
- Historical Data and Forecast of Sweden Orange Juice Market Revenues & Volume By Fresh-Squeezed Orange juice, for the Period 2022 - 2032F
- Historical Data and Forecast of Sweden Orange Juice Market Revenues & Volume By Dehydrated Orange Juice for the Period 2022 - 2032F
- Historical Data and Forecast of Sweden Orange Juice Market Revenues & Volume By Others for the Period 2022 - 2032F
- Historical Data and Forecast of Sweden Orange Juice Market Revenues & Volume By Packaging for the Period 2022 - 2032F
- Historical Data and Forecast of Sweden Orange Juice Market Revenues & Volume By Tetra Pak for the Period 2022 - 2032F
- Historical Data and Forecast of Sweden Orange Juice Market Revenues & Volume By PP Material Bottle for the Period 2022 - 2032F
- Historical Data and Forecast of Sweden Orange Juice Market Revenues & Volume By Metal Can for the Period 2022 - 2032F
- Historical Data and Forecast of Sweden Orange Juice Market Revenues & Volume By Others for the Period 2022 - 2032F
- Historical Data and Forecast of Sweden Orange Juice Market Revenues & Volume By Distribution Channel for the Period 2022 - 2032F
- Historical Data and Forecast of Sweden Orange Juice Market Revenues & Volume By Offline Channel for the Period 2022 - 2032F
- Historical Data and Forecast of Sweden Orange Juice Market Revenues & Volume By Online Channel for the Period 2022 - 2032F
- Sweden Orange Juice Import Export Trade Statistics
- Market Opportunity Assessment By Product Type
- Market Opportunity Assessment By Packaging
- Market Opportunity Assessment By Distribution Channel
- Sweden Orange Juice Top Companies Market Share
- Sweden Orange Juice Competitive Benchmarking By Technical and Operational Parameters
- Sweden Orange Juice Company Profiles
- Sweden Orange Juice Key Strategic Recommendations
Frequently Asked Questions About the Market Study (FAQs):
6Wresearch actively monitors the Sweden Orange Juice Market and publishes its comprehensive annual report, highlighting emerging trends, growth drivers, revenue analysis, and forecast outlook. Our insights help businesses to make data-backed strategic decisions with ongoing market dynamics. Our analysts track relevent industries related to the Sweden Orange Juice Market, allowing our clients with actionable intelligence and reliable forecasts tailored to emerging regional needs.
Yes, we provide customisation as per your requirements. To learn more, feel free to contact us on sales@6wresearch.com
1 Executive Summary |
2 Introduction |
2.1 Key Highlights of the Report |
2.2 Report Description |
2.3 Market Scope & Segmentation |
2.4 Research Methodology |
2.5 Assumptions |
3 Sweden Orange Juice Market Overview |
3.1 Sweden Country Macro Economic Indicators |
3.2 Sweden Orange Juice Market Revenues & Volume, 2022 & 2032F |
3.3 Sweden Orange Juice Market - Industry Life Cycle |
3.4 Sweden Orange Juice Market - Porter's Five Forces |
3.5 Sweden Orange Juice Market Revenues & Volume Share, By Product Type, 2022 & 2032F |
3.6 Sweden Orange Juice Market Revenues & Volume Share, By Packaging, 2022 & 2032F |
3.7 Sweden Orange Juice Market Revenues & Volume Share, By Distribution Channel, 2022 & 2032F |
4 Sweden Orange Juice Market Dynamics |
4.1 Impact Analysis |
4.2 Market Drivers |
4.2.1 Increasing health consciousness among consumers |
4.2.2 Growing demand for natural and nutritious beverages |
4.2.3 Rising disposable income leading to higher spending on premium products |
4.3 Market Restraints |
4.3.1 Seasonal availability of oranges impacting supply chain |
4.3.2 Competition from other beverage options like smoothies and energy drinks |
5 Sweden Orange Juice Market Trends |
6 Sweden Orange Juice Market Segmentations |
6.1 Sweden Orange Juice Market, By Product Type |
6.1.1 Overview and Analysis |
6.1.2 Sweden Orange Juice Market Revenues & Volume, By Frozen Concentrated Orange Juice, 2022 - 2032F |
6.1.3 Sweden Orange Juice Market Revenues & Volume, By Not From Concentrate, 2022 - 2032F |
6.1.4 Sweden Orange Juice Market Revenues & Volume, By Canned Orange Juice, 2022 - 2032F |
6.1.5 Sweden Orange Juice Market Revenues & Volume, By Fresh-Squeezed Orange juice,, 2022 - 2032F |
6.1.6 Sweden Orange Juice Market Revenues & Volume, By Dehydrated Orange Juice, 2022 - 2032F |
6.1.7 Sweden Orange Juice Market Revenues & Volume, By Others, 2022 - 2032F |
6.2 Sweden Orange Juice Market, By Packaging |
6.2.1 Overview and Analysis |
6.2.2 Sweden Orange Juice Market Revenues & Volume, By Tetra Pak, 2022 - 2032F |
6.2.3 Sweden Orange Juice Market Revenues & Volume, By PP Material Bottle, 2022 - 2032F |
6.2.4 Sweden Orange Juice Market Revenues & Volume, By Metal Can, 2022 - 2032F |
6.2.5 Sweden Orange Juice Market Revenues & Volume, By Others, 2022 - 2032F |
6.3 Sweden Orange Juice Market, By Distribution Channel |
6.3.1 Overview and Analysis |
6.3.2 Sweden Orange Juice Market Revenues & Volume, By Offline Channel, 2022 - 2032F |
6.3.3 Sweden Orange Juice Market Revenues & Volume, By Online Channel, 2022 - 2032F |
7 Sweden Orange Juice Market Import-Export Trade Statistics |
7.1 Sweden Orange Juice Market Export to Major Countries |
7.2 Sweden Orange Juice Market Imports from Major Countries |
8 Sweden Orange Juice Market Key Performance Indicators |
8.1 Consumer awareness of the health benefits of orange juice |
8.2 Number of new product launches and innovations in the orange juice market |
8.3 Growth in the organic orange juice segment |
9 Sweden Orange Juice Market - Opportunity Assessment |
9.1 Sweden Orange Juice Market Opportunity Assessment, By Product Type, 2022 & 2032F |
9.2 Sweden Orange Juice Market Opportunity Assessment, By Packaging, 2022 & 2032F |
9.3 Sweden Orange Juice Market Opportunity Assessment, By Distribution Channel, 2022 & 2032F |
10 Sweden Orange Juice Market - Competitive Landscape |
10.1 Sweden Orange Juice Market Revenue Share, By Companies, 2025 |
10.2 Sweden Orange Juice Market Competitive Benchmarking, By Operating and Technical Parameters |
11 Company Profiles |
12 Recommendations | 13 Disclaimer |
Global Go To Market Strategy - 2030
Export potential enables firms to identify high-growth global markets with greater confidence by combining advanced trade intelligence with a structured quantitative methodology. The framework analyzes emerging demand trends and country-level import patterns while integrating macroeconomic and trade datasets such as GDP and population forecasts, bilateral import–export flows, tariff structures, elasticity differentials between developed and developing economies, geographic distance, and import demand projections. Using weighted trade values from 2020–2024 as the base period to project country-to-country export potential for 2030, these inputs are operationalized through calculated drivers such as gravity model parameters, tariff impact factors, and projected GDP per-capita growth. Through an analysis of hidden potentials, demand hotspots, and market conditions that are most favorable to success, this method enables firms to focus on target countries, maximize returns, and global expansion with data, backed by accuracy.
By factoring in the projected importer demand gap that is currently unmet and could be potential opportunity, it identifies the potential for the Exporter (Country) among 190 countries, against the general trade analysis, which identifies the biggest importer or exporter.
To discover high-growth global markets and optimize your business strategy:
Click Here
Pricing
- Single User License$ 1,995
- Department License$ 2,400
- Site License$ 3,120
- Global License$ 3,795

Leadership Perspectives from Industry Events
Search
Thought Leadership and Analyst Meet


Our Clients
6WResearch In News
- India Export Attractiveness Tracker 2026
- India Air Conditioner Market Set for Strong Rebound in 2026 After Weather-Led Correction and GST-Driven Recovery: 6Wresearch
- ADAS in India: How Automatic Emergency Braking, Blind Spot Detection & Driver Monitoring are Transforming Road Safety
- Doha a strategic location for EV manufacturing hub: IPA Qatar
- Demand for luxury TVs surging in the GCC, says Samsung
- Empowering Growth: The Thriving Journey of Bangladesh’s Cable Industry
Latest Reports
- Nicaragua RPG Gaming Market (2026-2032)
- New Zealand RPG Gaming Market (2026-2032)
- Netherlands RPG Gaming Market (2026-2032)
- Nauru RPG Gaming Market (2026-2032)
- Namibia RPG Gaming Market (2026-2032)
- Mozambique RPG Gaming Market (2026-2032)
- Montenegro RPG Gaming Market (2026-2032)
- Mongolia RPG Gaming Market (2026-2032)
- Monaco RPG Gaming Market (2026-2032)
- Micronesia RPG Gaming Market (2026-2032)
Industry Events and Analyst Meet

EV India Expo 2026

HIMTEX 2026

India Refining Summit 2026

India EV Show 2026

EV tech India Expo 2026
Whitepaper
- Middle East & Africa Commercial Security Market Click here to view more.
- Middle East & Africa Fire Safety Systems & Equipment Market Click here to view more.
- GCC Drone Market Click here to view more.
- Middle East Lighting Fixture Market Click here to view more.
- GCC Physical & Perimeter Security Market Click here to view more.