Tanzania Activated Carbon Market Outlook | Revenue, Share, Forecast, Industry, Analysis, Size, Growth, Value, Trends, COVID-19 IMPACT & Companies
Market Forecast By Product (Powdered, Granular, Others), By Application (Liquid Phase, Gas Phase), By End-use (Water Treatment, Food & Beverage Processing, Pharmaceutical & Medical, Automotive, Air Purification, Others) And Competitive Landscape
| Product Code: ETC082634 | Publication Date: Jun 2021 | Updated Date: Jun 2025 | Product Type: Report | |
| Publisher: 6Wresearch | Author: Ravi Bhandari | No. of Pages: 70 | No. of Figures: 35 | No. of Tables: 5 |
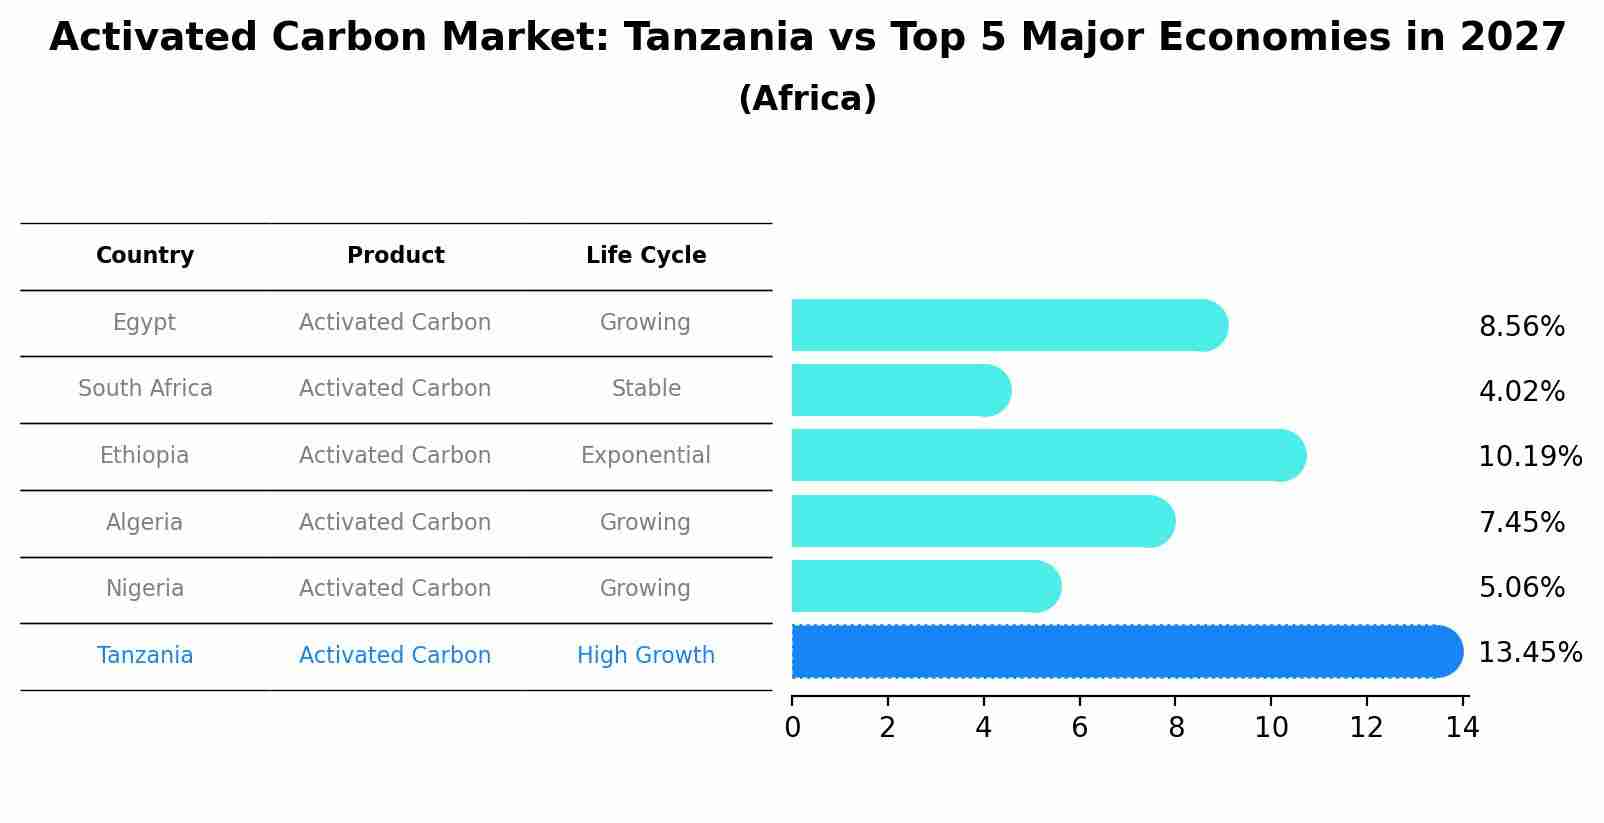
Activated Carbon Market: Tanzania vs Top 5 Major Economies in 2027 (Africa)
In the Africa region, the Activated Carbon market in Tanzania is projected to expand at a high growth rate of 13.45% by 2027. The largest economy is Egypt, followed by South Africa, Ethiopia, Algeria and Nigeria.
Tanzania Activated Carbon Market Overview
The Tanzania activated carbon market is witnessing steady growth driven by increasing demand across various industries such as water treatment, food and beverage, pharmaceuticals, and mining. Activated carbon is widely used for its adsorption properties in purifying water, air, and other liquids, as well as for decolorizing and deodorizing purposes. The country`s growing population, industrialization, and focus on environmental sustainability are contributing to the market expansion. Key players in the Tanzania activated carbon market include both domestic manufacturers and international companies catering to the diverse needs of the industrial sectors. With rising awareness about water and air pollution issues, the demand for activated carbon is expected to continue growing in Tanzania, presenting opportunities for market expansion and technological advancements in the coming years.
Tanzania Activated Carbon Market Trends
The Tanzania activated carbon market is experiencing growth driven by increasing demand across various industries such as water treatment, air purification, and food and beverage. The market is witnessing a trend towards the adoption of sustainable and eco-friendly activated carbon products due to rising environmental concerns. Additionally, the mining and manufacturing sectors in Tanzania are boosting the demand for activated carbon for applications like gold recovery and air pollution control. Key players in the market are focusing on product innovations to meet the evolving needs of customers and comply with stringent regulations. The market is expected to continue growing as industries prioritize quality and efficiency in their operations, driving the demand for high-performance activated carbon solutions.
Tanzania Activated Carbon Market Challenges
In the Tanzania Activated Carbon Market, some challenges faced include limited awareness and understanding of the benefits of activated carbon among potential end-users, inconsistent quality control standards leading to variable product quality, inadequate infrastructure for production and distribution, and competition from low-cost imported activated carbon products. Additionally, the lack of access to modern technology and equipment hinders the efficiency and capacity of local activated carbon producers, impacting their ability to meet market demand and compete effectively. Addressing these challenges will require investments in research and development, capacity building, and regulatory frameworks to promote quality standards and ensure a level playing field for local producers in the Tanzania Activated Carbon Market.
Tanzania Activated Carbon Market Investment Opportunities
In Tanzania, the activated carbon market presents promising investment opportunities due to the increasing demand for environmental solutions in industries such as water treatment, air purification, and gold mining. With the country`s growing industrial sector and focus on sustainable development, there is a rising need for high-quality activated carbon products. Investing in the production or distribution of activated carbon in Tanzania can be lucrative, especially with the potential for export opportunities to neighboring countries in East Africa. Additionally, government initiatives to address environmental challenges and regulations promoting the use of activated carbon further support the market`s growth. An investor could consider partnering with local manufacturers, exploring innovative production techniques, and establishing a strong distribution network to capitalize on the expanding market demand for activated carbon in Tanzania.
Tanzania Activated Carbon Market Government Policy
The Tanzanian government has implemented policies to promote the activated carbon market, focusing on sustainable production and environmental conservation. These policies include the establishment of guidelines for responsible sourcing of raw materials, such as coconut shells and wood, to ensure the protection of natural resources. Additionally, there are regulations in place to monitor the quality of activated carbon products to maintain industry standards and ensure consumer safety. The government also supports research and development initiatives to enhance technological advancements in activated carbon production. Overall, these policies aim to foster a competitive and environmentally friendly market for activated carbon in Tanzania.
Tanzania Activated Carbon Market Future Outlook
The Tanzania Activated Carbon Market is expected to witness steady growth in the coming years due to increasing industrial applications across various sectors such as water treatment, food and beverage, pharmaceuticals, and mining. The growing awareness about environmental sustainability and the need for efficient purification processes are driving the demand for activated carbon in Tanzania. Additionally, government regulations aimed at controlling air and water pollution are likely to further propel market growth. As industries continue to expand and invest in advanced technologies, the demand for high-quality activated carbon products is expected to rise. Market players are focusing on product innovation and strategic collaborations to gain a competitive edge in the market, making the Tanzania Activated Carbon Market a promising sector for investment and expansion opportunities.
Key Highlights of the Report:
- Tanzania Activated Carbon Market Outlook
- Market Size of Tanzania Activated Carbon Market, 2021
- Forecast of Tanzania Activated Carbon Market, 2027
- Historical Data and Forecast of Tanzania Activated Carbon Revenues & Volume for the Period 2018 - 2027
- Tanzania Activated Carbon Market Trend Evolution
- Tanzania Activated Carbon Market Drivers and Challenges
- Tanzania Activated Carbon Price Trends
- Tanzania Activated Carbon Porter's Five Forces
- Tanzania Activated Carbon Industry Life Cycle
- Historical Data and Forecast of Tanzania Activated Carbon Market Revenues & Volume By Product for the Period 2018 - 2027
- Historical Data and Forecast of Tanzania Activated Carbon Market Revenues & Volume By Powdered for the Period 2018 - 2027
- Historical Data and Forecast of Tanzania Activated Carbon Market Revenues & Volume By Granular for the Period 2018 - 2027
- Historical Data and Forecast of Tanzania Activated Carbon Market Revenues & Volume By Others for the Period 2018 - 2027
- Historical Data and Forecast of Tanzania Activated Carbon Market Revenues & Volume By Application for the Period 2018 - 2027
- Historical Data and Forecast of Tanzania Activated Carbon Market Revenues & Volume By Liquid Phase for the Period 2018 - 2027
- Historical Data and Forecast of Tanzania Activated Carbon Market Revenues & Volume By Gas Phase for the Period 2018 - 2027
- Historical Data and Forecast of Tanzania Activated Carbon Market Revenues & Volume By End-use for the Period 2018 - 2027
- Historical Data and Forecast of Tanzania Activated Carbon Market Revenues & Volume By Water Treatment for the Period 2018 - 2027
- Historical Data and Forecast of Tanzania Activated Carbon Market Revenues & Volume By Food & Beverage Processing for the Period 2018 - 2027
- Historical Data and Forecast of Tanzania Activated Carbon Market Revenues & Volume By Pharmaceutical & Medical for the Period 2018 - 2027
- Historical Data and Forecast of Tanzania Activated Carbon Market Revenues & Volume By Automotive for the Period 2018 - 2027
- Historical Data and Forecast of Tanzania Activated Carbon Market Revenues & Volume By Air Purification for the Period 2018 - 2027
- Historical Data and Forecast of Tanzania Activated Carbon Market Revenues & Volume By Others for the Period 2018 - 2027
- Tanzania Activated Carbon Import Export Trade Statistics
- Market Opportunity Assessment By Product
- Market Opportunity Assessment By Application
- Market Opportunity Assessment By End-use
- Tanzania Activated Carbon Top Companies Market Share
- Tanzania Activated Carbon Competitive Benchmarking By Technical and Operational Parameters
- Tanzania Activated Carbon Company Profiles
- Tanzania Activated Carbon Key Strategic Recommendations
Frequently Asked Questions About the Market Study (FAQs):
6Wresearch actively monitors the Tanzania Activated Carbon Market and publishes its comprehensive annual report, highlighting emerging trends, growth drivers, revenue analysis, and forecast outlook. Our insights help businesses to make data-backed strategic decisions with ongoing market dynamics. Our analysts track relevent industries related to the Tanzania Activated Carbon Market, allowing our clients with actionable intelligence and reliable forecasts tailored to emerging regional needs.
Yes, we provide customisation as per your requirements. To learn more, feel free to contact us on sales@6wresearch.com
1 Executive Summary |
2 Introduction |
2.1 Key Highlights of the Report |
2.2 Report Description |
2.3 Market Scope & Segmentation |
2.4 Research Methodology |
2.5 Assumptions |
3 Tanzania Activated Carbon Market Overview |
3.1 Tanzania Country Macro Economic Indicators |
3.2 Tanzania Activated Carbon Market Revenues & Volume, 2021 & 2027F |
3.3 Tanzania Activated Carbon Market - Industry Life Cycle |
3.4 Tanzania Activated Carbon Market - Porter's Five Forces |
3.5 Tanzania Activated Carbon Market Revenues & Volume Share, By Product, 2021 & 2027F |
3.6 Tanzania Activated Carbon Market Revenues & Volume Share, By Application, 2021 & 2027F |
3.7 Tanzania Activated Carbon Market Revenues & Volume Share, By End-use, 2021 & 2027F |
4 Tanzania Activated Carbon Market Dynamics |
4.1 Impact Analysis |
4.2 Market Drivers |
4.3 Market Restraints |
5 Tanzania Activated Carbon Market Trends |
6 Tanzania Activated Carbon Market, By Types |
6.1 Tanzania Activated Carbon Market, By Product |
6.1.1 Overview and Analysis |
6.1.2 Tanzania Activated Carbon Market Revenues & Volume, By Product, 2018 - 2027F |
6.1.3 Tanzania Activated Carbon Market Revenues & Volume, By Powdered, 2018 - 2027F |
6.1.4 Tanzania Activated Carbon Market Revenues & Volume, By Granular, 2018 - 2027F |
6.1.5 Tanzania Activated Carbon Market Revenues & Volume, By Others, 2018 - 2027F |
6.2 Tanzania Activated Carbon Market, By Application |
6.2.1 Overview and Analysis |
6.2.2 Tanzania Activated Carbon Market Revenues & Volume, By Liquid Phase, 2018 - 2027F |
6.2.3 Tanzania Activated Carbon Market Revenues & Volume, By Gas Phase, 2018 - 2027F |
6.3 Tanzania Activated Carbon Market, By End-use |
6.3.1 Overview and Analysis |
6.3.2 Tanzania Activated Carbon Market Revenues & Volume, By Water Treatment, 2018 - 2027F |
6.3.3 Tanzania Activated Carbon Market Revenues & Volume, By Food & Beverage Processing, 2018 - 2027F |
6.3.4 Tanzania Activated Carbon Market Revenues & Volume, By Pharmaceutical & Medical, 2018 - 2027F |
6.3.5 Tanzania Activated Carbon Market Revenues & Volume, By Automotive, 2018 - 2027F |
6.3.6 Tanzania Activated Carbon Market Revenues & Volume, By Air Purification, 2018 - 2027F |
6.3.7 Tanzania Activated Carbon Market Revenues & Volume, By Others, 2018 - 2027F |
7 Tanzania Activated Carbon Market Import-Export Trade Statistics |
7.1 Tanzania Activated Carbon Market Export to Major Countries |
7.2 Tanzania Activated Carbon Market Imports from Major Countries |
8 Tanzania Activated Carbon Market Key Performance Indicators |
9 Tanzania Activated Carbon Market - Opportunity Assessment |
9.1 Tanzania Activated Carbon Market Opportunity Assessment, By Product, 2021 & 2027F |
9.2 Tanzania Activated Carbon Market Opportunity Assessment, By Application, 2021 & 2027F |
9.3 Tanzania Activated Carbon Market Opportunity Assessment, By End-use, 2021 & 2027F |
10 Tanzania Activated Carbon Market - Competitive Landscape |
10.1 Tanzania Activated Carbon Market Revenue Share, By Companies, 2021 |
10.2 Tanzania Activated Carbon Market Competitive Benchmarking, By Operating and Technical Parameters |
11 Company Profiles |
12 Recommendations |
13 Disclaimer |
Global Go To Market Strategy - 2030
Export potential enables firms to identify high-growth global markets with greater confidence by combining advanced trade intelligence with a structured quantitative methodology. The framework analyzes emerging demand trends and country-level import patterns while integrating macroeconomic and trade datasets such as GDP and population forecasts, bilateral import–export flows, tariff structures, elasticity differentials between developed and developing economies, geographic distance, and import demand projections. Using weighted trade values from 2020–2024 as the base period to project country-to-country export potential for 2030, these inputs are operationalized through calculated drivers such as gravity model parameters, tariff impact factors, and projected GDP per-capita growth. Through an analysis of hidden potentials, demand hotspots, and market conditions that are most favorable to success, this method enables firms to focus on target countries, maximize returns, and global expansion with data, backed by accuracy.
By factoring in the projected importer demand gap that is currently unmet and could be potential opportunity, it identifies the potential for the Exporter (Country) among 190 countries, against the general trade analysis, which identifies the biggest importer or exporter.
To discover high-growth global markets and optimize your business strategy:
Click Here
Pricing
- Single User License$ 1,995
- Department License$ 2,400
- Site License$ 3,120
- Global License$ 3,795

Leadership Perspectives from Industry Events
Search
Thought Leadership and Analyst Meet


Our Clients
6WResearch In News
- India Air Conditioner Market Set for Strong Rebound in 2026 After Weather-Led Correction and GST-Driven Recovery: 6Wresearch
- ADAS in India: How Automatic Emergency Braking, Blind Spot Detection & Driver Monitoring are Transforming Road Safety
- Doha a strategic location for EV manufacturing hub: IPA Qatar
- Demand for luxury TVs surging in the GCC, says Samsung
- Empowering Growth: The Thriving Journey of Bangladesh’s Cable Industry
- Demand for luxury TVs surging in the GCC, says Samsung
Latest Reports
- Poland Fire Protection Systems Market (2026-2032)
- Cape Verde Portable Hand-Thrown Extinguisher Market (2026-2032)
- Canada Portable Hand-Thrown Extinguisher Market (2026-2032)
- Cameroon Portable Hand-Thrown Extinguisher Market (2026-2032)
- Burundi Portable Hand-Thrown Extinguisher Market (2026-2032)
- Burkina Faso Portable Hand-Thrown Extinguisher Market (2026-2032)
- Bulgaria Portable Hand-Thrown Extinguisher Market (2026-2032)
- Brunei Portable Hand-Thrown Extinguisher Market (2026-2032)
- Botswana Portable Hand-Thrown Extinguisher Market (2026-2032)
- Bosnia and Herzegovina Portable Hand-Thrown Extinguisher Market (2026-2032)
Industry Events and Analyst Meet

HIMTEX 2026

India Refining Summit 2026

India EV Show 2026

EV tech India Expo 2026

Auto Tech Asia 2026
Whitepaper
- Middle East & Africa Commercial Security Market Click here to view more.
- Middle East & Africa Fire Safety Systems & Equipment Market Click here to view more.
- GCC Drone Market Click here to view more.
- Middle East Lighting Fixture Market Click here to view more.
- GCC Physical & Perimeter Security Market Click here to view more.