Tanzania Chlorine Market (2025-2031) Outlook | Revenue, Analysis, Industry, Companies, Share, Size, Trends, Value, Forecast & Growth
Market Forecast By Application (EDC/PVC, Isocyanates and Oxygenates, Chloromethanes, Solvents and Epichlorohydrin, Inorganic Chemicals, Other Applications), By End-user Industry (Water Treatment, Pharmaceutical, Chemicals, Paper and Pulp, Plastic, Pesticides, Other End-user Industries) And Competitive Landscape
| Product Code: ETC191287 | Publication Date: May 2022 | Updated Date: Aug 2025 | Product Type: Market Research Report | |
| Publisher: 6Wresearch | Author: Dhaval Chaurasia | No. of Pages: 60 | No. of Figures: 40 | No. of Tables: 7 |
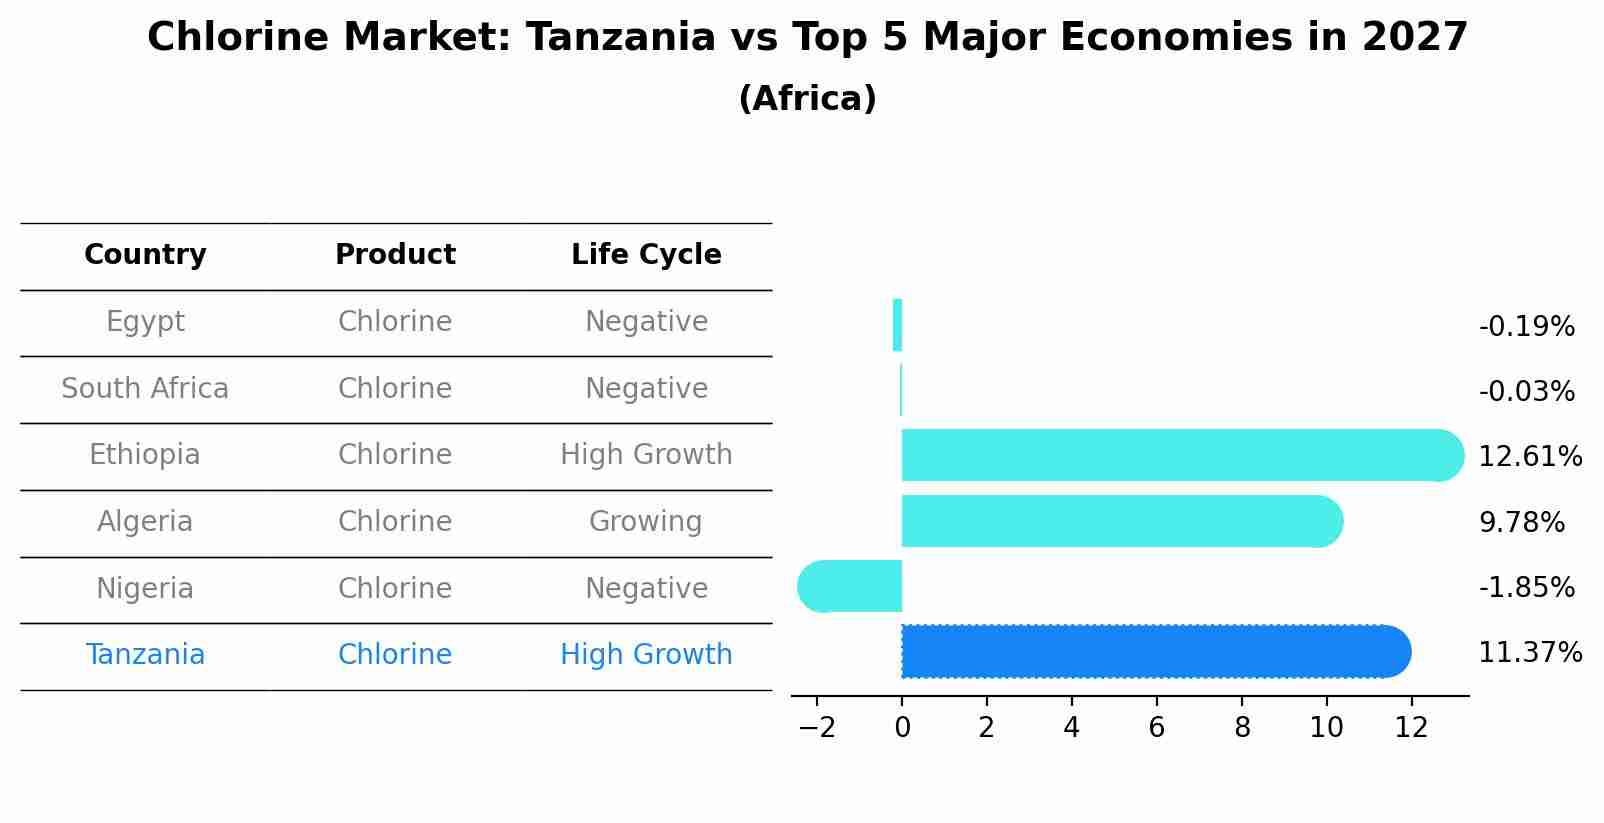
Chlorine Market: Tanzania vs Top 5 Major Economies in 2027 (Africa)
By 2027, the Chlorine market in Tanzania is anticipated to reach a growth rate of 11.37%, as part of an increasingly competitive Africa region, where Egypt remains at the forefront, supported by South Africa, Ethiopia, Algeria and Nigeria, driving innovations and market adoption across sectors.
Tanzania Chlorine Market Overview
The Tanzania Chlorine Market is driven primarily by the country`s growing water treatment industry, as well as demand from the textile, paper, and chemical industries. Chlorine is a key chemical used for disinfection and water treatment, essential for ensuring safe drinking water and sanitation. The market is also influenced by government regulations focusing on improving water quality and sanitation standards across the country. Key players in the Tanzania Chlorine Market include chemical manufacturers such as Tata Chemicals, BASF, and AkzoNobel. There is a growing trend towards sustainable practices in the industry, with an increasing focus on the use of eco-friendly chlorine products. Overall, the Tanzania Chlorine Market is expected to continue growing steadily in the coming years, driven by increasing industrial activities and government initiatives promoting clean water and sanitation.
Tanzania Chlorine Market Trends
The Tanzania Chlorine Market is experiencing a steady growth trend driven by the increasing demand for clean water and sanitation infrastructure development in the country. The market is witnessing a rise in the adoption of chlorine-based water treatment solutions by municipalities, industries, and households to ensure safe drinking water and maintain hygiene standards. Additionally, the growing awareness about the importance of water disinfection in preventing waterborne diseases is fueling the demand for chlorine products. Companies operating in the Tanzania Chlorine Market are focusing on innovation to develop more efficient and eco-friendly chlorine products to meet the evolving needs of consumers and comply with environmental regulations. Overall, the market is expected to continue its growth trajectory in the coming years, supported by ongoing investments in water treatment infrastructure and increasing emphasis on public health and sanitation.
Tanzania Chlorine Market Challenges
In the Tanzania Chlorine Market, one of the key challenges faced is the limited awareness and education among consumers about the importance of water treatment and disinfection using chlorine products. This lack of understanding often leads to lower demand for chlorine products, hindering market growth. Additionally, infrastructure limitations and inconsistent supply chains can result in difficulties in distributing chlorine products to remote areas in Tanzania. Furthermore, price fluctuations of raw materials used in chlorine production and regulatory constraints can also pose challenges for manufacturers and suppliers operating in the market. Overcoming these obstacles would require targeted educational campaigns, investment in infrastructure development, and strategic partnerships to ensure reliable supply and distribution of chlorine products throughout the country.
Tanzania Chlorine Market Investment Opportunities
The Tanzania Chlorine Market presents promising investment opportunities due to the country`s growing water treatment and sanitation industry. With increasing urbanization and industrialization, the demand for chlorine as a key disinfectant for water purification is expected to rise. Investors can consider opportunities in chlorine production facilities, distribution networks, and related equipment and technologies. Additionally, investing in research and development for innovative chlorine-based products tailored to local needs could also be a lucrative strategy. As Tanzania prioritizes improving access to clean water and sanitation facilities, investing in the chlorine market aligns with the country`s development goals and offers potential for long-term growth and impact.
Tanzania Chlorine Market Government Policy
In Tanzania, the government has implemented policies to regulate the chlorine market, particularly in terms of safety and environmental standards. The Tanzania Bureau of Standards (TBS) has set specific regulations for the production, importation, and distribution of chlorine products to ensure quality control and consumer safety. Additionally, the government has established guidelines for the safe handling and disposal of chlorine to prevent environmental contamination and health risks. Companies operating in the chlorine market in Tanzania are required to adhere to these regulations to maintain compliance and protect public health and the environment. Overall, government policies in Tanzania aim to promote responsible practices within the chlorine market to safeguard both consumers and the ecosystem.
Tanzania Chlorine Market Future Outlook
The Tanzania Chlorine Market is expected to experience steady growth in the coming years, driven by the increasing demand from various industries such as water treatment, pharmaceuticals, and chemical manufacturing. The growing emphasis on sanitation and water quality in Tanzania is also expected to fuel the demand for chlorine products. Additionally, the government`s initiatives to improve water infrastructure and promote industrial development are likely to boost the market further. However, challenges such as environmental concerns and regulatory issues regarding the use of chlorine may impact market growth. Overall, with the expanding industrial sector and rising awareness about hygiene practices, the Tanzania Chlorine Market is poised for gradual expansion and opportunities for both domestic and international suppliers.
Key Highlights of the Report:
- Tanzania Chlorine Market Outlook
- Market Size of Tanzania Chlorine Market, 2024
- Forecast of Tanzania Chlorine Market, 2031
- Historical Data and Forecast of Tanzania Chlorine Revenues & Volume for the Period 2021 - 2031
- Tanzania Chlorine Market Trend Evolution
- Tanzania Chlorine Market Drivers and Challenges
- Tanzania Chlorine Price Trends
- Tanzania Chlorine Porter's Five Forces
- Tanzania Chlorine Industry Life Cycle
- Historical Data and Forecast of Tanzania Chlorine Market Revenues & Volume By Application for the Period 2021 - 2031
- Historical Data and Forecast of Tanzania Chlorine Market Revenues & Volume By EDC/PVC for the Period 2021 - 2031
- Historical Data and Forecast of Tanzania Chlorine Market Revenues & Volume By Isocyanates and Oxygenates for the Period 2021 - 2031
- Historical Data and Forecast of Tanzania Chlorine Market Revenues & Volume By Chloromethanes for the Period 2021 - 2031
- Historical Data and Forecast of Tanzania Chlorine Market Revenues & Volume By Solvents and Epichlorohydrin for the Period 2021 - 2031
- Historical Data and Forecast of Tanzania Chlorine Market Revenues & Volume By Inorganic Chemicals for the Period 2021 - 2031
- Historical Data and Forecast of Tanzania Chlorine Market Revenues & Volume By Other Applications for the Period 2021 - 2031
- Historical Data and Forecast of Tanzania Chlorine Market Revenues & Volume By End-user Industry for the Period 2021 - 2031
- Historical Data and Forecast of Tanzania Chlorine Market Revenues & Volume By Water Treatment for the Period 2021 - 2031
- Historical Data and Forecast of Tanzania Chlorine Market Revenues & Volume By Pharmaceutical for the Period 2021 - 2031
- Historical Data and Forecast of Tanzania Chlorine Market Revenues & Volume By Chemicals for the Period 2021 - 2031
- Historical Data and Forecast of Tanzania Chlorine Market Revenues & Volume By Paper and Pulp for the Period 2021 - 2031
- Historical Data and Forecast of Tanzania Chlorine Market Revenues & Volume By Plastic for the Period 2021 - 2031
- Historical Data and Forecast of Tanzania Chlorine Market Revenues & Volume By Pesticides for the Period 2021 - 2031
- Historical Data and Forecast of Tanzania Chlorine Market Revenues & Volume By Other End-user Industries for the Period 2021 - 2031
- Tanzania Chlorine Import Export Trade Statistics
- Market Opportunity Assessment By Application
- Market Opportunity Assessment By End-user Industry
- Tanzania Chlorine Top Companies Market Share
- Tanzania Chlorine Competitive Benchmarking By Technical and Operational Parameters
- Tanzania Chlorine Company Profiles
- Tanzania Chlorine Key Strategic Recommendations
Frequently Asked Questions About the Market Study (FAQs):
6Wresearch actively monitors the Tanzania Chlorine Market and publishes its comprehensive annual report, highlighting emerging trends, growth drivers, revenue analysis, and forecast outlook. Our insights help businesses to make data-backed strategic decisions with ongoing market dynamics. Our analysts track relevent industries related to the Tanzania Chlorine Market, allowing our clients with actionable intelligence and reliable forecasts tailored to emerging regional needs.
Yes, we provide customisation as per your requirements. To learn more, feel free to contact us on sales@6wresearch.com
1 Executive Summary |
2 Introduction |
2.1 Key Highlights of the Report |
2.2 Report Description |
2.3 Market Scope & Segmentation |
2.4 Research Methodology |
2.5 Assumptions |
3 Tanzania Chlorine Market Overview |
3.1 Tanzania Country Macro Economic Indicators |
3.2 Tanzania Chlorine Market Revenues & Volume, 2021 & 2031F |
3.3 Tanzania Chlorine Market - Industry Life Cycle |
3.4 Tanzania Chlorine Market - Porter's Five Forces |
3.5 Tanzania Chlorine Market Revenues & Volume Share, By Application, 2021 & 2031F |
3.6 Tanzania Chlorine Market Revenues & Volume Share, By End-user Industry, 2021 & 2031F |
4 Tanzania Chlorine Market Dynamics |
4.1 Impact Analysis |
4.2 Market Drivers |
4.2.1 Increasing demand for water treatment in Tanzania due to growing population and industrial activities |
4.2.2 Rising awareness about the importance of maintaining water quality and sanitation |
4.2.3 Government initiatives to improve water quality and sanitation in the country |
4.3 Market Restraints |
4.3.1 Fluctuating prices of raw materials used in chlorine production |
4.3.2 Lack of proper infrastructure for chlorine production and distribution |
4.3.3 Environmental concerns associated with chlorine usage |
5 Tanzania Chlorine Market Trends |
6 Tanzania Chlorine Market, By Types |
6.1 Tanzania Chlorine Market, By Application |
6.1.1 Overview and Analysis |
6.1.2 Tanzania Chlorine Market Revenues & Volume, By Application, 2021 - 2031F |
6.1.3 Tanzania Chlorine Market Revenues & Volume, By EDC/PVC, 2021 - 2031F |
6.1.4 Tanzania Chlorine Market Revenues & Volume, By Isocyanates and Oxygenates, 2021 - 2031F |
6.1.5 Tanzania Chlorine Market Revenues & Volume, By Chloromethanes, 2021 - 2031F |
6.1.6 Tanzania Chlorine Market Revenues & Volume, By Solvents and Epichlorohydrin, 2021 - 2031F |
6.1.7 Tanzania Chlorine Market Revenues & Volume, By Inorganic Chemicals, 2021 - 2031F |
6.1.8 Tanzania Chlorine Market Revenues & Volume, By Other Applications, 2021 - 2031F |
6.2 Tanzania Chlorine Market, By End-user Industry |
6.2.1 Overview and Analysis |
6.2.2 Tanzania Chlorine Market Revenues & Volume, By Water Treatment, 2021 - 2031F |
6.2.3 Tanzania Chlorine Market Revenues & Volume, By Pharmaceutical, 2021 - 2031F |
6.2.4 Tanzania Chlorine Market Revenues & Volume, By Chemicals, 2021 - 2031F |
6.2.5 Tanzania Chlorine Market Revenues & Volume, By Paper and Pulp, 2021 - 2031F |
6.2.6 Tanzania Chlorine Market Revenues & Volume, By Plastic, 2021 - 2031F |
6.2.7 Tanzania Chlorine Market Revenues & Volume, By Pesticides, 2021 - 2031F |
7 Tanzania Chlorine Market Import-Export Trade Statistics |
7.1 Tanzania Chlorine Market Export to Major Countries |
7.2 Tanzania Chlorine Market Imports from Major Countries |
8 Tanzania Chlorine Market Key Performance Indicators |
8.1 Percentage increase in the number of water treatment facilities using chlorine |
8.2 Level of compliance with water quality standards set by regulatory authorities |
8.3 Adoption rate of alternative water treatment technologies as compared to chlorine-based methods |
9 Tanzania Chlorine Market - Opportunity Assessment |
9.1 Tanzania Chlorine Market Opportunity Assessment, By Application, 2021 & 2031F |
9.2 Tanzania Chlorine Market Opportunity Assessment, By End-user Industry, 2021 & 2031F |
10 Tanzania Chlorine Market - Competitive Landscape |
10.1 Tanzania Chlorine Market Revenue Share, By Companies, 2024 |
10.2 Tanzania Chlorine Market Competitive Benchmarking, By Operating and Technical Parameters |
11 Company Profiles |
12 Recommendations |
13 Disclaimer |
Global Go To Market Strategy - 2030
Export potential enables firms to identify high-growth global markets with greater confidence by combining advanced trade intelligence with a structured quantitative methodology. The framework analyzes emerging demand trends and country-level import patterns while integrating macroeconomic and trade datasets such as GDP and population forecasts, bilateral import–export flows, tariff structures, elasticity differentials between developed and developing economies, geographic distance, and import demand projections. Using weighted trade values from 2020–2024 as the base period to project country-to-country export potential for 2030, these inputs are operationalized through calculated drivers such as gravity model parameters, tariff impact factors, and projected GDP per-capita growth. Through an analysis of hidden potentials, demand hotspots, and market conditions that are most favorable to success, this method enables firms to focus on target countries, maximize returns, and global expansion with data, backed by accuracy.
By factoring in the projected importer demand gap that is currently unmet and could be potential opportunity, it identifies the potential for the Exporter (Country) among 190 countries, against the general trade analysis, which identifies the biggest importer or exporter.
To discover high-growth global markets and optimize your business strategy:
Click Here
Pricing
- Single User License$ 1,995
- Department License$ 2,400
- Site License$ 3,120
- Global License$ 3,795

Leadership Perspectives from Industry Events
Search
Thought Leadership and Analyst Meet


Our Clients
6WResearch In News
- India Air Conditioner Market Set for Strong Rebound in 2026 After Weather-Led Correction and GST-Driven Recovery: 6Wresearch
- ADAS in India: How Automatic Emergency Braking, Blind Spot Detection & Driver Monitoring are Transforming Road Safety
- Doha a strategic location for EV manufacturing hub: IPA Qatar
- Demand for luxury TVs surging in the GCC, says Samsung
- Empowering Growth: The Thriving Journey of Bangladesh’s Cable Industry
- Demand for luxury TVs surging in the GCC, says Samsung
Latest Reports
- Poland Fire Protection Systems Market (2026-2032)
- Cape Verde Portable Hand-Thrown Extinguisher Market (2026-2032)
- Canada Portable Hand-Thrown Extinguisher Market (2026-2032)
- Cameroon Portable Hand-Thrown Extinguisher Market (2026-2032)
- Burundi Portable Hand-Thrown Extinguisher Market (2026-2032)
- Burkina Faso Portable Hand-Thrown Extinguisher Market (2026-2032)
- Bulgaria Portable Hand-Thrown Extinguisher Market (2026-2032)
- Brunei Portable Hand-Thrown Extinguisher Market (2026-2032)
- Botswana Portable Hand-Thrown Extinguisher Market (2026-2032)
- Bosnia and Herzegovina Portable Hand-Thrown Extinguisher Market (2026-2032)
Industry Events and Analyst Meet

HIMTEX 2026

India Refining Summit 2026

India EV Show 2026

EV tech India Expo 2026

Auto Tech Asia 2026
Whitepaper
- Middle East & Africa Commercial Security Market Click here to view more.
- Middle East & Africa Fire Safety Systems & Equipment Market Click here to view more.
- GCC Drone Market Click here to view more.
- Middle East Lighting Fixture Market Click here to view more.
- GCC Physical & Perimeter Security Market Click here to view more.