Tunisia Power Supply Market (2026-2032) | Outlook, Trends, Analysis, Industry, Share, Value, Forecast, Companies, Revenue, Size & Growth
Market Forecast By Output Power (Power Supply With Low Output (500 W and Below), Power Supply With Medium Output (500–1,000 W), Power Supply With High Output (More Than 1,000 W)), By Type (AC-DC Power Supply, DC-DC Power Supply), By Vertical (Medical & Healthcare, Military & Aerospace, Telecommunications, Consumer Electronics, Transportation, Lighting, Food & Beverages, Industrial) And Competitive Landscape
| Product Code: ETC014234 | Publication Date: Oct 2020 | Updated Date: Jun 2026 | Product Type: Report | |
| Publisher: 6Wresearch | Author: Ravi Bhandari | No. of Pages: 70 | No. of Figures: 35 | No. of Tables: 5 |
Tunisia Power Supply Market Summary
The tunisia power supply market was estimated at USD 198 Million in 2025 and is projected to reach USD 273 Million by 2032, growing at a CAGR of 5.8% from 2026 to 2032.
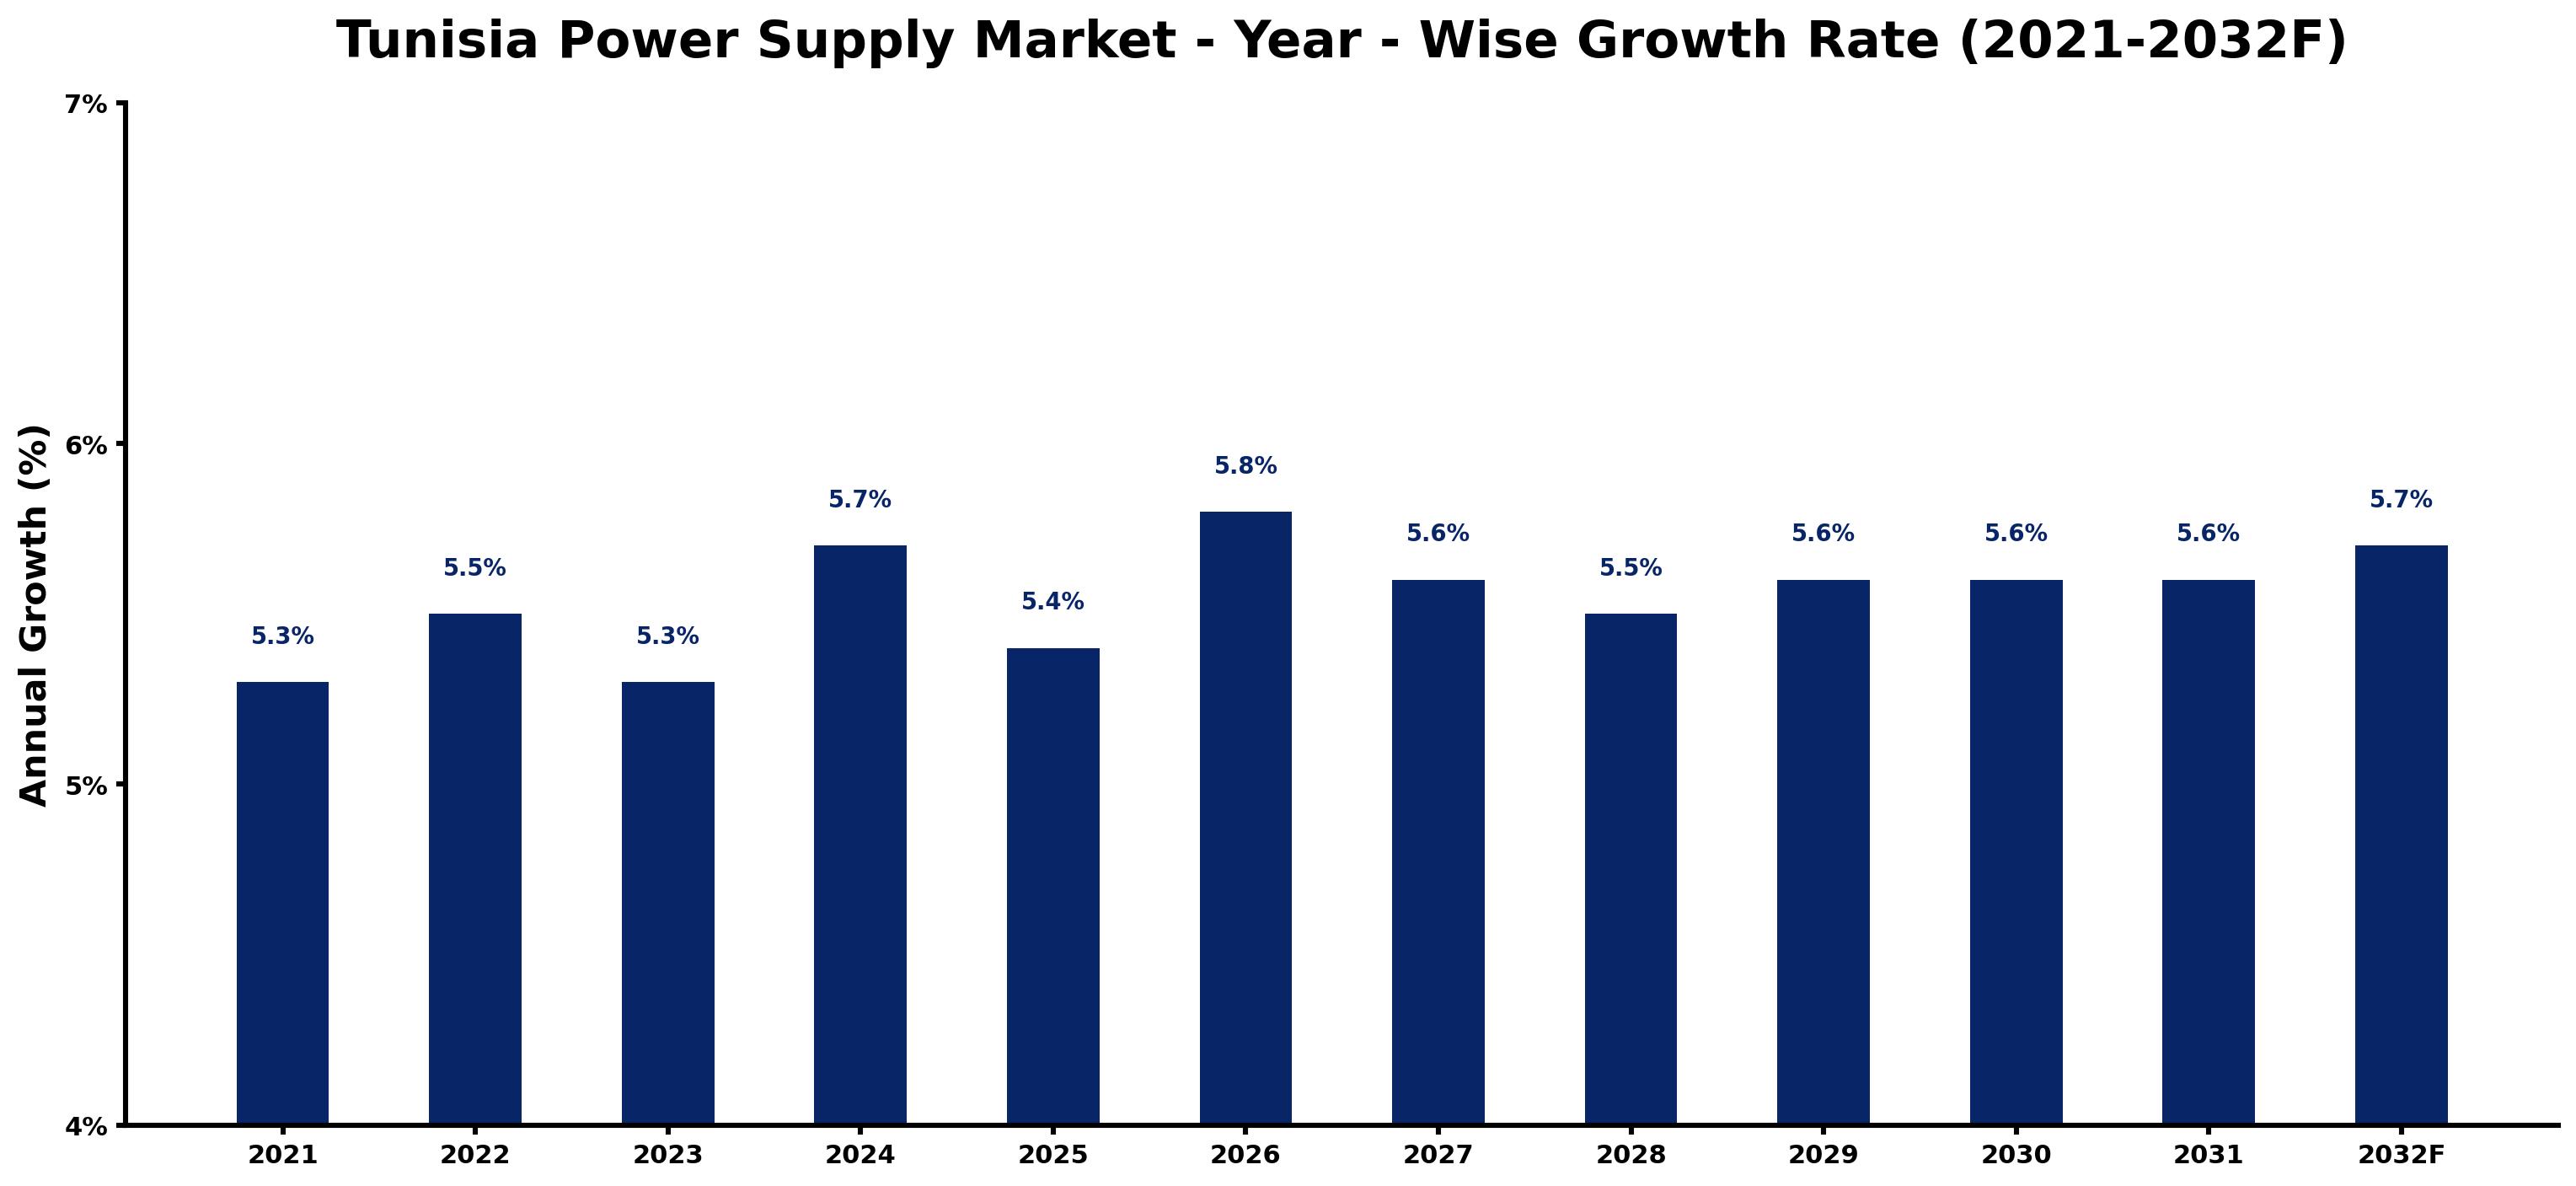
Tunisia Power Supply Market Growth Rate Analysis (2021-2032)
The Tunisia Power Supply market has shown a steady annual growth rate, with an increase from 5.3% in 2021 to a projected 5.7% in 2024, indicating a robust demand for energy solutions driven by industrial expansion and rising consumer needs. Factors contributing to this growth include ongoing investments in renewable infrastructure and a governmental push towards energy transition, which align with global sustainability trends. Despite slight fluctuations, such as a dip to 5.3% in 2023, the market rebounded to an anticipated 5.8% in 2026, supported by advancements in technology and digitalization that enhance energy efficiency. This evolving landscape underscores Tunisia's commitment to diversifying its energy offerings and meeting growing consumer expectations.
Tunisia Power Supply Market Year-wise Growth Rate and Key Drivers
This graph highlights how the Tunisia Power Supply Market has steadily grown over the past five years, supported by major growth factors.
The table below presents the year wise growth rates along with the key drivers influencing the market
| Year | Growth Rate | Major Drivers |
| 2021 | 5.3% | Energy diversification efforts underscore the need for renewable energy solutions. |
| 2022 | 5.5% | Investment in solar farms reflects Tunisia's abundant sunlight and energy potential. |
| 2023 | 5.3% | Rising urbanization trends create increased electricity consumption in major cities. |
| 2024 | 5.7% | Infrastructure upgrades enhance grid reliability, reducing outages across the country. |
| 2025 | 5.4% | Emerging private sector players challenge incumbents, fostering competitive pricing models. |
| 2026 | 5.8% | Local manufacturing of solar equipment reduces dependence on imported technologies. |
| 2027 | 5.6% | Technological partnerships enhance energy efficiency, minimizing operational costs for utilities. |
| 2028 | 5.5% | International financing institutions boost funding for sustainability-driven projects. |
| 2029 | 5.6% | Climate change initiatives align with global trends towards cleaner energy sources. |
| 2030 | 5.6% | Public awareness campaigns educate citizens on energy conservation practices. |
| 2031 | 5.6% | Smart grid implementations enable better demand management and energy distribution. |
| 2032 | 5.7% | Collaborations with neighboring countries improve regional power-sharing capabilities. |
Note - Market size estimations and growth projections presented in this report are based on 6Wresearch's advanced forecasting approach, validated with industry datasets as of June 2026.
Tunisia Power Supply Market Synopsis
The Tunisia Power Supply Market is projected to reach 5.8% and witness significant growth during the forecast period (2026-2032). As the country progresses through a phase of escalating industrialization and urbanization, the demand for electricity is soaring, necessitating robust responses from industry stakeholders and policymakers alike. The integration of renewable energy alongside the enhancement of transmission infrastructure is pivotal in shaping the market dynamics.
Tunisia Power Supply Market Growth Drivers
The growth trajectory of the Tunisia Power Supply Market is primarily driven by several interrelated factors:
- Increasing electricity consumption is a critical driver. As residential and commercial sectors expand, the demand for reliable power supply escalates, prompting investments in capacity expansion and innovative solutions.
- Urbanization trends are significantly influencing market dynamics. The continuous migration to urban centers creates heightened demand for basic utilities, including electricity, fostering a need for an efficient power supply infrastructure.
- Industrialization is enhancing the demand for dependable energy sources. As Tunisia focuses on boosting its industrial output, the need for uninterrupted power supply systems, such as uninterruptible power supplies (UPS), has become increasingly pressing.
- The growing emphasis on renewable energy adoption is reshaping the market landscape. Government incentives and global trends towards sustainability are leading to significant investments in solar and wind energy projects.
- Technological advancements in energy efficiency are lowering operational costs. Innovations in smart grid technology and energy storage are aiding suppliers in managing electricity distribution more effectively.
Tunisia Power Supply Market Challenges and Restraints
Despite its promising growth prospects, the Tunisia Power Supply Market faces several challenges that require strategic management:
- Balancing supply and demand remains a notable challenge, particularly with fluctuating energy policies and economic uncertainties impacting consumption patterns.
- Grid stability and reliability are essential for integrating renewable sources. Achieving this goal entails significant investments in modernizing infrastructure and embracing technological solutions.
- Inequity in energy access persists, especially in rural and underserved regions. Policymakers strive to address these disparities to ensure that all segments of the population can benefit from reliable electricity.
- The dependence on imported fuels for power generation poses risks to energy security. Diversification of energy sources is necessary to mitigate this vulnerability.
- Regulatory challenges may hinder progress and investment in the power sector. As policies evolve, aligning them with market needs is critical for sustainable development.
Tunisia Power Supply Market Government Investment and Initiatives
The Tunisian government is actively implementing policies aimed at diversifying its energy portfolio while reducing reliance on imported fossil fuels. To facilitate this transition, several key initiatives have been established:
- Promoting renewable energy projects through favorable regulatory frameworks to encourage private sector participation and investment in wind and solar energy.
- Implementing policies that ensure the affordability of electricity tariffs for consumers, especially in lower-income demographics, thereby enhancing energy accessibility.
- Investing in modernizing the grid infrastructure to support the integration of distributed energy resources, ensuring a more resilient and stable power supply.
- Supporting public-private partnerships to accelerate investment in energy infrastructure, thereby driving technological advancements and capacity building.
- Establishing energy efficiency programs aimed at reducing consumption, decreasing costs, and promoting sustainable practices across various sectors.
Tunisia Power Supply Market Latest Developments (May 2025 - June 2026)
Recent developments in the Tunisia Power Supply Market indicate a proactive approach towards addressing both challenges and opportunities within the sector:
- The government has increased its focus on attracting foreign investment in renewable energy technologies, leading to collaborative projects with international stakeholders.
- A series of initiatives aimed at improving energy efficiency in industrial operations have been introduced, showcasing a commitment to sustainable practices.
- Public awareness campaigns regarding energy conservation and the benefits of renewable energy usage have gained momentum, aimed at fostering community involvement.
- Investments in smart grid technology have been prioritized, enhancing the capacity of the existing infrastructure to accommodate renewable energy sources.
- Strategic partnerships between government entities and research institutions have been formed to promote innovation in energy solutions, aligning with global sustainable development goals.
Tunisia Power Supply Market - Key Attractiveness of the Report
- 10 Years of Market Numbers
- Historical Data Starting from 2022 to 2025
- Base Year: 2025
- Forecast Data until 2032
- Key Performance Indicators Impacting the Market
- Major Upcoming Developments and Projects
Key Highlights of the Report:
- Tunisia Power Supply Market Outlook
- Market Size of Tunisia Power Supply Market, 2025
- Forecast of Tunisia Power Supply Market, 2032
- Historical Data and Forecast of Tunisia Power Supply Revenues & Volume for the Period 2022-2032F
- Tunisia Power Supply Market Trend Evolution
- Tunisia Power Supply Market Drivers and Challenges
- Tunisia Power Supply Price Trends
- Tunisia Power Supply Porter's Five Forces
- Tunisia Power Supply Industry Life Cycle
- Historical Data and Forecast of Tunisia Power Supply Market Revenues & Volume By Output Power for the Period 2022-2032F
- Historical Data and Forecast of Tunisia Power Supply Market Revenues & Volume By Power Supply With Low Output (500 W and Below) for the Period 2022-2032F
- Historical Data and Forecast of Tunisia Power Supply Market Revenues & Volume By Power Supply With Medium Output (500?1,000 W) for the Period 2022-2032F
- Historical Data and Forecast of Tunisia Power Supply Market Revenues & Volume By Power Supply With High Output (More Than 1,000 W) for the Period 2022-2032F
- Historical Data and Forecast of Tunisia Power Supply Market Revenues & Volume By Type for the Period 2022-2032F
- Historical Data and Forecast of Tunisia Power Supply Market Revenues & Volume By AC-DC Power Supply for the Period 2022-2032F
- Historical Data and Forecast of Tunisia Power Supply Market Revenues & Volume By DC-DC Power Supply for the Period 2022-2032F
- Historical Data and Forecast of Tunisia Power Supply Market Revenues & Volume By Vertical for the Period 2022-2032F
- Historical Data and Forecast of Tunisia Power Supply Market Revenues & Volume By Medical & Healthcare for the Period 2022-2032F
- Historical Data and Forecast of Tunisia Power Supply Market Revenues & Volume By Military & Aerospace for the Period 2022-2032F
- Historical Data and Forecast of Tunisia Power Supply Market Revenues & Volume By Telecommunications for the Period 2022-2032F
- Historical Data and Forecast of Tunisia Power Supply Market Revenues & Volume By Consumer Electronics for the Period 2022-2032F
- Historical Data and Forecast of Tunisia Power Supply Market Revenues & Volume By Transportation for the Period 2022-2032F
- Historical Data and Forecast of Tunisia Power Supply Market Revenues & Volume By Lighting for the Period 2022-2032F
- Historical Data and Forecast of Tunisia Power Supply Market Revenues & Volume By Food & Beverages for the Period 2022-2032F
- Historical Data and Forecast of Tunisia Power Supply Market Revenues & Volume By Industrial for the Period 2022-2032F
- Tunisia Power Supply Import Export Trade Statistics
- Market Opportunity Assessment By Output Power
- Market Opportunity Assessment By Type
- Market Opportunity Assessment By Vertical
- Tunisia Power Supply Top Companies Market Share
- Tunisia Power Supply Competitive Benchmarking By Technical and Operational Parameters
- Tunisia Power Supply Company Profiles
- Tunisia Power Supply Key Strategic Recommendations
Frequently Asked Questions About the Market Study (FAQs):
The growth is primarily driven by increasing electricity consumption, urbanization, industrial expansion, and the transition towards renewable energy sources.
Challenges include ensuring supply-demand balance, integrating renewable energy into the grid, and addressing energy access disparities, particularly in rural areas.
The government promotes renewable energy projects, diversifies energy sources, ensures affordable electricity tariffs, and invests in infrastructure modernization.
Recent developments include increased foreign investment in renewable technologies, advancement in energy efficiency initiatives, and the prioritization of smart grid technologies.
6Wresearch actively monitors the Tunisia Power Supply Market and publishes its comprehensive annual report, highlighting emerging trends, growth drivers, revenue analysis, and forecast outlook. Our insights help businesses to make data-backed strategic decisions with ongoing market dynamics. Our analysts track relevent industries related to the Tunisia Power Supply Market, allowing our clients with actionable intelligence and reliable forecasts tailored to emerging regional needs.
Yes, we provide customisation as per your requirements. To learn more, feel free to contact us on sales@6wresearch.com
1 Executive Summary |
2 Introduction |
2.1 Key Highlights of the Report |
2.2 Report Description |
2.3 Market Scope & Segmentation |
2.4 Research Methodology |
2.5 Assumptions |
3 Tunisia Power Supply Market Overview |
3.1 Tunisia Country Macro Economic Indicators |
3.2 Tunisia Power Supply Market Revenues & Volume, 2022 & 2032F |
3.3 Tunisia Power Supply Market - Industry Life Cycle |
3.4 Tunisia Power Supply Market - Porter's Five Forces |
3.5 Tunisia Power Supply Market Revenues & Volume Share, By Output Power, 2022 & 2032F |
3.6 Tunisia Power Supply Market Revenues & Volume Share, By Type, 2022 & 2032F |
3.7 Tunisia Power Supply Market Revenues & Volume Share, By Vertical, 2022 & 2032F |
4 Tunisia Power Supply Market Dynamics |
4.1 Impact Analysis |
4.2 Market Drivers |
4.3 Market Restraints |
5 Tunisia Power Supply Market Trends |
6 Tunisia Power Supply Market, By Types |
6.1 Tunisia Power Supply Market, By Output Power |
6.1.1 Overview and Analysis |
6.1.2 Tunisia Power Supply Market Revenues & Volume, By Output Power, 2022-2032F |
6.1.3 Tunisia Power Supply Market Revenues & Volume, By Power Supply With Low Output (500 W and Below), 2022-2032F |
6.1.4 Tunisia Power Supply Market Revenues & Volume, By Power Supply With Medium Output (500?1,000 W), 2022-2032F |
6.1.5 Tunisia Power Supply Market Revenues & Volume, By Power Supply With High Output (More Than 1,000 W), 2022-2032F |
6.2 Tunisia Power Supply Market, By Type |
6.2.1 Overview and Analysis |
6.2.2 Tunisia Power Supply Market Revenues & Volume, By AC-DC Power Supply, 2022-2032F |
6.2.3 Tunisia Power Supply Market Revenues & Volume, By DC-DC Power Supply, 2022-2032F |
6.3 Tunisia Power Supply Market, By Vertical |
6.3.1 Overview and Analysis |
6.3.2 Tunisia Power Supply Market Revenues & Volume, By Medical & Healthcare, 2022-2032F |
6.3.3 Tunisia Power Supply Market Revenues & Volume, By Military & Aerospace, 2022-2032F |
6.3.4 Tunisia Power Supply Market Revenues & Volume, By Telecommunications, 2022-2032F |
6.3.5 Tunisia Power Supply Market Revenues & Volume, By Consumer Electronics, 2022-2032F |
6.3.6 Tunisia Power Supply Market Revenues & Volume, By Transportation, 2022-2032F |
6.3.7 Tunisia Power Supply Market Revenues & Volume, By Lighting, 2022-2032F |
6.3.8 Tunisia Power Supply Market Revenues & Volume, By Industrial, 2022-2032F |
6.3.9 Tunisia Power Supply Market Revenues & Volume, By Industrial, 2022-2032F |
7 Tunisia Power Supply Market Import-Export Trade Statistics |
7.1 Tunisia Power Supply Market Export to Major Countries |
7.2 Tunisia Power Supply Market Imports from Major Countries |
8 Tunisia Power Supply Market Key Performance Indicators |
9 Tunisia Power Supply Market - Opportunity Assessment |
9.1 Tunisia Power Supply Market Opportunity Assessment, By Output Power, 2022 & 2032F |
9.2 Tunisia Power Supply Market Opportunity Assessment, By Type, 2022 & 2032F |
9.3 Tunisia Power Supply Market Opportunity Assessment, By Vertical, 2022 & 2032F |
10 Tunisia Power Supply Market - Competitive Landscape |
10.1 Tunisia Power Supply Market Revenue Share, By Companies, 2025 |
10.2 Tunisia Power Supply Market Competitive Benchmarking, By Operating and Technical Parameters |
11 Company Profiles |
12 Recommendations |
13 Disclaimer |
Global Go To Market Strategy - 2030
Export potential enables firms to identify high-growth global markets with greater confidence by combining advanced trade intelligence with a structured quantitative methodology. The framework analyzes emerging demand trends and country-level import patterns while integrating macroeconomic and trade datasets such as GDP and population forecasts, bilateral import–export flows, tariff structures, elasticity differentials between developed and developing economies, geographic distance, and import demand projections. Using weighted trade values from 2020–2024 as the base period to project country-to-country export potential for 2030, these inputs are operationalized through calculated drivers such as gravity model parameters, tariff impact factors, and projected GDP per-capita growth. Through an analysis of hidden potentials, demand hotspots, and market conditions that are most favorable to success, this method enables firms to focus on target countries, maximize returns, and global expansion with data, backed by accuracy.
By factoring in the projected importer demand gap that is currently unmet and could be potential opportunity, it identifies the potential for the Exporter (Country) among 190 countries, against the general trade analysis, which identifies the biggest importer or exporter.
To discover high-growth global markets and optimize your business strategy:
Click Here
Pricing
- Single User License$ 1,995
- Department License$ 2,400
- Site License$ 3,120
- Global License$ 3,795

Leadership Perspectives from Industry Events
Search
Thought Leadership and Analyst Meet


Our Clients
6WResearch In News
- India Air Conditioner Market Set for Strong Rebound in 2026 After Weather-Led Correction and GST-Driven Recovery: 6Wresearch
- ADAS in India: How Automatic Emergency Braking, Blind Spot Detection & Driver Monitoring are Transforming Road Safety
- Doha a strategic location for EV manufacturing hub: IPA Qatar
- Demand for luxury TVs surging in the GCC, says Samsung
- Empowering Growth: The Thriving Journey of Bangladesh’s Cable Industry
- Demand for luxury TVs surging in the GCC, says Samsung
Latest Reports
- Poland Fire Protection Systems Market (2026-2032)
- Cape Verde Portable Hand-Thrown Extinguisher Market (2026-2032)
- Canada Portable Hand-Thrown Extinguisher Market (2026-2032)
- Cameroon Portable Hand-Thrown Extinguisher Market (2026-2032)
- Burundi Portable Hand-Thrown Extinguisher Market (2026-2032)
- Burkina Faso Portable Hand-Thrown Extinguisher Market (2026-2032)
- Bulgaria Portable Hand-Thrown Extinguisher Market (2026-2032)
- Brunei Portable Hand-Thrown Extinguisher Market (2026-2032)
- Botswana Portable Hand-Thrown Extinguisher Market (2026-2032)
- Bosnia and Herzegovina Portable Hand-Thrown Extinguisher Market (2026-2032)
Industry Events and Analyst Meet

HIMTEX 2026

India Refining Summit 2026

India EV Show 2026

EV tech India Expo 2026

Auto Tech Asia 2026
Whitepaper
- Middle East & Africa Commercial Security Market Click here to view more.
- Middle East & Africa Fire Safety Systems & Equipment Market Click here to view more.
- GCC Drone Market Click here to view more.
- Middle East Lighting Fixture Market Click here to view more.
- GCC Physical & Perimeter Security Market Click here to view more.