Turkey Chemical Packaging Market (2026-2032) | Growth, Industry, Revenue, Share, Companies, Size, Trends, Value, Analysis, Outlook & Forecast
Market Forecast By Product Types (Sacks, Drums, FIBC, Other), By Applications (Pharmaceutical Factory, Laboratory, Chemical Plant, Others) And Competitive Landscape
| Product Code: ETC006898 | Publication Date: Sep 2020 | Updated Date: Jun 2026 | Product Type: Report | |
| Publisher: 6Wresearch | Author: Ravi Bhandari | No. of Pages: 70 | No. of Figures: 35 | No. of Tables: 5 |
Turkey Chemical Packaging Market Summary
The turkey chemical packaging market was estimated at USD 292 Million in 2025 and is projected to reach USD 392 Million by 2032, growing at a CAGR of 5.3% from 2026 to 2032.
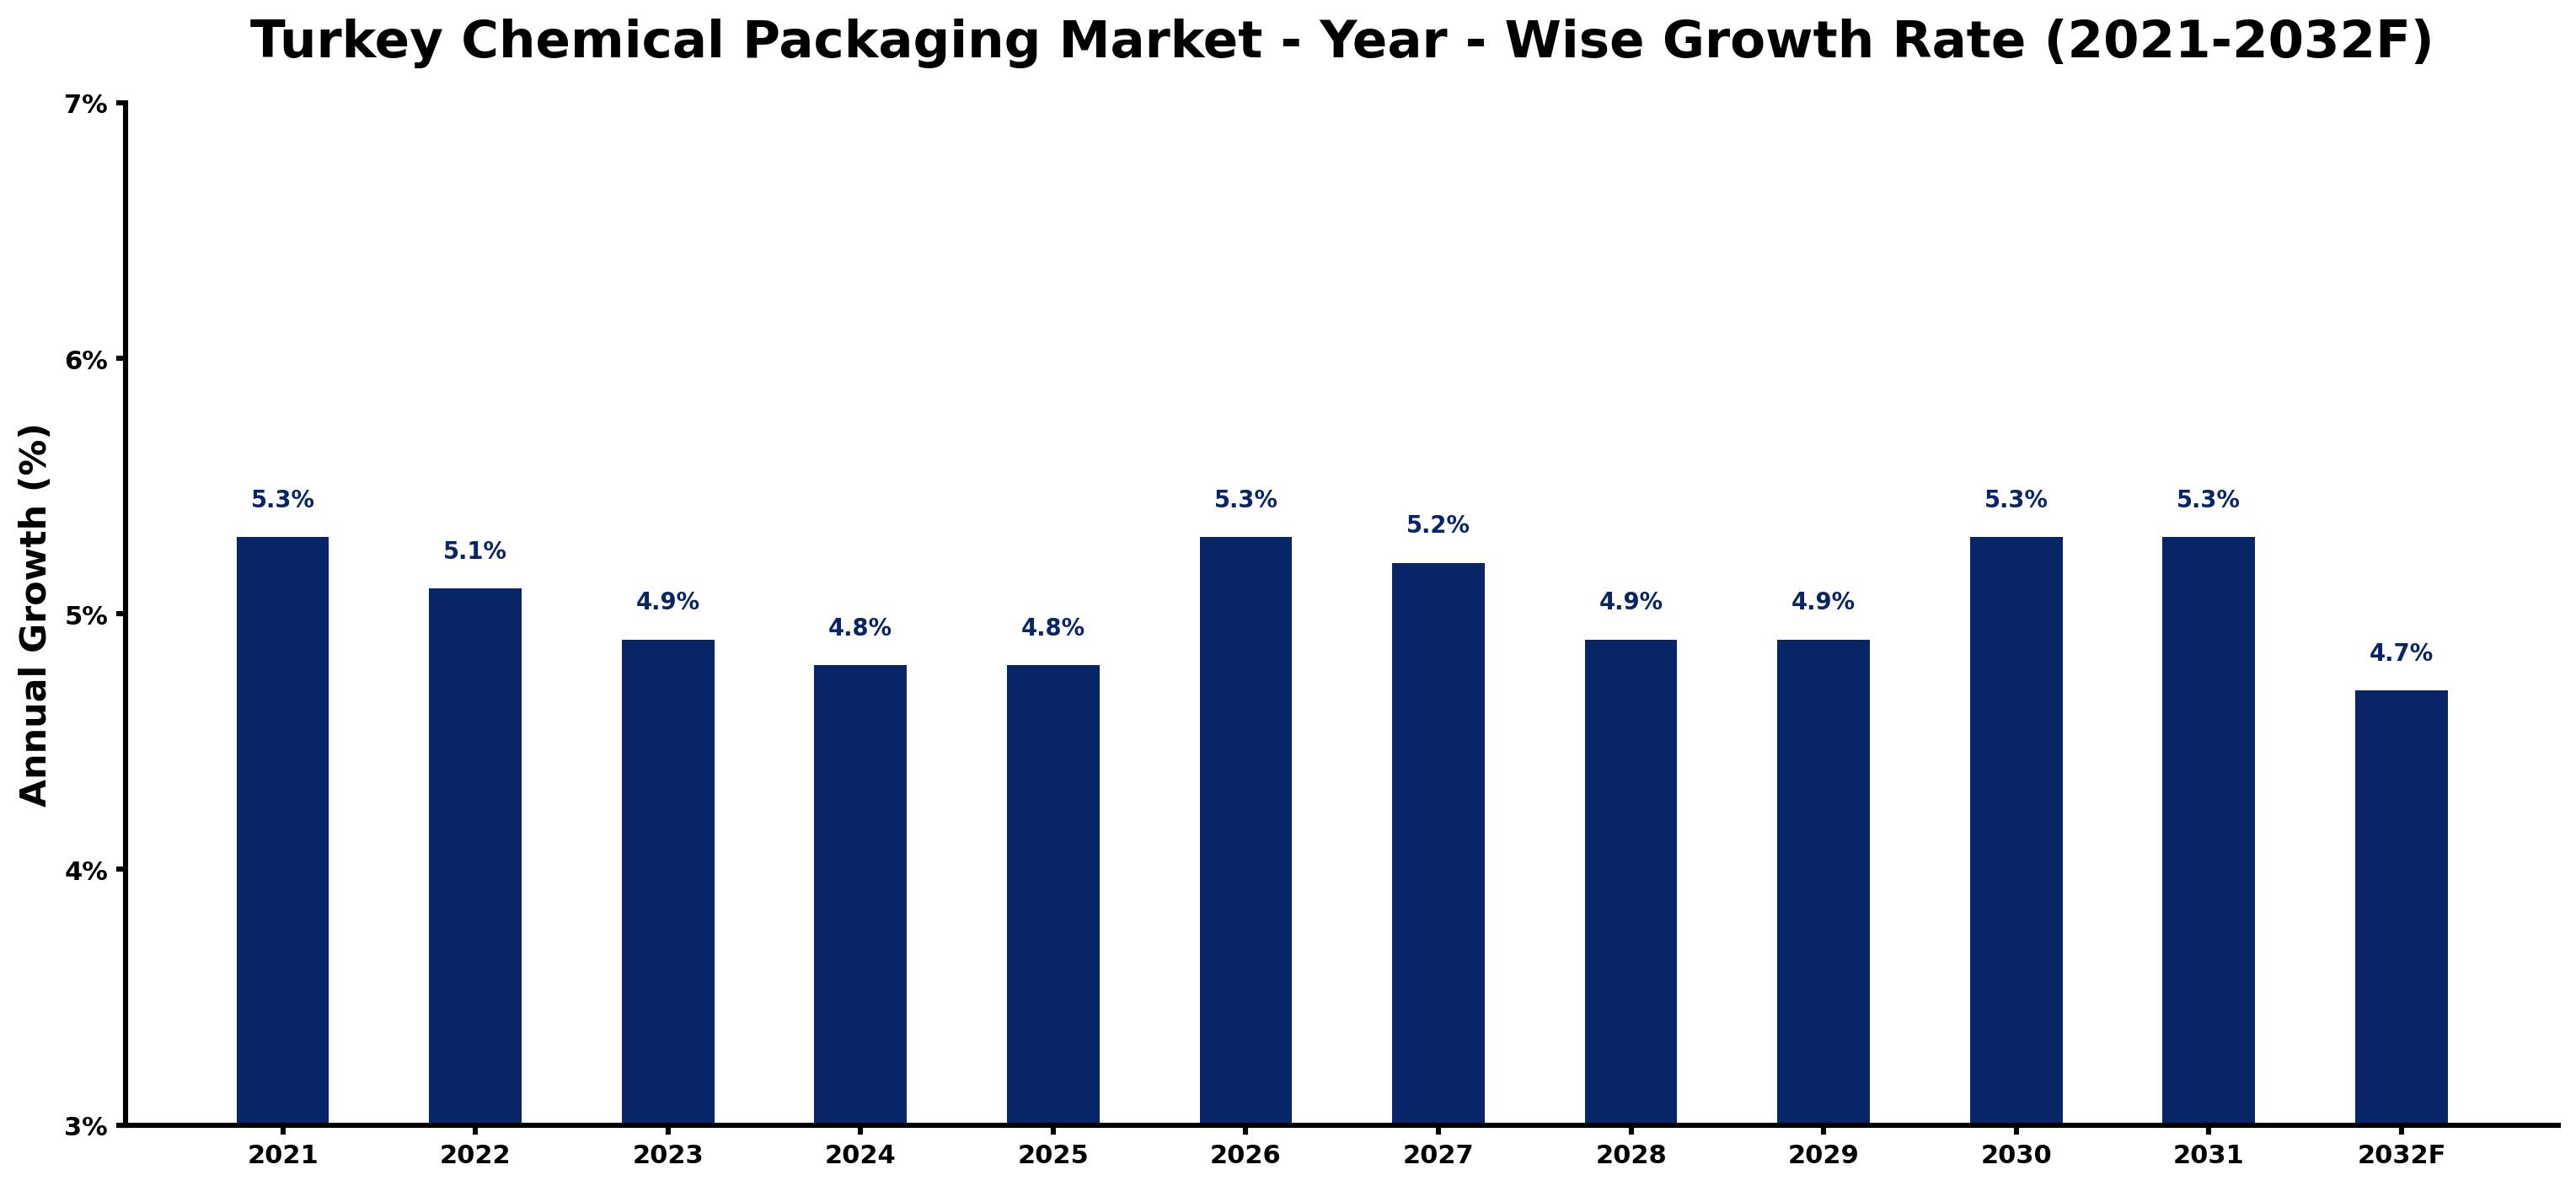
Turkey Chemical Packaging Market Growth Rate Analysis (2021-2032)
The Turkey chemical packaging market has exhibited a stable growth trend, with a notable 5.3% increase in 2021, followed by a slightly declining yet resilient growth rate of 5.1% in 2022 and 4.9% in 2023. This decline can be attributed to global supply chain disruptions and fluctuating raw material costs. However, as Turkey strengthens its industrial base and investment in technology and infrastructure continues, growth is expected to stabilize again, with projections of 5.3% in 2026 and 5.2% in 2027. Policy support for energy transition and increasing consumer demand for sustainable packaging solutions are driving this renewed optimism, even as markets face fluctuations in later years, such as a projected 4.7% in 2032.
Turkey Chemical Packaging Market Year-wise Growth Rate and Key Drivers
This graph highlights how the Turkey Chemical Packaging Market has steadily grown over the past five years, supported by major growth factors.
The table below presents the year wise growth rates along with the key drivers influencing the market
| Year | Growth Rate | Major Drivers |
| 2021 | 5.3% | Post-COVID recovery efforts spotlighted the need for sustainable packaging solutions. |
| 2022 | 5.1% | Local manufacturing initiatives helped decrease dependency on imported chemical packaging materials. |
| 2023 | 4.9% | Increasing environmental awareness led companies to invest in biodegradable packaging alternatives. |
| 2024 | 4.8% | Innovation in smart packaging technologies enhances product safety and shelf life. |
| 2025 | 4.8% | E-commerce expansion triggers demand for customized and protective packaging solutions. |
| 2026 | 5.3% | Regional trade agreements facilitate easier access to chemical packaging resources. |
| 2027 | 5.2% | Integration of automation in manufacturing processes reduces production costs significantly. |
| 2028 | 4.9% | Consumer preferences shift toward eco-friendly materials, bolstering green packaging production. |
| 2029 | 4.9% | Emerging startups focus on niche markets, promoting tailored chemical packaging options. |
| 2030 | 5.3% | The construction sector's growth increases demand for robust packaging in construction chemicals. |
| 2031 | 5.3% | R&D investments drive breakthroughs in lightweight yet durable packaging materials. |
| 2032 | 4.7% | Collaboration among industry players enhances supply chain efficiencies and innovation outputs. |
Note - Market size estimations and growth projections presented in this report are based on 6Wresearch's advanced forecasting approach, validated with industry datasets as of June 2026.
Turkey Chemical Packaging Market Synopsis
The Turkey Chemical Packaging Market is projected to reach 5.3% and witness significant growth during the forecast period (2026-2032). This growth is primarily driven by stringent safety regulations, industrial expansion, and an increasing demand for secure and sustainable packaging solutions for hazardous chemicals. As Turkey's chemical sector continues to evolve, advancements in packaging materials and design innovations will play a crucial role in meeting the market's needs.
Turkey Chemical Packaging Market Growth Drivers
The Turkey Chemical Packaging Market is propelled by several fundamental drivers, each contributing to its expansion. The primary factors influencing market dynamics include:
- Stringent regulatory frameworks necessitating robust safety measures for chemical transport and storage compel companies to adopt high-quality, compliant packaging solutions.
- Continuous innovations in packaging materials enhance chemical compatibility, leading to improved safety and efficiency in handling diverse chemical formulations.
- Heightening environmental concerns are fostering demand for recyclable and biodegradable packaging, aligning with global sustainability trends.
- The growth of the agricultural and pharmaceutical sectors in Turkey spurs demand for specialized chemical packaging tailored to meet industry-specific requirements.
- Increased investments in packaging research and development aim to create advanced, high-barrier, and corrosion-resistant packaging solutions that mitigate risks associated with chemical handling.
Turkey Chemical Packaging Market Challenges and Restraints
While the Turkey Chemical Packaging Market experiences growth, it faces several challenges that could impede its trajectory. Key challenges include:
- Fluctuating raw material prices negatively impact production costs for packaging materials, posing a challenge for manufacturers in maintaining profitability while ensuring quality.
- Competition from alternative packaging materials, such as glass and metals, places pressure on the chemical packaging sector to innovate and differentiate its offerings.
- The need for continuous innovation to improve packaging performance, particularly regarding safety and sustainability, requires significant investment and expertise.
- Compliance with evolving regulatory standards necessitates constant adaptation of packaging designs and processes, increasing operational complexities.
- Supply chain disruptions can hinder the availability of essential packaging materials, affecting production timelines and market supply.
Turkey Chemical Packaging Market Government Investment and Initiatives
The Turkish government plays a vital role in shaping the Chemical Packaging Market through various policies and initiatives aimed at enhancing safety and sustainability within the industry. Recent governmental efforts include:
- The introduction of stringent regulations for handling hazardous materials, ensuring that packaging complies with international safety standards.
- Investment in research and development initiatives to foster innovation in the chemical packaging sector, promoting the development of eco-friendly materials and design practices.
- Support for the modernization of chemical manufacturing infrastructure, facilitating efficient supply chains and improved packaging processes.
- Incentives for companies adopting sustainable practices in packaging, encouraging the transition towards recyclable and biodegradable solutions.
- Public funding for training programs aimed at enhancing the skills of the workforce involved in chemical packaging and logistics.
Turkey Chemical Packaging Market Latest Developments (May 2025 - June 2026)
During the period of May 2025 to June 2026, the Turkey Chemical Packaging Market has seen several noteworthy developments that reflect its dynamic nature. These developments include:
- An increase in collaborations between research institutions and packaging manufacturers aimed at developing new materials that ensure safety and sustainability.
- Growing investments in technology that enhance packaging efficiency, such as automated filling and sealing systems to optimize production lines.
- Emerging trends in smart packaging, where technologies like QR codes and sensors are integrated to improve tracking and safety in the supply chain.
- Regulatory updates emphasizing stricter compliance measures for hazardous materials, prompting companies to reassess their packaging strategies and enhance safety standards.
- A marked shift towards circular economy practices, with companies actively seeking to reduce waste generated from chemical packaging and improve recycling rates.
Turkey Chemical Packaging Market - Key Attractiveness of the Report
- 10 Years of Market Numbers
- Historical Data Starting from 2022 to 2025
- Base Year: 2025
- Forecast Data until 2032
- Key Performance Indicators Impacting the Market
- Major Upcoming Developments and Projects
Key Highlights of the Report:
- Turkey Chemical Packaging Market Outlook
- Market Size of Turkey Chemical Packaging Market, 2025
- Forecast of Turkey Chemical Packaging Market, 2032
- Historical Data and Forecast of Turkey Chemical Packaging Revenues & Volume for the Period 2022-2032F
- Turkey Chemical Packaging Market Trend Evolution
- Turkey Chemical Packaging Market Drivers and Challenges
- Turkey Chemical Packaging Price Trends
- Turkey Chemical Packaging Porter's Five Forces
- Turkey Chemical Packaging Industry Life Cycle
- Historical Data and Forecast of Turkey Chemical Packaging Market Revenues & Volume By Product Types for the Period 2022-2032F
- Historical Data and Forecast of Turkey Chemical Packaging Market Revenues & Volume By Sacks for the Period 2022-2032F
- Historical Data and Forecast of Turkey Chemical Packaging Market Revenues & Volume By Drums for the Period 2022-2032F
- Historical Data and Forecast of Turkey Chemical Packaging Market Revenues & Volume By FIBC for the Period 2022-2032F
- Historical Data and Forecast of Turkey Chemical Packaging Market Revenues & Volume By Other for the Period 2022-2032F
- Historical Data and Forecast of Turkey Chemical Packaging Market Revenues & Volume By Applications for the Period 2022-2032F
- Historical Data and Forecast of Turkey Chemical Packaging Market Revenues & Volume By Pharmaceutical Factory? for the Period 2022-2032F
- Historical Data and Forecast of Turkey Chemical Packaging Market Revenues & Volume By Laboratory for the Period 2022-2032F
- Historical Data and Forecast of Turkey Chemical Packaging Market Revenues & Volume By Chemical Plant? for the Period 2022-2032F
- Historical Data and Forecast of Turkey Chemical Packaging Market Revenues & Volume By Others for the Period 2022-2032F
- Turkey Chemical Packaging Import Export Trade Statistics
- Market Opportunity Assessment By Product Types
- Market Opportunity Assessment By Applications
- Turkey Chemical Packaging Top Companies Market Share
- Turkey Chemical Packaging Competitive Benchmarking By Technical and Operational Parameters
- Turkey Chemical Packaging Company Profiles
- Turkey Chemical Packaging Key Strategic Recommendations
Frequently Asked Questions About the Market Study (FAQs):
The growth is driven by regulatory demands for safety, advancements in packaging technologies, and the expansive chemical manufacturing and distribution sectors.
Challenges include fluctuating raw material prices, competition from alternative packaging materials, and the necessity for ongoing innovation in packaging solutions.
The government supports the sector through regulations promoting safety, investment in research initiatives, and incentives for sustainable packaging practices.
Recent trends include the adoption of smart packaging technologies, increased focus on sustainability, and stricter regulatory compliance measures.
6Wresearch actively monitors the Turkey Chemical Packaging Market and publishes its comprehensive annual report, highlighting emerging trends, growth drivers, revenue analysis, and forecast outlook. Our insights help businesses to make data-backed strategic decisions with ongoing market dynamics. Our analysts track relevent industries related to the Turkey Chemical Packaging Market, allowing our clients with actionable intelligence and reliable forecasts tailored to emerging regional needs.
Yes, we provide customisation as per your requirements. To learn more, feel free to contact us on sales@6wresearch.com
1 Executive Summary |
2 Introduction |
2.1 Key Highlights of the Report |
2.2 Report Description |
2.3 Market Scope & Segmentation |
2.4 Research Methodology |
2.5 Assumptions |
3 Turkey Chemical Packaging Market Overview |
3.1 Turkey Country Macro Economic Indicators |
3.2 Turkey Chemical Packaging Market Revenues & Volume, 2022 & 2032F |
3.3 Turkey Chemical Packaging Market - Industry Life Cycle |
3.4 Turkey Chemical Packaging Market - Porter's Five Forces |
3.5 Turkey Chemical Packaging Market Revenues & Volume Share, By Product Types, 2022 & 2032F |
3.6 Turkey Chemical Packaging Market Revenues & Volume Share, By Applications, 2022 & 2032F |
4 Turkey Chemical Packaging Market Dynamics |
4.1 Impact Analysis |
4.2 Market Drivers |
4.2.1 Increasing demand for chemical packaging due to growth in the chemical industry in Turkey |
4.2.2 Stringent regulations on packaging materials leading to the adoption of specialized chemical packaging solutions |
4.2.3 Technological advancements in packaging materials enhancing the safety and durability of chemical packaging |
4.3 Market Restraints |
4.3.1 Fluctuating raw material prices impacting the cost of chemical packaging production |
4.3.2 Environmental concerns pushing for sustainable packaging solutions, which may require additional investments |
4.3.3 Competition from alternative packaging solutions such as bulk containers or flexible packaging options |
5 Turkey Chemical Packaging Market Trends |
6 Turkey Chemical Packaging Market, By Types |
6.1 Turkey Chemical Packaging Market, By Product Types |
6.1.1 Overview and Analysis |
6.1.2 Turkey Chemical Packaging Market Revenues & Volume, By Product Types, 2022-2032F |
6.1.3 Turkey Chemical Packaging Market Revenues & Volume, By Sacks, 2022-2032F |
6.1.4 Turkey Chemical Packaging Market Revenues & Volume, By Drums, 2022-2032F |
6.1.5 Turkey Chemical Packaging Market Revenues & Volume, By FIBC, 2022-2032F |
6.1.6 Turkey Chemical Packaging Market Revenues & Volume, By Other, 2022-2032F |
6.2 Turkey Chemical Packaging Market, By Applications |
6.2.1 Overview and Analysis |
6.2.2 Turkey Chemical Packaging Market Revenues & Volume, By Pharmaceutical Factory , 2022-2032F |
6.2.3 Turkey Chemical Packaging Market Revenues & Volume, By Laboratory, 2022-2032F |
6.2.4 Turkey Chemical Packaging Market Revenues & Volume, By Chemical Plant , 2022-2032F |
6.2.5 Turkey Chemical Packaging Market Revenues & Volume, By Others, 2022-2032F |
7 Turkey Chemical Packaging Market Import-Export Trade Statistics |
7.1 Turkey Chemical Packaging Market Export to Major Countries |
7.2 Turkey Chemical Packaging Market Imports from Major Countries |
8 Turkey Chemical Packaging Market Key Performance Indicators |
8.1 Percentage of chemical companies in Turkey adopting specialized chemical packaging solutions |
8.2 Rate of adoption of eco-friendly packaging materials in the chemical packaging market in Turkey |
8.3 Number of technological innovations introduced in chemical packaging materials and designs in Turkey |
9 Turkey Chemical Packaging Market - Opportunity Assessment |
9.1 Turkey Chemical Packaging Market Opportunity Assessment, By Product Types, 2022 & 2032F |
9.2 Turkey Chemical Packaging Market Opportunity Assessment, By Applications, 2022 & 2032F |
10 Turkey Chemical Packaging Market - Competitive Landscape |
10.1 Turkey Chemical Packaging Market Revenue Share, By Companies, 2025 |
10.2 Turkey Chemical Packaging Market Competitive Benchmarking, By Operating and Technical Parameters |
11 Company Profiles |
12 Recommendations |
13 Disclaimer |
Global Go To Market Strategy - 2030
Export potential enables firms to identify high-growth global markets with greater confidence by combining advanced trade intelligence with a structured quantitative methodology. The framework analyzes emerging demand trends and country-level import patterns while integrating macroeconomic and trade datasets such as GDP and population forecasts, bilateral import–export flows, tariff structures, elasticity differentials between developed and developing economies, geographic distance, and import demand projections. Using weighted trade values from 2020–2024 as the base period to project country-to-country export potential for 2030, these inputs are operationalized through calculated drivers such as gravity model parameters, tariff impact factors, and projected GDP per-capita growth. Through an analysis of hidden potentials, demand hotspots, and market conditions that are most favorable to success, this method enables firms to focus on target countries, maximize returns, and global expansion with data, backed by accuracy.
By factoring in the projected importer demand gap that is currently unmet and could be potential opportunity, it identifies the potential for the Exporter (Country) among 190 countries, against the general trade analysis, which identifies the biggest importer or exporter.
To discover high-growth global markets and optimize your business strategy:
Click Here
Pricing
- Single User License$ 1,995
- Department License$ 2,400
- Site License$ 3,120
- Global License$ 3,795

Leadership Perspectives from Industry Events
Search
Thought Leadership and Analyst Meet


Our Clients
6WResearch In News
- India Air Conditioner Market Set for Strong Rebound in 2026 After Weather-Led Correction and GST-Driven Recovery: 6Wresearch
- ADAS in India: How Automatic Emergency Braking, Blind Spot Detection & Driver Monitoring are Transforming Road Safety
- Doha a strategic location for EV manufacturing hub: IPA Qatar
- Demand for luxury TVs surging in the GCC, says Samsung
- Empowering Growth: The Thriving Journey of Bangladesh’s Cable Industry
- Demand for luxury TVs surging in the GCC, says Samsung
Latest Reports
- Poland Fire Protection Systems Market (2026-2032)
- Cape Verde Portable Hand-Thrown Extinguisher Market (2026-2032)
- Canada Portable Hand-Thrown Extinguisher Market (2026-2032)
- Cameroon Portable Hand-Thrown Extinguisher Market (2026-2032)
- Burundi Portable Hand-Thrown Extinguisher Market (2026-2032)
- Burkina Faso Portable Hand-Thrown Extinguisher Market (2026-2032)
- Bulgaria Portable Hand-Thrown Extinguisher Market (2026-2032)
- Brunei Portable Hand-Thrown Extinguisher Market (2026-2032)
- Botswana Portable Hand-Thrown Extinguisher Market (2026-2032)
- Bosnia and Herzegovina Portable Hand-Thrown Extinguisher Market (2026-2032)
Industry Events and Analyst Meet

HIMTEX 2026

India Refining Summit 2026

India EV Show 2026

EV tech India Expo 2026

Auto Tech Asia 2026
Whitepaper
- Middle East & Africa Commercial Security Market Click here to view more.
- Middle East & Africa Fire Safety Systems & Equipment Market Click here to view more.
- GCC Drone Market Click here to view more.
- Middle East Lighting Fixture Market Click here to view more.
- GCC Physical & Perimeter Security Market Click here to view more.