United Arab Emirates (UAE) Fish Processing Market (2026-2032) | Growth, Value, Size, Share, Companies, Forecast, Industry, Revenue, Outlook, Trends & Analysis
Market Forecast By Source (Marine, Inland, Freshwater), By Application (Food, Feed, Biomedical, Others), By Processing (Frozen, Preserved, Others), By Equipment (Gutting, Scaling, Filleting, Deboning, Skinning, Curing & Smoking, Others) And Competitive Landscape
| Product Code: ETC042620 | Publication Date: Aug 2023 | Updated Date: Jun 2026 | Product Type: Report | |
| Publisher: 6Wresearch | Author: Ravi Bhandari | No. of Pages: 70 | No. of Figures: 35 | No. of Tables: 5 |
United Arab Emirates (UAE) Fish Processing Market Summary
The united arab emirates (uae) fish processing market was estimated at USD 291 Million in 2025 and is projected to reach USD 390 Million by 2032, growing at a CAGR of 5.2% from 2026 to 2032.
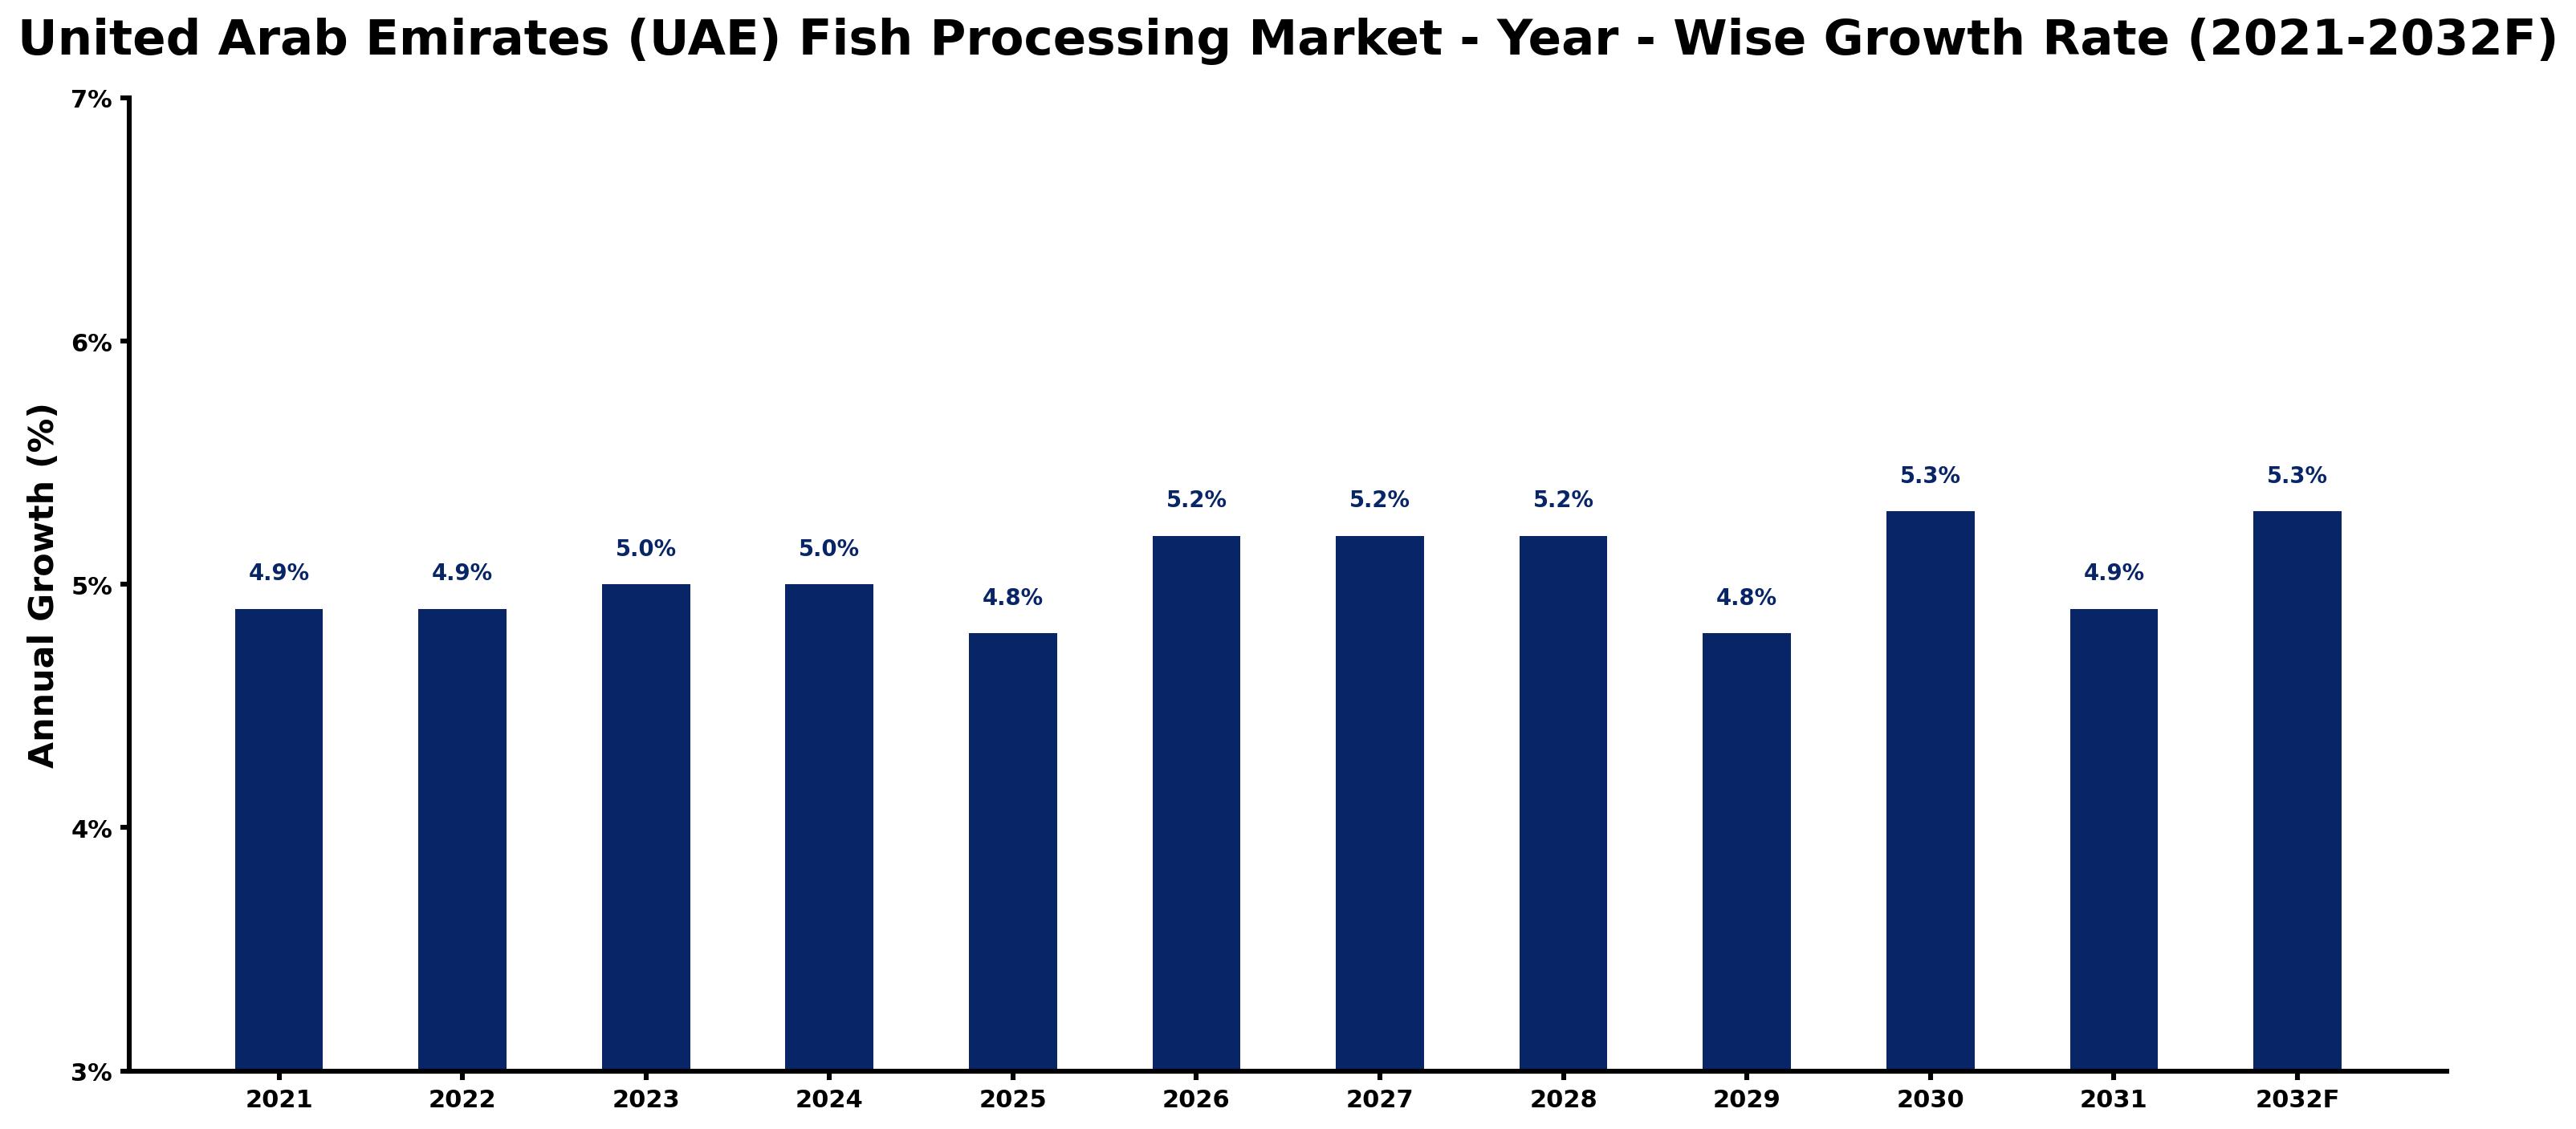
United Arab Emirates (UAE) Fish Processing Market Growth Rate Analysis (2021-2032)
The fish processing market in the United Arab Emirates is poised for stable growth, with expected annual increases around 4.9% in 2021 and 2022, rising slightly to 5.0% in 2023 and 2024. This steady progression can be attributed to heightened consumer demand for processed seafood, driven by an evolving culinary culture and increased health consciousness among the population. The sector is benefiting from technological advancements and investments in modern processing facilities, which enhance product quality and shelf life. Though fluctuations occur, such as a slight dip to 4.8% in 2025, the market rebounds with a stronger projected growth of 5.3% in 2030 and 2032, reflecting ongoing infrastructure developments and supportive government policies aimed at boosting the fisheries sector.
United Arab Emirates (UAE) Fish Processing Market Year-wise Growth Rate and Key Drivers
This graph highlights how the United Arab Emirates (UAE) Fish Processing Market has steadily grown over the past five years, supported by major growth factors.
The table below presents the year wise growth rates along with the key drivers influencing the market
| Year | Growth Rate | Major Drivers |
| 2021 | 4.9% | Post-lockdown retail projects fostered heightened consumer interest in processed fish products. |
| 2022 | 4.9% | Investment in advanced processing technology improved product quality and operational efficiency significantly. |
| 2023 | 5.0% | Local seafood demand surged as culinary tourism expanded throughout various UAE emirates. |
| 2024 | 5.0% | Sustainable fishing practices gained traction, influencing consumer preferences and brand loyalty. |
| 2025 | 4.8% | Rising health awareness prompted increased consumption of nutritious seafood and convenience items. |
| 2026 | 5.2% | Emergence of e-commerce platforms reshaped distribution channels for fish processing companies. |
| 2027 | 5.2% | Innovative packaging solutions enhanced product shelf-life, appealing to both local and export markets. |
| 2028 | 5.2% | Regional cooperation encouraged supply chain efficiencies, boosting cross-border fish trade dynamics. |
| 2029 | 4.8% | Investment in aquaculture technologies complemented wild catch, diversifying market offerings effectively. |
| 2030 | 5.3% | Focus on food security led to government support for homegrown fish processing startups. |
| 2031 | 4.9% | Collaborations with restaurants emphasized local sourcing, shaping consumer preferences significantly. |
| 2032 | 5.3% | The rise of food delivery apps integrated processed fish products into mainstream diets. |
Note - Market size estimations and growth projections presented in this report are based on 6Wresearch's advanced forecasting approach, validated with industry datasets as of June 2026.
United Arab Emirates (UAE) Fish Processing Market Synopsis
The United Arab Emirates (UAE) Fish Processing Market is projected to reach 5.2% and witness significant growth during the forecast period (2026-2032). This growth is driven by the increasing demand for seafood products, enhanced processing capabilities, and the UAE's strategic positioning as a vital hub for trade and tourism in the Middle East. The fish processing market encompasses a variety of activities, including the processing, packaging, and distribution of fish and seafood products for both domestic consumption and export, reflecting the country's deep-rooted culinary traditions and rising health consciousness among consumers.
United Arab Emirates (UAE) Fish Processing Market Growth Drivers
The UAE fish processing market is bolstered by several key drivers that contribute to its sustained growth. Firstly, the high demand for seafood within the region plays a pivotal role. Traditional diets heavily feature fish, which has made it a staple in many households, while the tourism sector fuels demand from visitors seeking authentic culinary experiences. Additionally, the shift toward health-conscious eating habits among consumers has increased the popularity of seafood, recognized for its nutritional benefits.
- Advancements in processing technology are enhancing the quality and safety of seafood products, which is crucial for both domestic consumption and export markets. Modern techniques improve shelf life and reduce waste, further driving market growth.
- The UAE's strategic geographic location facilitates easy access to global markets, ensuring efficient distribution channels and attracting investment in the fish processing sector.
- Growing awareness about the environmental impact of fishing has led to a demand for sustainably sourced seafood, prompting businesses to adopt responsible fishing practices and aquaculture methods.
- Government initiatives aimed at boosting the local seafood industry, including funding for research and infrastructure development, are promoting advancements within the fish processing market.
- Rising income levels among the UAE population are allowing consumers to opt for higher-quality seafood options, accelerating market growth as preferences shift toward premium products.
United Arab Emirates (UAE) Fish Processing Market Challenges and Restraints
Despite the promising outlook for the UAE fish processing market, several challenges must be addressed to ensure sustainable growth. The need for sustainable fishing practices emerges as a primary concern, as increased demand can lead to overfishing, threatening marine ecosystems. Additionally, fluctuating global seafood prices can create instability in the market, impacting profitability for businesses. Regulatory compliance related to food safety and environmental standards also presents challenges, as firms must navigate complex requirements to remain competitive.
- Climate change poses a long-term threat to fish populations and aquatic ecosystems, potentially affecting fish availability and impacting local fisheries.
- Supply chain disruptions, particularly those noted during the Covid-19 pandemic, highlight the vulnerabilities within the industry and emphasize the necessity of robust contingency planning.
- Competition from low-cost seafood imports may pressure local processors to keep prices competitive while still ensuring quality, which can be challenging.
- The high initial investment required for advanced processing technologies may deter smaller players from entering the market or upgrading their facilities.
- A lack of skilled labor in specialized processing techniques can hinder the efficiency and quality of production, necessitating investment in training and development.
United Arab Emirates (UAE) Fish Processing Market Government Investment and Initiatives
The UAE government has recognized the importance of the fish processing sector and is actively promoting initiatives aimed at fostering industry growth. Public investment in infrastructure improvements, such as ports and cold storage facilities, aims to streamline operations and enhance the efficiency of seafood distribution. Additionally, government agencies are focusing on sustainability projects that support responsible fishing practices and aquaculture development.
- Funding for research and innovation in fish farming techniques is being prioritized to ensure a sustainable supply of seafood, which is critical in balancing demand and environmental stewardship.
- The UAE has implemented policies that promote economic diversification away from oil dependency; the fish processing market is an integral part of this vision, helping to create job opportunities in rural areas.
- Collaboration between public and private sectors is encouraged to drive technological advancements in processing methods, ultimately enhancing product quality and safety standards.
- Government-sponsored training programs aim to equip local workers with the necessary skills for employment in the fish processing industry, addressing the skill gap currently observed.
- Incentives for local fish processors are being introduced to encourage sustainable practices, promoting a shift towards eco-friendly strategies that align with global environmental standards.
United Arab Emirates (UAE) Fish Processing Market Latest Developments (May 2025 - June 2026)
The period from May 2025 to June 2026 has been marked by several notable developments in the UAE fish processing market. Industry stakeholders have increasingly focused on innovation to enhance efficiency and sustainability, with a growing emphasis on eco-friendly practices. Collaborative efforts between various seafood companies have led to the establishment of best practice guidelines aimed at improving the overall sustainability of fish processing operations.
- New processing facilities have been established, equipped with state-of-the-art technology designed to optimize productivity and maintain product quality.
- Food safety regulations have been tightened, driving processors to adopt more rigorous quality control measures, thereby increasing consumer trust in local seafood products.
- The growing trend of online seafood sales has emerged, making it easier for consumers to access high-quality products from local fish processors directly.
- Awareness campaigns regarding seafood sustainability have gained momentum, helping educate consumers about responsible seafood choices and supporting local fishing communities.
- Research initiatives, backed by government funding, have begun yielding results in improved aquaculture practices, promoting a more sustainable approach to seafood production.
United Arab Emirates (UAE) Fish Processing Market - Key Attractiveness of the Report
- 10 Years of Market Numbers
- Historical Data Starting from 2022 to 2025
- Base Year: 2025
- Forecast Data until 2032
- Key Performance Indicators Impacting the Market
- Major Upcoming Developments and Projects
Key Highlights of the Report:
- United Arab Emirates (UAE) Fish Processing Market Outlook
- Market Size of United Arab Emirates (UAE) Fish Processing Market, 2025
- Forecast of United Arab Emirates (UAE) Fish Processing Market, 2032
- Historical Data and Forecast of United Arab Emirates (UAE) Fish Processing Revenues & Volume for the Period 2022-2032F
- United Arab Emirates (UAE) Fish Processing Market Trend Evolution
- United Arab Emirates (UAE) Fish Processing Market Drivers and Challenges
- United Arab Emirates (UAE) Fish Processing Price Trends
- United Arab Emirates (UAE) Fish Processing Porter's Five Forces
- United Arab Emirates (UAE) Fish Processing Industry Life Cycle
- Historical Data and Forecast of United Arab Emirates (UAE) Fish Processing Market Revenues & Volume By Source for the Period 2022-2032F
- Historical Data and Forecast of United Arab Emirates (UAE) Fish Processing Market Revenues & Volume By Marine for the Period 2022-2032F
- Historical Data and Forecast of United Arab Emirates (UAE) Fish Processing Market Revenues & Volume By Inland for the Period 2022-2032F
- Historical Data and Forecast of United Arab Emirates (UAE) Fish Processing Market Revenues & Volume By Freshwater for the Period 2022-2032F
- Historical Data and Forecast of United Arab Emirates (UAE) Fish Processing Market Revenues & Volume By Application for the Period 2022-2032F
- Historical Data and Forecast of United Arab Emirates (UAE) Fish Processing Market Revenues & Volume By Food for the Period 2022-2032F
- Historical Data and Forecast of United Arab Emirates (UAE) Fish Processing Market Revenues & Volume By Feed for the Period 2022-2032F
- Historical Data and Forecast of United Arab Emirates (UAE) Fish Processing Market Revenues & Volume By Biomedical for the Period 2022-2032F
- Historical Data and Forecast of United Arab Emirates (UAE) Fish Processing Market Revenues & Volume By Others for the Period 2022-2032F
- Historical Data and Forecast of United Arab Emirates (UAE) Fish Processing Market Revenues & Volume By Processing for the Period 2022-2032F
- Historical Data and Forecast of United Arab Emirates (UAE) Fish Processing Market Revenues & Volume By Frozen for the Period 2022-2032F
- Historical Data and Forecast of United Arab Emirates (UAE) Fish Processing Market Revenues & Volume By Preserved for the Period 2022-2032F
- Historical Data and Forecast of United Arab Emirates (UAE) Fish Processing Market Revenues & Volume By Others for the Period 2022-2032F
- Historical Data and Forecast of United Arab Emirates (UAE) Fish Processing Market Revenues & Volume By Equipment for the Period 2022-2032F
- Historical Data and Forecast of United Arab Emirates (UAE) Fish Processing Market Revenues & Volume By Gutting for the Period 2022-2032F
- Historical Data and Forecast of United Arab Emirates (UAE) Fish Processing Market Revenues & Volume By Scaling for the Period 2022-2032F
- Historical Data and Forecast of United Arab Emirates (UAE) Fish Processing Market Revenues & Volume By Filleting for the Period 2022-2032F
- Historical Data and Forecast of United Arab Emirates (UAE) Fish Processing Market Revenues & Volume By Deboning for the Period 2022-2032F
- Historical Data and Forecast of United Arab Emirates (UAE) Fish Processing Market Revenues & Volume By Skinning for the Period 2022-2032F
- Historical Data and Forecast of United Arab Emirates (UAE) Fish Processing Market Revenues & Volume By Curing & Smoking for the Period 2022-2032F
- Historical Data and Forecast of United Arab Emirates (UAE) Fish Processing Market Revenues & Volume By Others for the Period 2022-2032F
- United Arab Emirates (UAE) Fish Processing Import Export Trade Statistics
- Market Opportunity Assessment By Source
- Market Opportunity Assessment By Application
- Market Opportunity Assessment By Processing
- Market Opportunity Assessment By Equipment
- United Arab Emirates (UAE) Fish Processing Top Companies Market Share
- United Arab Emirates (UAE) Fish Processing Competitive Benchmarking By Technical and Operational Parameters
- United Arab Emirates (UAE) Fish Processing Company Profiles
- United Arab Emirates (UAE) Fish Processing Key Strategic Recommendations
Frequently Asked Questions About the Market Study (FAQs):
The primary drivers include the high demand for seafood, advancements in processing technology, government initiatives supporting sustainability, and the UAE's strategic location as a trade hub.
Challenges include the necessity for sustainable fishing practices, regulatory compliance, competition from imports, and the impacts of climate change.
The pandemic led to supply chain disruptions and shifts in consumer behavior, but the market has begun to recover as restrictions have eased and food service operations resumed.
Government investment is crucial as it supports infrastructure development, promotes sustainability initiatives, and fosters innovation within the fish processing sector.
6Wresearch actively monitors the United Arab Emirates (UAE) Fish Processing Market and publishes its comprehensive annual report, highlighting emerging trends, growth drivers, revenue analysis, and forecast outlook. Our insights help businesses to make data-backed strategic decisions with ongoing market dynamics. Our analysts track relevent industries related to the United Arab Emirates (UAE) Fish Processing Market, allowing our clients with actionable intelligence and reliable forecasts tailored to emerging regional needs.
Yes, we provide customisation as per your requirements. To learn more, feel free to contact us on sales@6wresearch.com
1 Executive Summary |
2 Introduction |
2.1 Key Highlights of the Report |
2.2 Report Description |
2.3 Market Scope & Segmentation |
2.4 Research Methodology |
2.5 Assumptions |
3 United Arab Emirates (UAE) Fish Processing Market Overview |
3.1 United Arab Emirates (UAE) Country Macro Economic Indicators |
3.2 United Arab Emirates (UAE) Fish Processing Market Revenues & Volume, 2022 & 2032F |
3.3 United Arab Emirates (UAE) Fish Processing Market - Industry Life Cycle |
3.4 United Arab Emirates (UAE) Fish Processing Market - Porter's Five Forces |
3.5 United Arab Emirates (UAE) Fish Processing Market Revenues & Volume Share, By Source, 2022 & 2032F |
3.6 United Arab Emirates (UAE) Fish Processing Market Revenues & Volume Share, By Application, 2022 & 2032F |
3.7 United Arab Emirates (UAE) Fish Processing Market Revenues & Volume Share, By Processing, 2022 & 2032F |
3.8 United Arab Emirates (UAE) Fish Processing Market Revenues & Volume Share, By Equipment, 2022 & 2032F |
4 United Arab Emirates (UAE) Fish Processing Market Dynamics |
4.1 Impact Analysis |
4.2 Market Drivers |
4.2.1 Growing demand for processed fish products in the UAE due to changing consumer preferences towards convenient and healthy food options. |
4.2.2 Increase in government initiatives to promote the fisheries sector and enhance food security in the country. |
4.2.3 Technological advancements in fish processing techniques leading to improved quality and shelf life of processed fish products. |
4.3 Market Restraints |
4.3.1 Fluctuating raw material prices impacting the cost of fish processing operations. |
4.3.2 Stringent regulations and compliance requirements related to food safety and quality standards. |
4.3.3 Competition from imported processed fish products affecting the market share of local fish processors. |
5 United Arab Emirates (UAE) Fish Processing Market Trends |
6 United Arab Emirates (UAE) Fish Processing Market, By Types |
6.1 United Arab Emirates (UAE) Fish Processing Market, By Source |
6.1.1 Overview and Analysis |
6.1.2 United Arab Emirates (UAE) Fish Processing Market Revenues & Volume, By Source, 2022-2032F |
6.1.3 United Arab Emirates (UAE) Fish Processing Market Revenues & Volume, By Marine, 2022-2032F |
6.1.4 United Arab Emirates (UAE) Fish Processing Market Revenues & Volume, By Inland, 2022-2032F |
6.1.5 United Arab Emirates (UAE) Fish Processing Market Revenues & Volume, By Freshwater, 2022-2032F |
6.2 United Arab Emirates (UAE) Fish Processing Market, By Application |
6.2.1 Overview and Analysis |
6.2.2 United Arab Emirates (UAE) Fish Processing Market Revenues & Volume, By Food, 2022-2032F |
6.2.3 United Arab Emirates (UAE) Fish Processing Market Revenues & Volume, By Feed, 2022-2032F |
6.2.4 United Arab Emirates (UAE) Fish Processing Market Revenues & Volume, By Biomedical, 2022-2032F |
6.2.5 United Arab Emirates (UAE) Fish Processing Market Revenues & Volume, By Others, 2022-2032F |
6.3 United Arab Emirates (UAE) Fish Processing Market, By Processing |
6.3.1 Overview and Analysis |
6.3.2 United Arab Emirates (UAE) Fish Processing Market Revenues & Volume, By Frozen, 2022-2032F |
6.3.3 United Arab Emirates (UAE) Fish Processing Market Revenues & Volume, By Preserved, 2022-2032F |
6.3.4 United Arab Emirates (UAE) Fish Processing Market Revenues & Volume, By Others, 2022-2032F |
6.4 United Arab Emirates (UAE) Fish Processing Market, By Equipment |
6.4.1 Overview and Analysis |
6.4.2 United Arab Emirates (UAE) Fish Processing Market Revenues & Volume, By Gutting, 2022-2032F |
6.4.3 United Arab Emirates (UAE) Fish Processing Market Revenues & Volume, By Scaling, 2022-2032F |
6.4.4 United Arab Emirates (UAE) Fish Processing Market Revenues & Volume, By Filleting, 2022-2032F |
6.4.5 United Arab Emirates (UAE) Fish Processing Market Revenues & Volume, By Deboning, 2022-2032F |
6.4.6 United Arab Emirates (UAE) Fish Processing Market Revenues & Volume, By Skinning, 2022-2032F |
6.4.7 United Arab Emirates (UAE) Fish Processing Market Revenues & Volume, By Curing & Smoking, 2022-2032F |
7 United Arab Emirates (UAE) Fish Processing Market Import-Export Trade Statistics |
7.1 United Arab Emirates (UAE) Fish Processing Market Export to Major Countries |
7.2 United Arab Emirates (UAE) Fish Processing Market Imports from Major Countries |
8 United Arab Emirates (UAE) Fish Processing Market Key Performance Indicators |
8.1 Percentage increase in domestic consumption of processed fish products. |
8.2 Adoption rate of advanced fish processing technologies in the UAE. |
8.3 Number of new product launches in the processed fish category by local fish processing companies. |
9 United Arab Emirates (UAE) Fish Processing Market - Opportunity Assessment |
9.1 United Arab Emirates (UAE) Fish Processing Market Opportunity Assessment, By Source, 2022 & 2032F |
9.2 United Arab Emirates (UAE) Fish Processing Market Opportunity Assessment, By Application, 2022 & 2032F |
9.3 United Arab Emirates (UAE) Fish Processing Market Opportunity Assessment, By Processing, 2022 & 2032F |
9.4 United Arab Emirates (UAE) Fish Processing Market Opportunity Assessment, By Equipment, 2022 & 2032F |
10 United Arab Emirates (UAE) Fish Processing Market - Competitive Landscape |
10.1 United Arab Emirates (UAE) Fish Processing Market Revenue Share, By Companies, 2025 |
10.2 United Arab Emirates (UAE) Fish Processing Market Competitive Benchmarking, By Operating and Technical Parameters |
11 Company Profiles |
12 Recommendations |
13 Disclaimer |
Global Go To Market Strategy - 2030
Export potential enables firms to identify high-growth global markets with greater confidence by combining advanced trade intelligence with a structured quantitative methodology. The framework analyzes emerging demand trends and country-level import patterns while integrating macroeconomic and trade datasets such as GDP and population forecasts, bilateral import–export flows, tariff structures, elasticity differentials between developed and developing economies, geographic distance, and import demand projections. Using weighted trade values from 2020–2024 as the base period to project country-to-country export potential for 2030, these inputs are operationalized through calculated drivers such as gravity model parameters, tariff impact factors, and projected GDP per-capita growth. Through an analysis of hidden potentials, demand hotspots, and market conditions that are most favorable to success, this method enables firms to focus on target countries, maximize returns, and global expansion with data, backed by accuracy.
By factoring in the projected importer demand gap that is currently unmet and could be potential opportunity, it identifies the potential for the Exporter (Country) among 190 countries, against the general trade analysis, which identifies the biggest importer or exporter.
To discover high-growth global markets and optimize your business strategy:
Click Here
Pricing
- Single User License$ 1,995
- Department License$ 2,400
- Site License$ 3,120
- Global License$ 3,795

Leadership Perspectives from Industry Events
Search
Thought Leadership and Analyst Meet


Our Clients
6WResearch In News
- India Air Conditioner Market Set for Strong Rebound in 2026 After Weather-Led Correction and GST-Driven Recovery: 6Wresearch
- ADAS in India: How Automatic Emergency Braking, Blind Spot Detection & Driver Monitoring are Transforming Road Safety
- Doha a strategic location for EV manufacturing hub: IPA Qatar
- Demand for luxury TVs surging in the GCC, says Samsung
- Empowering Growth: The Thriving Journey of Bangladesh’s Cable Industry
- Demand for luxury TVs surging in the GCC, says Samsung
Latest Reports
- Poland Fire Protection Systems Market (2026-2032)
- Cape Verde Portable Hand-Thrown Extinguisher Market (2026-2032)
- Canada Portable Hand-Thrown Extinguisher Market (2026-2032)
- Cameroon Portable Hand-Thrown Extinguisher Market (2026-2032)
- Burundi Portable Hand-Thrown Extinguisher Market (2026-2032)
- Burkina Faso Portable Hand-Thrown Extinguisher Market (2026-2032)
- Bulgaria Portable Hand-Thrown Extinguisher Market (2026-2032)
- Brunei Portable Hand-Thrown Extinguisher Market (2026-2032)
- Botswana Portable Hand-Thrown Extinguisher Market (2026-2032)
- Bosnia and Herzegovina Portable Hand-Thrown Extinguisher Market (2026-2032)
Industry Events and Analyst Meet

HIMTEX 2026

India Refining Summit 2026

India EV Show 2026

EV tech India Expo 2026

Auto Tech Asia 2026
Whitepaper
- Middle East & Africa Commercial Security Market Click here to view more.
- Middle East & Africa Fire Safety Systems & Equipment Market Click here to view more.
- GCC Drone Market Click here to view more.
- Middle East Lighting Fixture Market Click here to view more.
- GCC Physical & Perimeter Security Market Click here to view more.